1068
Functional Assessment of Brown Adipose Tissue by T2 Mapping1Experimental Cardiovascular Imaging, Heinrich Heine University, Düsseldorf, Germany, 2Pharmacology and Clinical Pharmacology, Heinrich Heine University, Düsseldorf, Germany
Synopsis
Within the last decade, the scientific interest in brown adipose tissue (BAT) was greatly invigorated by the discovery of functional BAT in adult humans. Importantly, reduced BAT activity has recently been associated with predisposition to obesity and abnormal glucose homeostasis. The current gold standard for functional BAT imaging is CT-guided 18FDG-PET. Here, we describe a robust T2 mapping method to assess the metabolic activity of BAT independent of substrate selection and without the need of harmful radiation or contrast agents. Compared to previous T2*-based techniques the present approach is less prone to susceptibility and physiological artifacts especially at high fields.
Introduction
Within the last decade, the scientific interest in brown adipose tissue (BAT) was greatly invigorated by the discovery of functional BAT in adult humans. The oxidation of fatty acids and glucose in BAT to generate heat, known as nonshivering thermogenesis, can account for nearly 50% of total energy metabolism in smaller mammals and an even larger fraction under cold acclimation[1]. Consistent with these findings, reduced BAT activity has been associated with predisposition to obesity and abnormal glucose homeostasis[2,3].
The current gold standard for functional BAT imaging is CT-guided 18FDG-PET[4]. However, recent studies have shown that it is also possible to assess the metabolic activity of BAT independent of substrate selection by MRI taking advantage of alterations in T2*[5,6]. Although this parameter is sensitive to BAT activation, T2*-based techniques are challenging because of the presence of susceptibility and physiological artifacts. Here, we describe a robust T2 mapping method for functional assessment of BAT in mice.
Methods
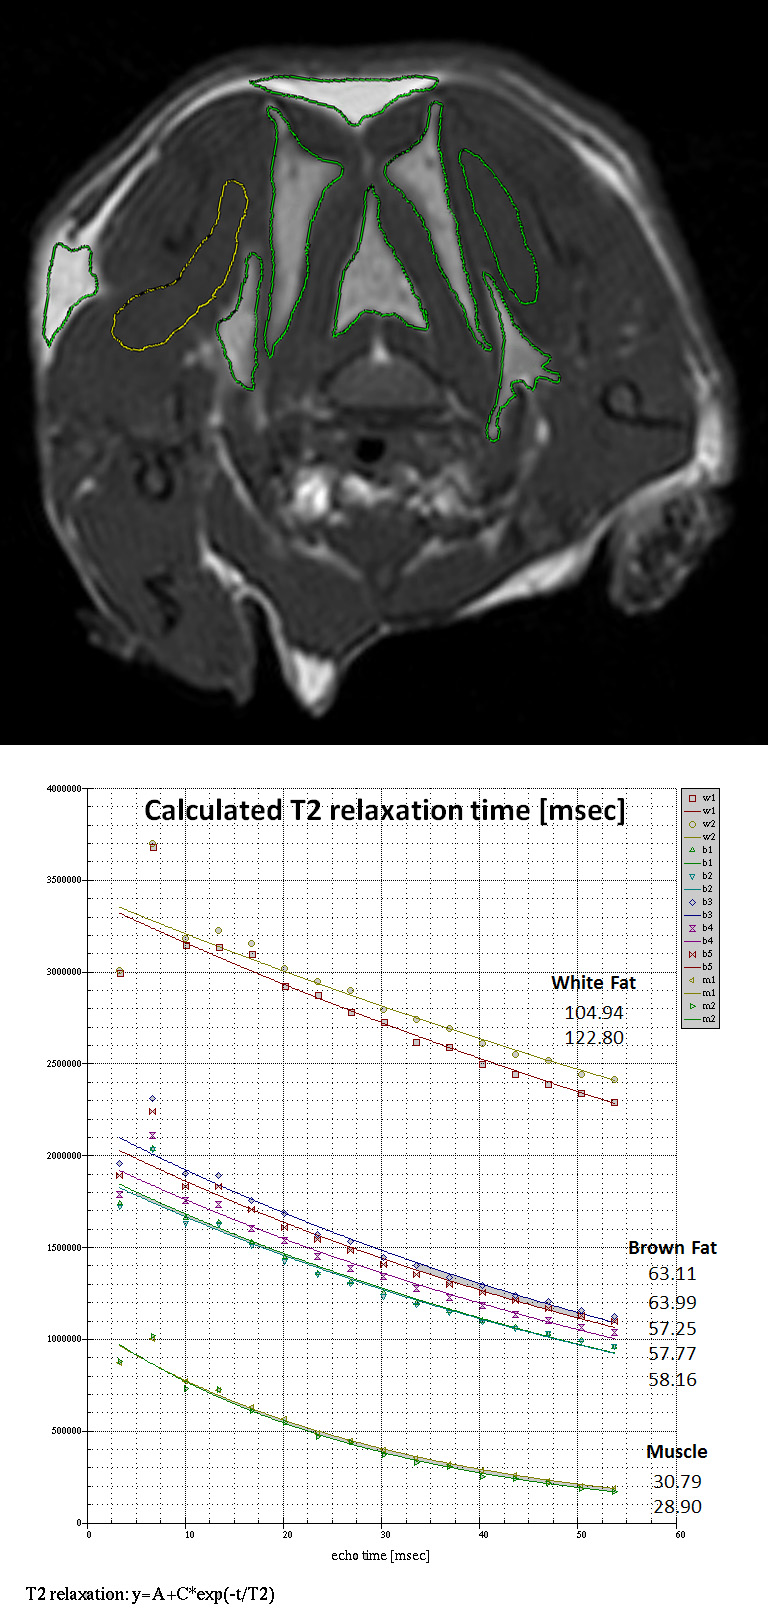
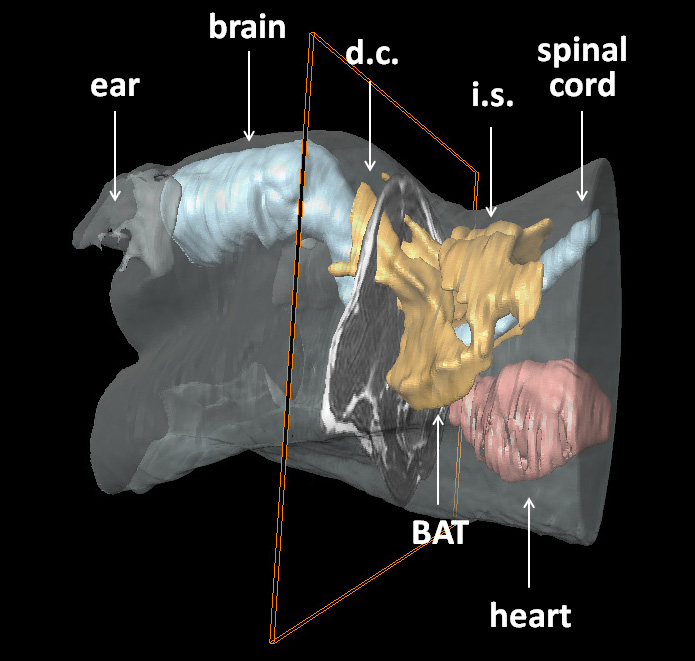
BAT stimulation was carried out either by a β3-specific adrenergic agonist (ip bolus injection of 50 µl of a CL-316,243 (CL-316) solution (0.5 µg/µl saline) or by cold exposure (2.5 h to 5 °C). All mice served as their own control, in that they were subjected to MRI measurements at baseline and after exposure to CL-316 or cold. MRI data were recorded at 9.4T and images were acquired using actively shielded gradient sets (1.5 T/m) and a 25-mm birdcage resonator. T2 mapping was carried out using a respiratory gated multi-slice multi-echo (MSME) sequence covering the entire BAT (8 slices, 16 echos, separated by a ΔTE of 3.805 ms). To create the T2 maps, an exponential decay curve was fitted to the intensity decline of each pixel within the 16 echo images. Demarcations for white and brown adipose tissue as well as muscle were manually drawn and tissue-specific T2 times were calculated from the respective ROIs. For each of the 8 slices, 2 separated ROIs were evaluated for white adipose tissue (WAT) and muscle, respectively, while for BAT as many ROIs were used as required for entire coverage of all tissue parts (Figure 1). For calculation of tissue-specific T2 values, data were averaged over all ROIs from all slices. For the 3D visualization of BAT in the upper part of the body, MR data were acquired with a 3D TSE sequence from the cerebrum down to the heart.Results and Discussion
Due to the heterogeneous tissue composition, high iron content, and rich vasculature, T2 values in BAT are already under baseline conditions substantially lower than in WAT (Figure 1). This effect is expected to be even more pronounced under BAT activation which results in higher metabolic turnover, heat production, and perfusion.
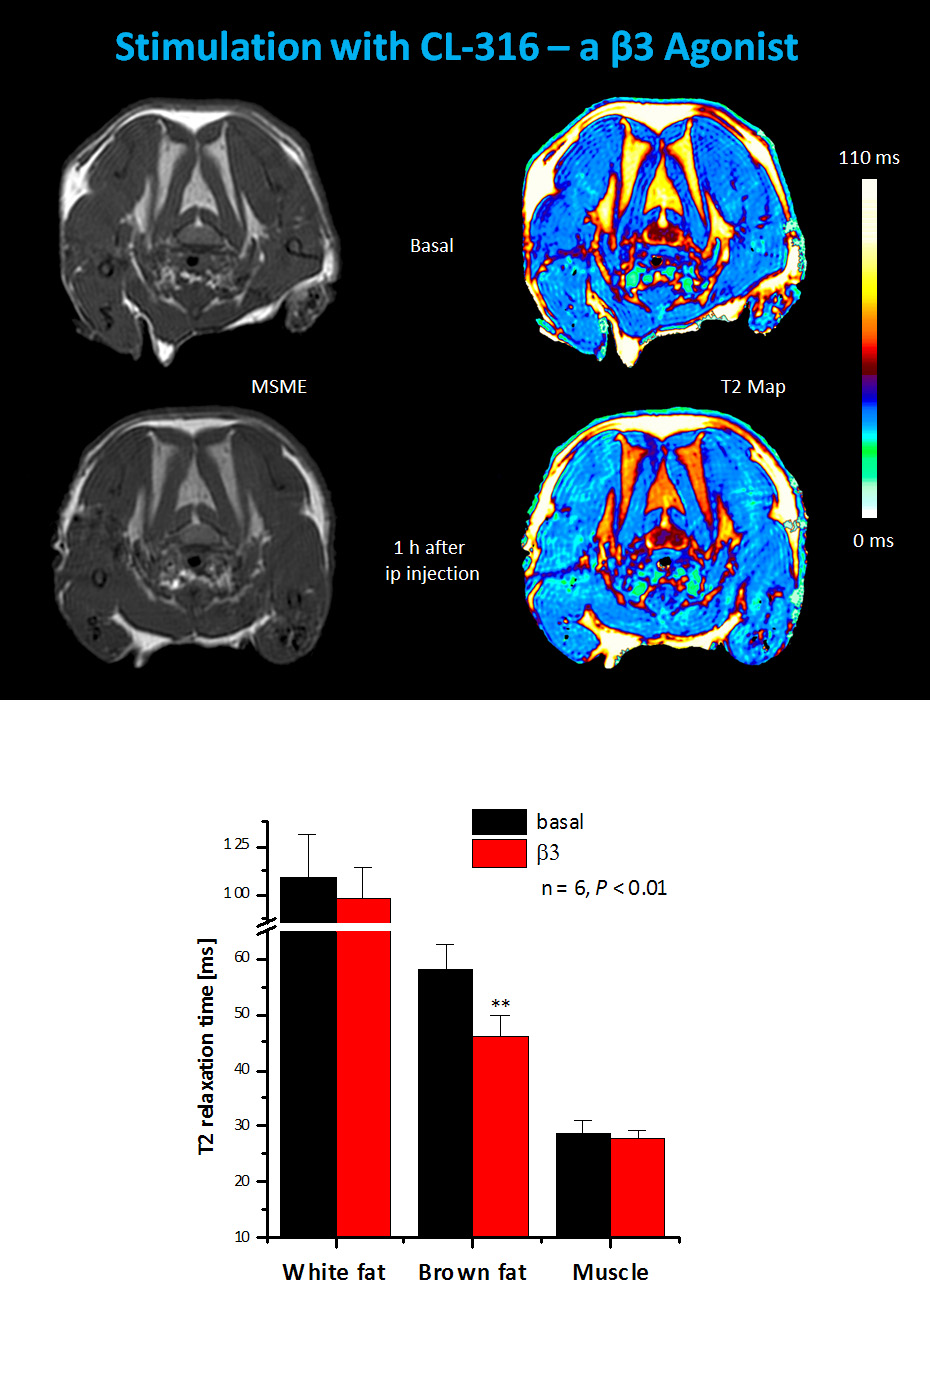
To prove this assumption, mice were subjected to MRI examinations immediately before and 1 h after pharmacological β3 adrenergic stimulation (CL-316). As can be recognized from representative T2 maps shown in Figure 2, administration of the CL-316 resulted in a substantial decrease of T2 in dorsocervical BAT which is reflected in the color-coded maps by a change from yellow to red. Quantification of T2 over the entire BAT area (cf. Figure 3) revealed a significant drop in T2 from 58.2±4.2 to 46.0±3.7 ms upon 1 h of β3 adrenergic stimulation (n=6, P<0.001). Importantly, this decrease in T2 was restricted to BAT segments – neither muscle nor WAT T2 were significantly altered by CL-316 (Figure 2).
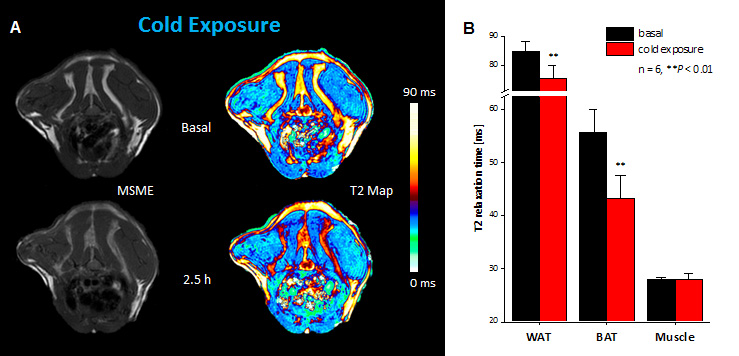
The T2 sensitivity for BAT activation was further corroborated when mice were challenged by cold exposure (Figure 4): After 2.5 h at 5 °C, BAT T2 dropped from 55.8±4.2 to 43.3±4.3 ms (n=6, P<0.001) – a similar magnitude as observed for β3 adrenergic stimulation. Interestingly, here also WAT T2 was significantly decreased. Planimetry of the BAT segments including all interscapular and dorsocervical depots (cf. Figure 3) exhibited that cold exposure for 2.5 h resulted in a substantial degradation of the total BAT content from 137.1±20.7 to 97.3±19.8 µl (n=6, P<0.01), while 1 h of CL-316 stimulation led only a minor decrease from 130.2±18.7 to 124.2±22.8 µl (n=6, n.s.).
Compared to T2*-based techniques the present approach is less prone to susceptibility artifacts especially at high fields. Furthermore, alterations in T2* are balanced by two opposing effects under BAT activation: While deoxyhemoglobin produced by oxidative metabolism of active tissue reduces the BOLD (T2*) signal, the increase in flow seen during local tissue stimulation increases the local BOLD signal and T2*.
Conclusions
The results of this study confirm the specificity and sensitivity of our T2 mapping approach for BAT activation under both pharmacological und physiological stimulation.Acknowledgements
This work was supported by the Deutsche Forschungsgemeinschaft (DFG), subprojects A8, B2 + B5 of the Sonderforschungsbereich 1116.References
[1] Cannon B, Nedergaard J. Brown adipose tissue: function and physiological significance. Physiol Rev 2004;84:277–359.
[2] Trayhurn P, Thurlby PL, James WPT. Thermogenic defect in preobese ob/ob mice. Nature 1977;266:60–62.
[3] Hamann A, Benecke H, Le Marchand-Brustel Y, Susulic VS, Lowell BB, Flier JS. Characterization of insulin resistance and NIDDM in transgenic mice with reduced brown fat. Diabetes 1995;44: 1266–1273.
[4] Virtanen KA, Nuutila P. Functional imaging of brown adipose tissue. Heart Metab 2010;48:15–17.
[5] Chen YI, Cypess AM, Sass CA, Brownell A-L, Jokivarsi KT, Kahn CR, Kwong KK. Anatomical and functional assessment of brown adipose tissue by magnetic resonance imaging. Obesity 2012; 20: 1519–1526.
[6] Khanna A, Branca RT. Detecting brown adipose tissue activity with BOLD MRI in mice. Magn. Reson. Med. 2012; 68: 1285–1290.
Figures