1067
Evaluation of the Vascular Perfusion in Activated Brown Adipose Tissue by Dynamic Contrast Enhanced MR Imaging1Laboratory of Metabolic Imaging, Singapore Bioimaging Consortium, A*STAR, Singapore
Synopsis
Vasculature plays an important role in white and brown adipose tissue (WAT and BAT) metabolism. In expanding WAT, abnormal vasculature may lead to energy (fat) deposition whereas in activated BAT it may potentially facilitate the energy consumption by oxidizing the fat. Understanding the vascular network and blood perfusion properties of the activated BAT is important for triglyceride clearance, increased blood flow and oxygen. In this feasibility study we have investigated the vascular properties and blood perfusion rate constant of the activated BAT by quantitative dynamic contrast enhanced MR imaging in a rodent model.
Purpose
Evaluation of vascular perfusion properties in activated interscapular brown adipose tissueIntroduction
Brown adipose tissue (BAT) is highly vascularized endocrine organ with positive metabolic implications1. Microvasculature of the adipose tissue is beneficial in regulating adipose tissue inflammation and overall metabolic function2-3. Vascular endothelial growth factor (VEGF) is the key element which governs vasculature/angiogenesis in BAT and white adipose tissue (WAT). BAT can be optimally activated by interventions including cold exposure and β3-adrenergic receptor mediated sympathetic nerve stimulation (SNS). Understanding the vascular network and blood perfusion properties of activated BAT is important for handling triglyceride clearance, increased blood flow and oxygen. In this feasibility study, we have investigated the vascular properties and blood perfusion rate constants of activated BAT by quantitative dynamic contrast enhanced MR imaging (DCE-MRI) in rodent model.Methods
Experimental procedures carried out were in compliance and approved by local institutional committee. Male Wister rats (n=10) of twelve weeks old were randomized into cold exposed (Gp1) and thermoneutral (Gp2) groups. The Gp1 (n=5) rats were exposed to 4 0C for ~ 6 hours in cold chamber (ICP400 Memmert). The Gp2 (n=5) rats were maintained at thermoneutral condition. Prior to imaging, animals were catheterized for injecting the contrast agent gadolinium-diethylenetriamine pentaacetic acid (Gd-DTPA) at 0.2 mmol/kg bodyweight of the animal. MRI measurements were carried out on 7T Bruker ClinScan scanner using 72mm volume transmit and 20 mm surface receive only coils. T2 imaging was performed by using spin echo sequence with 12 echo times, parameters used were: FOV 42x42 mm, slice thickness(ST) 1mm, TR 4819 ms, Av 2, resolution 0.328x0.328 mm. DCE-MRI was performed in iBAT region by using 3D FLASH sequence with following parameters: TR/TE 4.4/0.88 ms, flip angle 60, FOV 42x42 mm, slices 1 slab having 8 slices, ST 1mm, resolution 0.328x0.328 mm, NA 1, images were acquired at 300 time frames with temporal resolution 3.4sec for each time frame. Multi flip angle (FA20 to 280) data was acquired using 3D FLASH sequence to evaluate the pre-contrast tissue T1 map. Mutual information based affine registration was utilized to register the data to average pre-contrast stack. The arterial input function (AIF) was extracted from concentration map by drawing ROI in a artery. Reference region (RR) model was used to process the DCE data by using DCE@urLAB software4. T1 values of blood ~2400ms and fat ~1000ms was utilized to compute the concentration followed by fitting RR model5-6.Results and Discussion
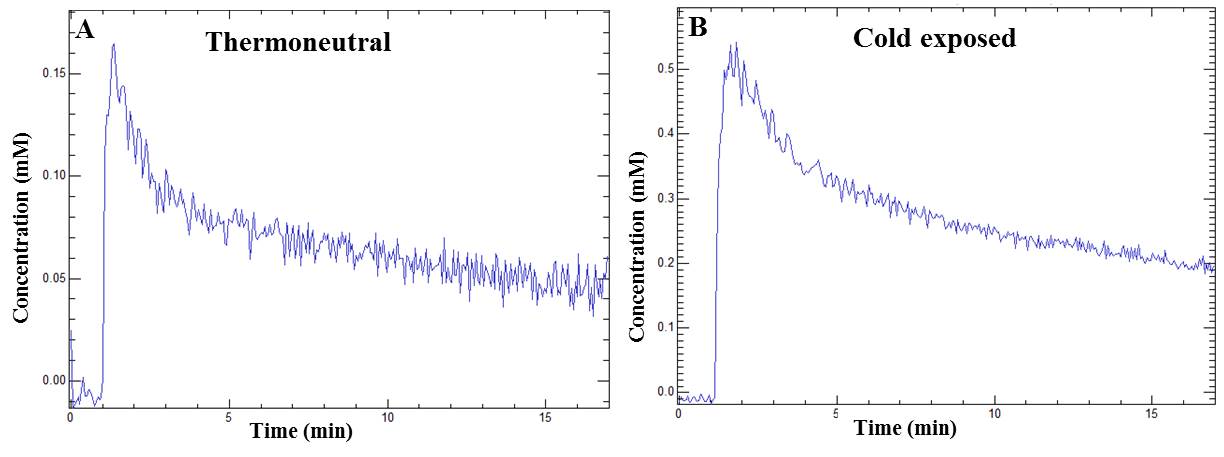
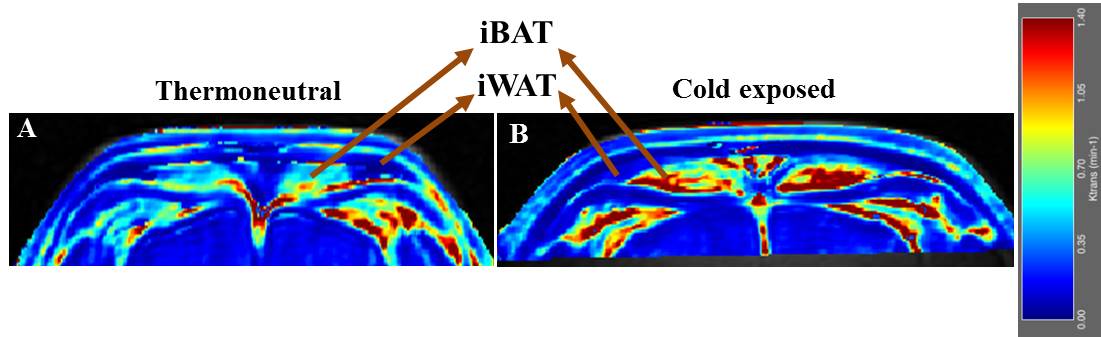
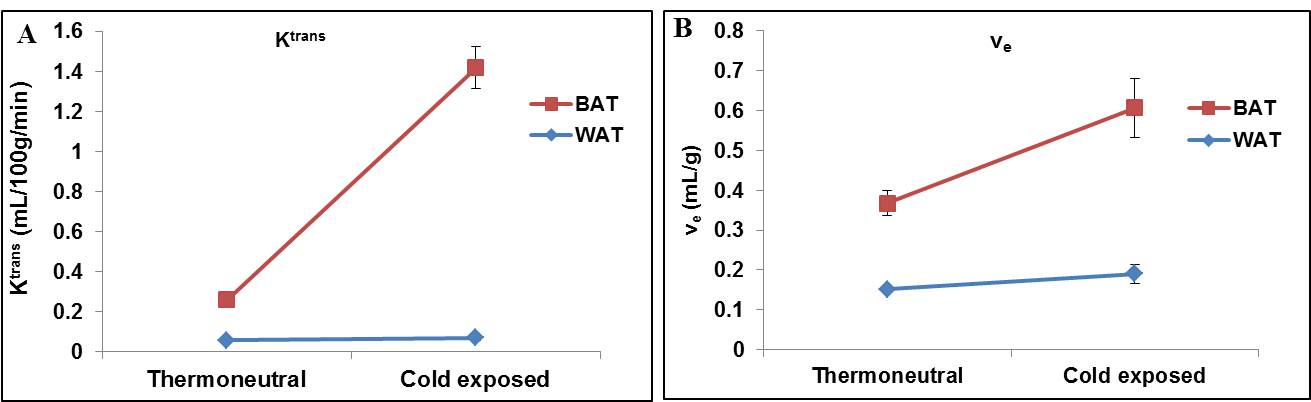
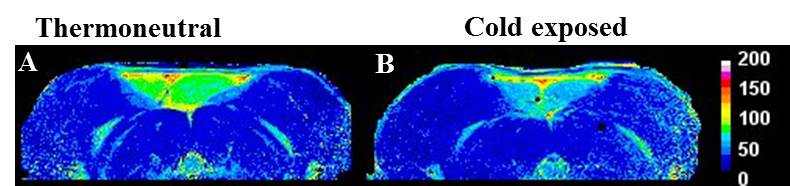
DCE-MRI is a non-invasive approach to study vasculature. We investigated blood perfusion parameters including kinetic transfer constant (Ktrans), extravascular-extracellular volume per unit of volume of tissue (ve) and concentration of contrast agent in activated interscapular BAT (iBAT). Figures 1A, B shows uptake kinetics of Gd-DTPA contrast agent in iBAT of thermoneutral and cold exposed animals. Uptake of contrast agent in iBAT of cold exposed animals was ~3 fold higher compared to thermoneutral group, whereas it was insignificant in interscapular WAT (iWAT). Figures 2A, B shows Ktrans maps from iBAT region of thermoneutral and cold exposed animal. Ktrans is measure of volume transfer constant from blood plasma into the extravascular extracellular space (EES). The Ktrans computed (Figure 3A) from iBAT of thermoneutral animal increased from 0.20±0.01 mL/100g/min to 1.34 ± 0.1 mL/100g/min in cold exposed animals. Significant (P<0.001) increase of Ktrans in cold exposed animal implies increased blood flow due to BAT activation. BAT being densely vascularized, under activated condition facilitates the blood perfusion to supply nutrients (substrates) and oxygen for thermogenesis7. The ve (Figure 3B) also increased significantly (P<0.05) in cold exposed BAT indicating the increased volume of iBAT after cold induced BAT activation as reported in our earlier studies8. Figures 4 A, B shows the T2 map from iBAT of thermoneutral and cold exposed animals. The T2 of the activated iBAT was 53.2±6.9 ms which was significantly lower compared to 74.3±6 ms in thermoneutral state due to the combined effect of increased blood flow and oxygen after cold stimulus. Cold induced iBAT activation was validated by mRNA analysis UCP1 gene. UCP1 expression in cold exposed animals was 8 times higher compared to thermoneutral animals.Conclusion
In this study, we have utilized DCE-MRI to investigate the microvasculature properties of BAT during activation. Quantitative changes in blood perfusion are demonstrated in cold induced activated iBAT. Ktrans and Ve significantly increased in cold exposed animals due to enhanced blood flow caused by SNS mediated BAT activation. Uptake of contrast agent in activated iBAT was higher than thermoneutral iBAT. This approach can be translated to clinical setting to assess the quality of the BAT in obesity and metabolic dysfunction.Acknowledgements
No acknowledgement found.References
(1). Xue, Y. et al, Adipose angiogenesis: quantitative methods to study microvessel growth, regression and remodeling in vivo. Nat. Protoc. 2010;5:912–920.
(2). Sun K, et al, Dichotomous effects of VEGF-A on adipose tissue dysfunction. Proc Natl Acad Sci USA. 2012;109:5874-5879.
(3). Sung H.K, et al, Adipose vascular endothelial growth factor regulates metabolic homeostasis through angiogenesis. Cell Metab. 2013;17:61-72.
(4). Ortuno J.E. et al, DCE@urLAB: a dynamic contrast-enhanced MRI pharmacokinetic analysis tool for preclinical data. BMC Bioinformatics. 2013;14:316.
(5). Rane S. et al, Measurement of T1 of human arterial and venous blood at 7T. Magn. Reons. Imaging. 2013;31:477-479.
(6). Barbier EL1, et al. A model of blood-brain barrier permeability to water: accounting for blood inflow and longitudinal relaxation effects. Magn Reson Med. 2002;47:1100-9.
(7) Cannon B. et al, Brown adipose tissue: function and physiological significance. Physiol Rev. 2004;84:277-359
(8). Bhanu Prakash KN, et al, Segmentation and characterization of interscapular brown adipose tissue in rats by multi-parametric magnetic resonance imaging. MAGMA. 2016;29:277-286.
Figures