1063
Diurnal variability of cerebral metabolites with 2D L-COSY1University of Newcastle, Newcastle, Australia, 2Neurology, John Hunter Hospital, Australia, 3Hunter Medical Research Institute, Australia, 4University of Newcastle, Australia
Synopsis
Diurnal factors such as brain temperature, hydration and osmotic regulation have the potential to change metabolic profiles in two dimensional localised correlation spectroscopy (2D L-COSY). Ten Healthy subjects underwent repeated 2D L-COSY on a 3T system over a 10hour period at three time points (0700, 1200 and 1700) to evaluate diurnal effects on brain neurometabolites. Results show significant diurnal effects between morning and evening scans. The present findings highlight the importance of maintaining a specific time when spectral data is acquired, especially in longitudinal studies where the dynamic nature of subject can present a confounding factor.
Purpose
Two dimensional localised correlation spectroscopy (2D L-COSY) is a research tool that has been applied to evaluate in vivo metabolic activity in many neurological disorders1,2 as well as cancer3 .The advantages of 2D L-COSY over 1D MRS include improved spectral dispersion and unambiguous detection of several metabolites of varying concentrations simultaneously4. Reproducibility studies have shown 2D L-COSY is reliable and found to have little variation (<10%) in the detection of both diagonal and cross peaks1,5. However, circadian mediators such as brain temperature, hydration and osmotic regulation have been claimed to change metabolic profiles6. In this study, we hypothesized that there is variation in metabolic levels from physiological diurnal fluctuations in brain metabolites at different times of the day with 2D L-COSY. To our knowledge, this is the first attempt to study the diurnal effects of many metabolites simultaneously using 2D L-COSY. The purpose of this study was to evaluate the diurnal variability in neurometabolites using 2D L-COSY in healthy subjects.Methods
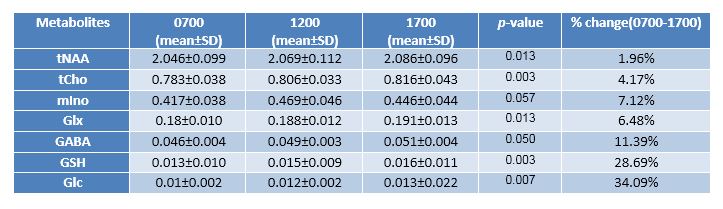
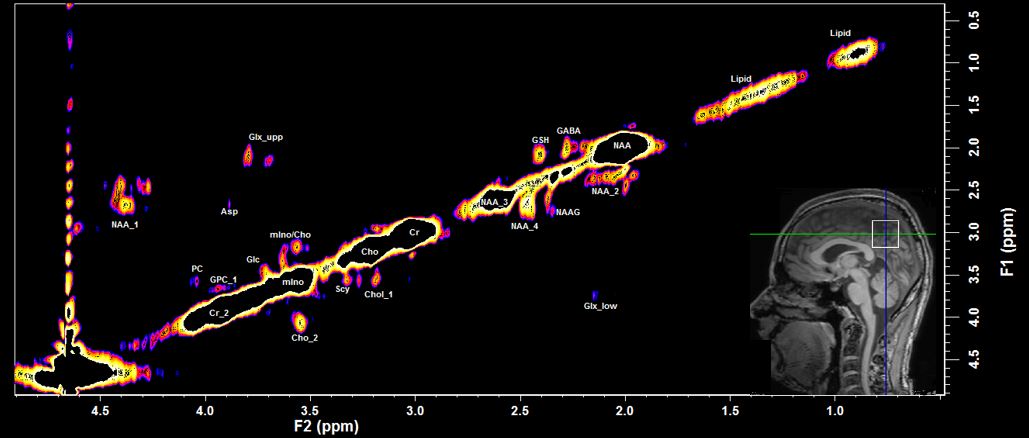
This study was approved by the local ethics review board and all subjects were consented in writing. Both in vitro and in vivo measurements were performed at each session on a 3T MR system (Magnetom Prisma, Siemens Healthcare) equipped with 64 Channel brain coil. Braino (GE brain phantom) was used for in vitro measurements. Ten healthy volunteers (mean age 36.1±7.7 years) were recruited for in vivo studies and scanned repeatedly over a ten-hour period at three time points (0700, 1200 and 1700) on the same day. 2D L-COSY MRS was acquired from the posterior cingulate gyrus (PCG) with 3x3x3 cm3 voxel employing first TEinitial of 30ms, TR 1.5sec, 8 averages per increment, bandwidth 2000Hz, t1 increment of 0.8ms, vector size of 2048 points, RF offset frequency was set on 2.4ppm, and number of increments was 96. All scans were carried out by a single radiographer (KS) and inter-voxel positional variations were minimised with the use of auto align localiser and following anatomical landmarks. Raw spectral data was taken offline and data from different coil elements were combined and concatenated to produce a 2D time-domain array (96x2048) which was then processed and analysed with Felix 2007 software (Accelrys, San Diego, CA). The peaks studied were total NAA (tNAA) which is the sum of NAA, NAAG, NAA_1, NAA_2, NAA_3, NAA_4, total choline (tCho) which includes Cho, phosphorylcholine (PC), glycerophosphorylcholine (GPC_1), Cho_1, Cho_2, Cho_3, myo-inositol (mIno), glutamine+glutamate (Glx) with contribution from Glx_upp and Glx_low, GABA, glutathione (GSH) and glucose (Glc). All peaks were normalised to creatine at F2:3.02, F1:3.02 ppm as an internal reference. The effects of time of day on metabolite levels were evaluated using one-way repeated measured analysis of variance (ANOVA) (SPSS, version 24) with Bonferroni adjustment.Results & Discussion
The mean values of peaks ratios for diagonal and cross peaks are shown in Table 1. Figure 2 shows the typical 2D L-COSY spectrum and the location of voxel from a heathy subject. In vitro experiments showed no statistically significant differences in all metabolite levels between each scan undertaken (p>0.12). In vivo results showed significant diurnal variations (p≤0.05, F>3.88). Bonferroni post-hoc testing showed there was statistically significant increase in metabolite levels between 0700 and 1700 for all the metabolites listed above. In line with other studies, the possible increase in metabolic changes is probably due to osmotic regulatory processes and short term physiological changes6,7. This is the first attempt to study diurnal variations in neurometabolites using 2D L-COSY in healthy subjects. This study has significant implications for future longitudinal studies using 2D L-COSY with our findings suggesting that time of the day needs to be considered when evaluating the level of neurometabolites detected by this technique.Conclusion
Diurnal physiological effects can change neurometabolite levels with detected by 2D L-COSY. Thus, time of the day should be considered when planning longitudinal studies as diurnal effects can produce confounding results.Acknowledgements
No acknowledgement found.References
1. Lin AP, Ramadan S, Stern RA, et al. Changes in the neurochemistry of athletes with repetitive brain trauma: preliminary results using localized correlated spectroscopy. Alzheimers Res Ther 2015;7.
2. Ramadan S, Andronesi OC, Stanwell P, et al. Use of in vivo two-dimensional MR spectroscopy to compare the biochemistry of the human brain to that of glioblastoma. Radiology 2011;259(2):540-549.
3. Ramadan S, Arm J, Silcock J, et al. Lipid and Metabolite Deregulation in the Breast Tissue of Women Carrying BRCA1 and BRCA2 Genetic Mutations. Radiology 2015;275(3):675-682.
4. Thomas MA, Yue K, Binesh N, et al. Localized two-dimensional shift correlated MR spectroscopy of human brain. Magn Reson Med 2001;46(1):58-67.
5. Binesh N, Yue K, Fairbanks L, et al. Reproducibility of localized 2D correlated MR spectroscopy. Magn Reson Med 2002;48(6):942-948.
6. Soreni N, Noseworthy MD, Cormier T, et al. Intraindividual variability of striatal H-1-MRS brain metabolite measurements at 3 T. Magn Reson Imaging 2006;24(2):187-194.
7. Chard DT, McLean MA, Parker GJ, et al. Reproducibility of in vivo metabolite quantification with proton magnetic resonance spectroscopic imaging. J Magn Reson Imaging 2002;15(2):219-225.
Figures