1062
Paediatric brain lesion classification using 3T MRS: Comparison of different pattern recognition techniques, A multi-centre study.1University of Birmingham, Birmingham, United Kingdom, 2Birmingham children hospital, Birmingham, United Kingdom, 3Department of Radiology, Alder Hey Children's NHS Foundation Trust, 4The Children‘s Brain Tumour Research Centre, University of Nottingham, Nottingham, United Kingdom, 5Radiological Sciences, Department of Clinical Neuroscience, University of Nottingham, Nottingham, United Kingdom, 6Neuroradiology, Nottingham University Hospital, Queen’s Medical Centre, Nottingham, United Kingdom, 7Institute of Digital Healthcare, WMG, University of Warwick, Coventry, United Kingdom, 8Paediatric Oncology Department, Great North Children’s Hospital, Newcastle upon Tyne, United Kingdom, 9Department of Imaging and Medical Physics, University Hospitals Birmingham NHS Foundation Trust, Birmingham, United Kingdom, 10Neuroradiology Department, Newcastle upon Tyne Hospitals, Newcastle upon Tyne, United Kingdom, 11Medical Physics, Nottingham University Hospital, Queen’s Medical Centre, Nottingham, United Kingdom, 12Department of Paediatric Oncology, Alder Hey Children's NHS Foundation Trust, Liverpool, United Kingdom
Synopsis
The purpose of the study was to investigate the discriminative potential of metabolites obtained from 3T scanners in classifying paediatric posterior fossa brain tumours by comparing performance of three different pattern recognition techniques on a multicentre data set. A total of 52 paediatric patients with cerebellar tumours (16 Medulloblastomas, 31 Pilocytic Astrocytomas and 5 Ependymomas) were scanned using PRESS, TE 30-46 ms, across 4 different hospitals. Achieved balanced classification accuracy were 88% with random-forest, 84 % for the support-vector-machine and 81% for naïve-bays classifier. The achieved accuracy was better than the balanced accuracy previously reported for multi-centre datasets at 1.5T.
Purpose:
3T magnetic resonance scanners have boosted clinical application of 1H-MR spectroscopy (MRS) by offering an improved signal-to-noise ratio (SNR) and increased spectral resolution thereby disclosing more metabolites and extending the range of metabolic information. Spectroscopic data from clinical 1.5T MR scanners has been shown to discriminate paediatric brain tumours by applying machine learning techniques to further aid diagnosis1.
To date no study has been reported on application of pattern recognition techniques for classification of paediatric brain tumours using 3T MRS. The aim of this study was to evaluate the discriminative potential of metabolites obtained from 3T scanners in classifying paediatric posterior fossa brain tumours by comparing performance of three different pattern recognition techniques.
Method:
MRS Data was collected retrospectively from children with a suspected brain tumor prior to treatment from 4 hospitals. Multicenter ethical approval and parental consent was obtained. The enrolled cohort consisted of 52 patients (age 8.2±5.32 y, 21 female and 31 male) with 3 different tumour types from the posterior fossa, including 16 medullobastoma, 31 pilocytic astrocytoma and 5 ependymomas. Histopathological, clinical and radiological features were used to form a diagnosis. Single-voxel-MRS was acquired on 3T MRI scanners from different manufacturers (Philips Achieva, Siemens verio) using a standard protocol (PRESS, TE 30-46 ms, TR 2000 ms).
Raw spectroscopy data were analysed with TARQUIN2, fitting to a linear combination of 18 metabolite basis functions generated at the correct field strength and echo time with an additional 9 lipid and macromolecular components. Predefined quality control criteria were applied. Frequency alignment, zero order phase correction, baseline-correction and water removal using HSVD methods were been applied by TARQUIN.
Analysis of variance was used to determine the significant differences in metabolite concentration. Principal component analysis, followed by Support-vector-machine (SVM), Naive-Bayes (NB) and random-forest (RF) was used to construct a classifier for discrimination of the 3 main tumor types. Synthetic minority oversampling technique 3 (SMOTE) was used to overpopulate the original ependymoma group by 100 % and correct for the skewness in the original data. Ten-fold cross validation was used to evaluate the learning algorithm performance. Developed classifiers using the SMOTE-overpopulated sets were tested using the original data and the validity of the classifier was checked by comparison with the known histological assignment. Balanced classification accuracy (BAR) was calculated as an overall measure of success. Different pattern recognition approaches were compared in view of their performance.
Results:
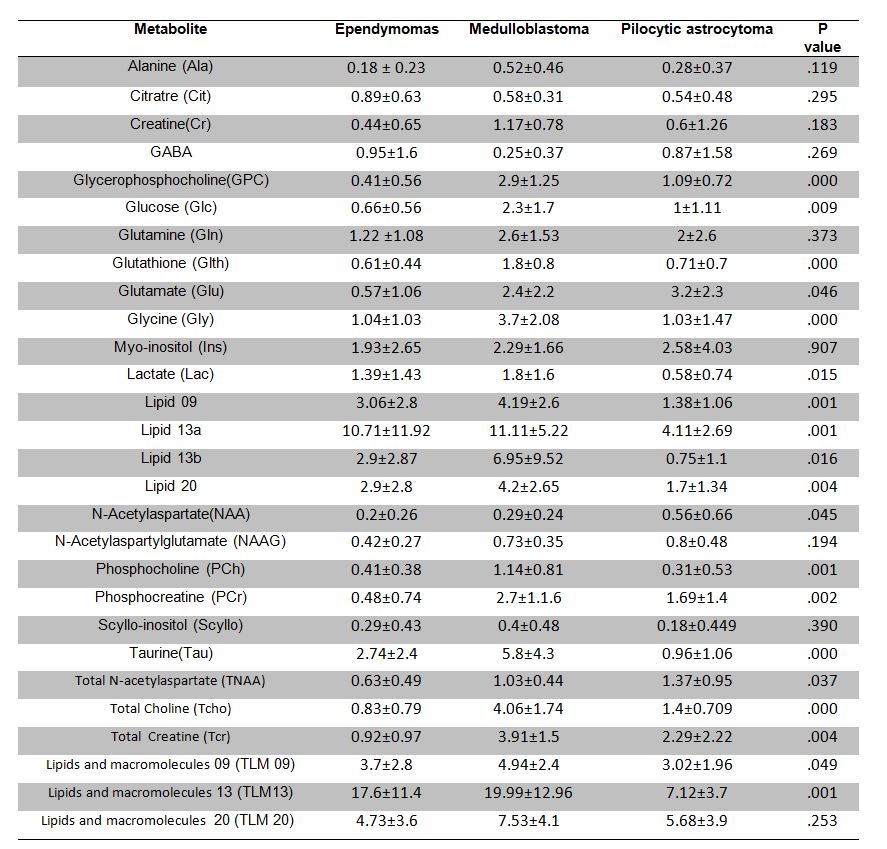
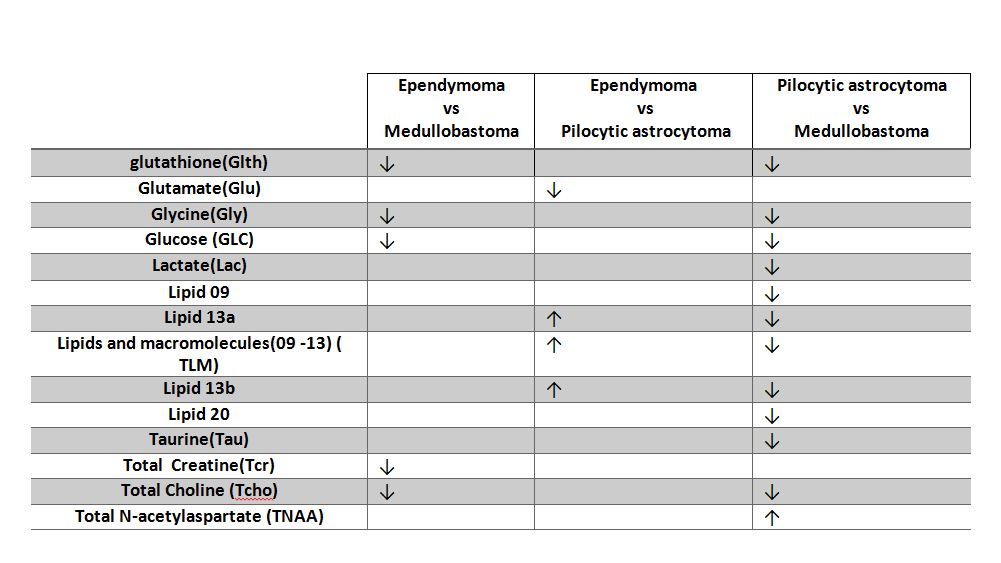
Metabolite values and significant differences (ANOVA P<0.05) between specific pairs of tumour types are represented in tables 1 and 2. PCA was performed and PCs accounting for 95 % of variance extracted, giving 9 principal-components from the set of metabolite concentrations.
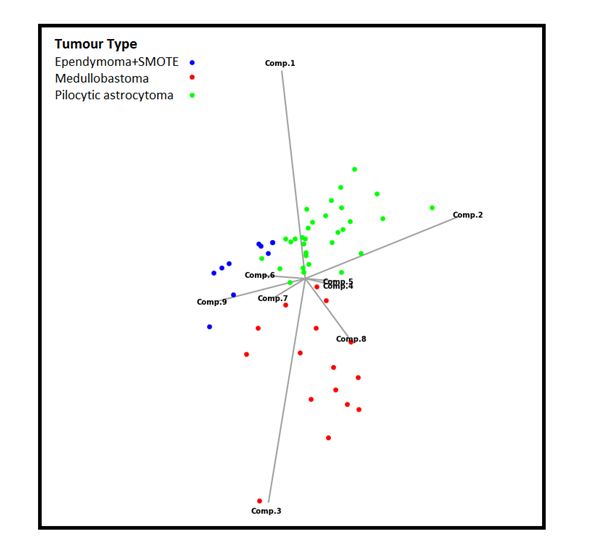
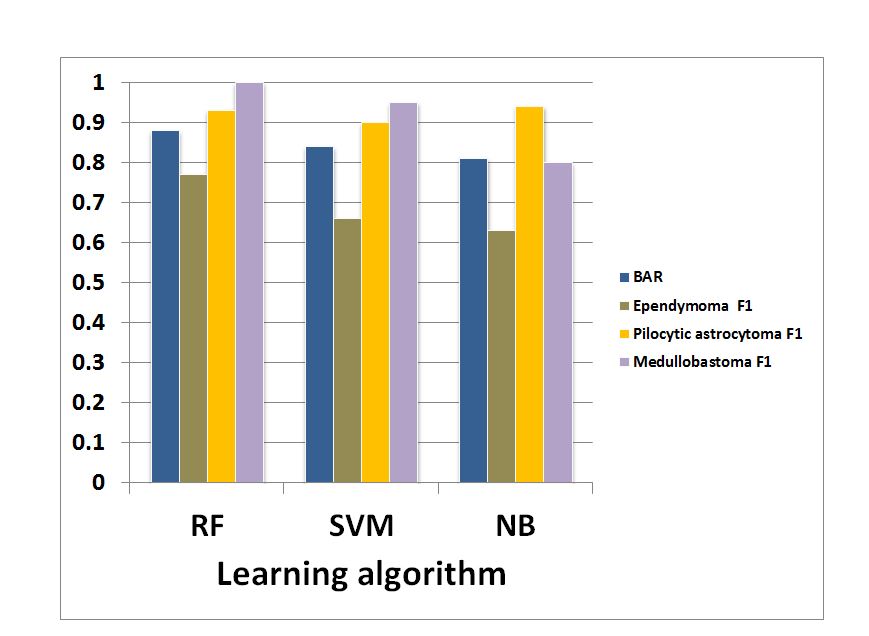
A good separation was observed between the three tumour groups (figure-1). BAR of the learning algorithms and their F-measure 5 in discriminating each individual tumour type are illustrated in figure 2.
Overall, RF (BAR=0.88) performed favorably in comparison to SVM (BAR=0.84) and NB (BAR=0.81) in discriminating between the three tumour types. RF was also the best techniques for classifying ependymomas (F measure=0.7). Comparing SVM and NB, SVM performed better for classifying medullobastoma (SVM F-measure=0.95 vs NB F-measure=0.88). SVM and NB had a similar performance in discriminating pilocytic astrocytoma and ependymomas.
Discussion and Conclusion:
Here, the value of the information extracted from mining specific 3T_MRS patterns and classification of paediatric cerebellar tumours was studied.
The metabolites identified to be significantly different between the three tumour types at 3T in this study generally agrees with previously reported metabolites for the same tumours at 1.5T3,4. Exceptions are minor metabolites such as citrate and scyllo-inositol which were reported to be significantly different at 1.5T. This finding can be either due to difference in sample size or increased resolution at 3T allowing more accurate quantitation.
Successful classification was achieved for ependymoma versus pilocytic astrocytoma versus medulloblastoma tumours with all used learning algorithms (Best BAR= 0.88). The achieved accuracy was better than the reported BAR obtained from short TE 1.5T data (BAR= 0.67) where similar tumour types and similar data skewness were studied4.
Discrimination power of the pattern recognition techniques in classifying the ependymoma group alone was on average 70%. This is mainly due to the imbalanced nature of the data. Although SMOTE was used to overpopulate the ependymoma group by 100% to correct for this skewness, the data distribution still remained imbalanced3 due to the small number of tumours in this group.
This study showed that 3T MRS detects key differences in the metabolite profiles for the main types of childhood cerebellar tumours. Classification performance compares favorably with previously reported multi-centre data sets at 1.5T.
Acknowledgements
This study is funded through an NIHR Research Professorship, 13-0053.We acknowledge fundingfrom the CRUK and EPSRC Cancer Imaging Programme at the Children’s Cancer and LeukaemiaGroup (CCLG) in association with the MRC and Department of Health (England) (C7809/A10342).We would like to acknowledge the MR research radiographers at Birmingham Children’s Hospitalfor scanning the patients in this study.References
1. Davies NP, Wilson M, Harris LM, Natarajan K, Lateef S, Macpherson L, Sgouros S, Grundy RG, Arvanitis TN, Peet AC, Identification and characterisation of childhood cerebellar tumours by in vivo proton MRS. NMR Biomed. 2008 Oct;21(8):908-18. 2. Wilson M, Reynolds G, Kauppinen RA, Arvanitis TN, Peet AC. A constrained least-squares approach to the automated quantitation of in vivo (1)H magnetic resonance spectroscopy data. Magnetic resonance in medicine 2011;65(1):1-12. 3. Zarinabad N, Wilson M, Gill SK, Manias KA, Davies NP, Peet AC ,Multiclass imbalance learning: Improving classification of pediatric brain tumors from magnetic resonance spectroscopy. Magn Reson Med. 2016 Jul 12. 4. Vicente J, Fuster-Garcia E, Tortajada S, García-Gómez JM, Davies N, Natarajan K, Wilson M, Grundy RG, Wesseling P, Monleón D, Celda B, Robles M, Peet AC, Accurate classification of childhood brain tumours by in vivo ¹H MRS - a multi-centre study. Eur J Cancer. 2013 Feb;49(3):658-67. 5. Shuo W, Xin Y. Multiclass Imbalance Problems: Analysis and Potential Solutions. IEEE transactions on systems, man, and cybernetics, 2012;42(4):1119-1130Figures