1061
Metabolite cycled semi-LASER and STEAM at 9.4T. Comparison and in vivo results.1High Field Magnetic Resonance, Max Planck Institute for Biological Cybernetics, Tuebingen, Germany, 2Graduate School of Neural and Behavioural Sciences, Tuebingen, Germany, 3Departments of Radiology and Clinical Research, University Bern, Bern, Switzerland, 4Institute for Biomedical Engineering, UZH and ETH Zurich, Zurich, Switzerland, 5Center for Stroke Research Berlin (CSB), Charité Universitätsmedizin Berlin, Berlin, Germany, 6Institute of Physics, Ernst-Moritz-Arndt University Greifswald, Greifswald, Germany
Synopsis
The purpose of this study was the development of two new localization schemes for ultra high field (UHF) spectroscopic applications while utilizing the advantages of the Metabolite Cycling (MC) technique. In particular, a semi-adiabatic asymmetric pulse optimized for MC at 9.4T was incorporated into STEAM and semi-LASER localization schemes. In this study, these two new sequences along with the appropriate hardware setup were used to acquire in vivo 1H MRS data from the occipital lobe of the human brain and compare the corresponding results. In addition, the effect of frequency and phase correction based on the MC water spectra on data quality was investigated.
Purpose
The purpose of this study was to develop two new localization schemes for ultra high field (UHF) spectroscopic applications while utilizing the advantages of the Metabolite Cycling (MC) technique1. MC enables the simultaneous acquisition of pure metabolite and pure water spectra without the need for a water suppression scheme. In particular, a semi-adiabatic asymmetric metabolite inversion pulse optimized for MC at 9.4T was incorporated with STEAM and semi-LASER localization schemes. In this study, these two new sequences along with the appropriate hardware setup, were used to acquire in vivo 1H MRS data from the occipital lobe of the human brain and compare the corresponding results. In addition, the effect of frequency and phase correction based on the MC water spectra on data quality was investigated.Methods
All measurements were performed on a 9.4T whole-body MRI scanner (Siemens Healthcare, Erlangen, Germany) using a home-built proton coil with 8-transmit and 16-receive channels. Α voxel (2x2x2 cm3) was chosen in a mixed gray matter and white matter area in the occipital lobe, while MC semi-LASER (TE/TR: 24/6000 ms) and MC STEAM (TE/TM/TR: 8/50/6000 ms) measurements (NEX: 96) were performed in ten healthy volunteers . Bo shimming using FASTE(ST)MAP2 and voxel-based power calibration3 were applied. Neither water suppression nor outer volume suppression (OVS) was implemented.
In addition, MC semi-LASER sequence was simulated for in vivo measured B1+ and B0 conditions (Fig. 2) using homebuilt scripts in MATLAB for Bloch equations
Data-processing included the following sequential steps:
1) Zero-filling
2) Frequency and phase alignment (MC-Corr) was implemented in the time domain. For comparison purposes, the data were also analyzed without frequency correction (MC-Uncorr).
3) For MC data, even numbered spectra were first multiplied by a scaling factor ranging from 0.90 to 0.95 as described in Dreher et al1. Water spectra were extracted by averaging odd and even numbered acquisitions, while metabolite data were calculated by subtracting even numbered averages from odd numbered ones.
4) Summation of averages.
5) Truncation of FIDs at 250 ms.
6) Zero-order phase and eddy-current correction4.
7) Coil combination5
Results
Due to high coil efficiency (Fig. 1) and the availability of strong gradients, the duration of the hamming-filtered sinc pulses used for slice selection for both localization techniques ranged from 1 to 1.2 ms, resulting in an excitation bandwidth of about 8 kHz. In addition, the bandwidth of the adiabatic pulses in semi-LASER was also 8 kHz. Thus, CSD was 5% per ppm for each voxel dimension.
MC semi-LASER simulations (Fig. 2) demonstrated the robustness of the MC semi-LASER sequence against B1+ and B0 variations within the measured voxel.
Physiological motion during the scan led to frequency and phase fluctuations of the acquired signal (Fig. 3). However, frequency and phase alignment of MC data prior to further processing enabled constructive averaging of individual acquisitions. MC Uncorr metabolite data showed significant water residual and baseline distortion. In contrast, appropriate preceding alignment of individual MC metabolite signals resulted in spectra with a flat baseline and water peak residual amplitude on the order of the NAA peak (Fig. 3).
MC semi-LASER and MC STEAM results show a statistically significant improvement in terms of the average SNRNAA, scaling factor and water peak linewidth when frequency alignment is performed (Fig. 4). In addition, a twofold increase in SNRNAA for MC semi-LASER in comparison with the MC-STEAM sequence is observed despite the longer TE.
MRS spectra acquired at 9.4T with MC semi-LASER and MC STEAM from the same voxel in the occipital lobe of exhibited high quality (Fig. 5). The increased SNR of MC semi-LASER data in comparison with MC STEAM allows for improved detection of downfield peaks.
Discussion
At 9.4T, frequency and phase alignment of acquisitions strongly affect the resulting water FWHM and SNR of the final spectrum. MC-Corr data for both sequences resulted in an increase of SNRNAA by 45% and a decrease of water FWHM of about 2 Hz. Both, MC semi-LASER and MC STEAM yield high frequency resolution spectra where an extended neurochemical profile is detected. The quality of the MC STEAM spectra is equivalent with published data using STEAM with OVS at 9.4T6. However, in this study, MC STEAM data suffered from lipid contamination due to the absence of OVS. Spectral results show the robustness and superiority of MC semi-LASER in comparison with MC STEAM in terms of SNR and localization efficacy. Both techniques were applied without OVS, however, lipid signals were dephased in the case of MC semi-LASER.Acknowledgements
No acknowledgement found.References
1. Dreher W, Leibfritz D. New method for the simultaneous detection of metabolites and water in localized in vivo 1H nuclear magnetic resonance spectroscopy. Magn Reson Med 2005;54:190-5.
2. Gruetter R, Tkac I. Field mapping without reference scan using asymmetric echo-planar techniques. Magn Reson Med 2000;43:319-23.
3. Versluis MJ, Kan HE, van Buchem MA, Webb AG. Improved signal to noise in proton spectroscopy of the human calf muscle at 7 T using localized B1 calibration. Magnetic Resonance in Medicine 2010;63:207-211.
4. Klose U. In vivo proton spectroscopy in presence of eddy currents. Magn Reson Med 1990;14:26-30.
5. Bydder M, Hamilton G, Yokoo T, Sirlin CB. Optimal phased-array combination for spectroscopy. Magn Reson Imaging 2008;26:847-50.
6. Deelchand DK, Van de Moortele PF, Adriany G, Iltis I, Andersen P, Strupp JP, Vaughan JT, Ugurbil K, Henry PG. In vivo 1H NMR spectroscopy of the human brain at 9.4 T: initial results. J Magn Reson 2010;206:74-80.
Figures
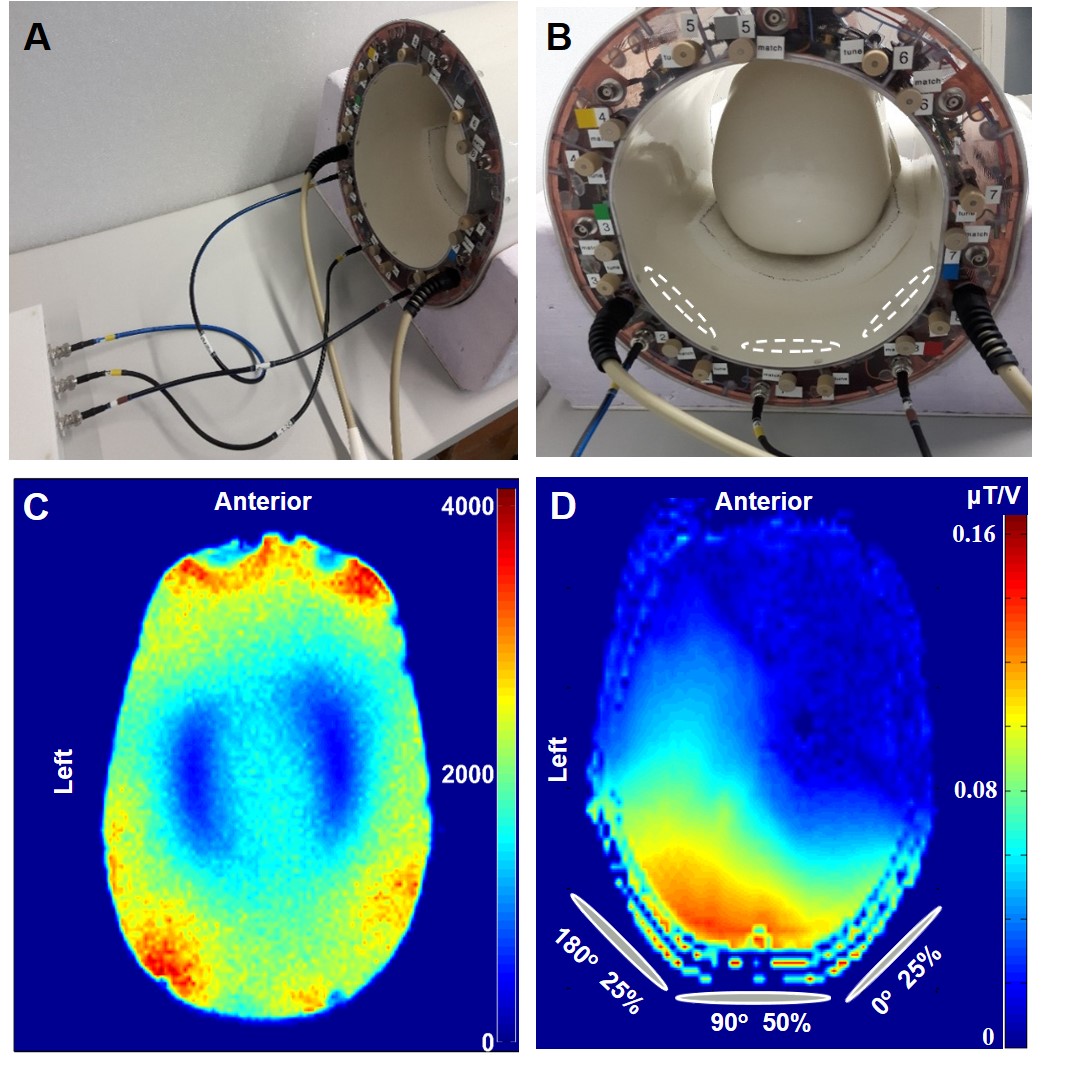
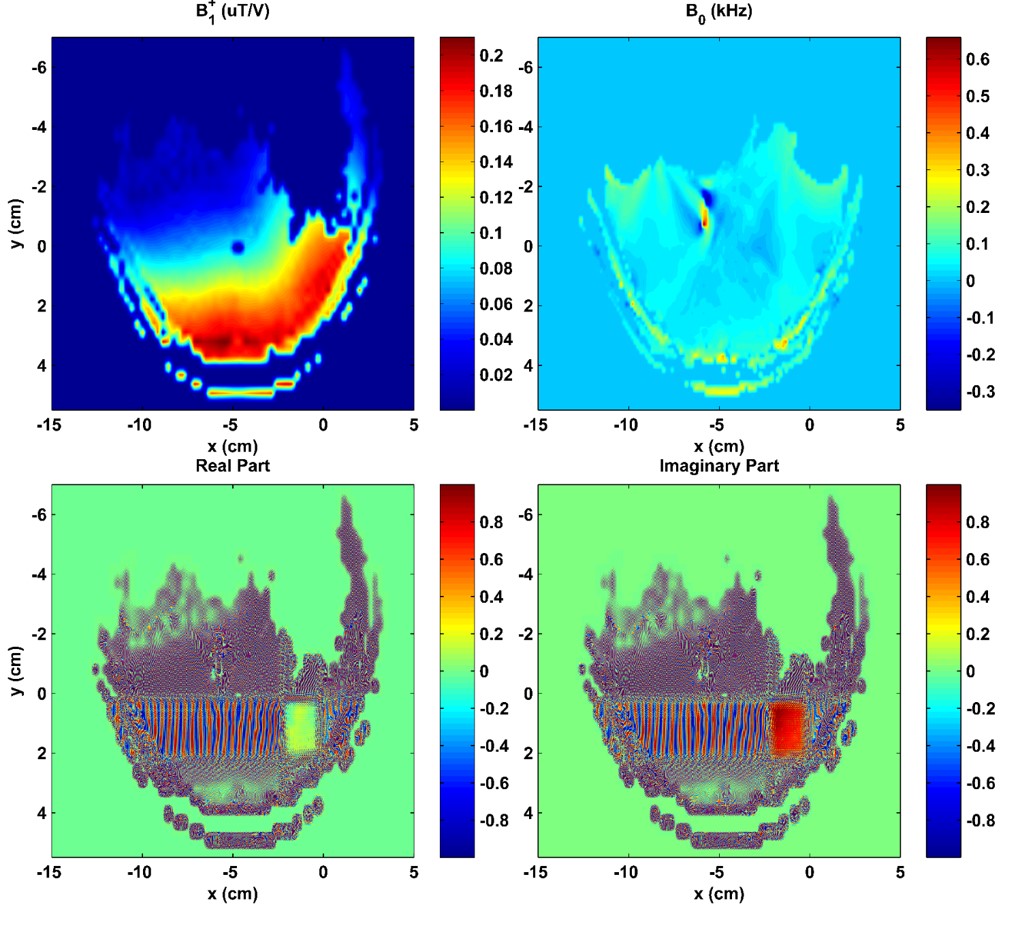
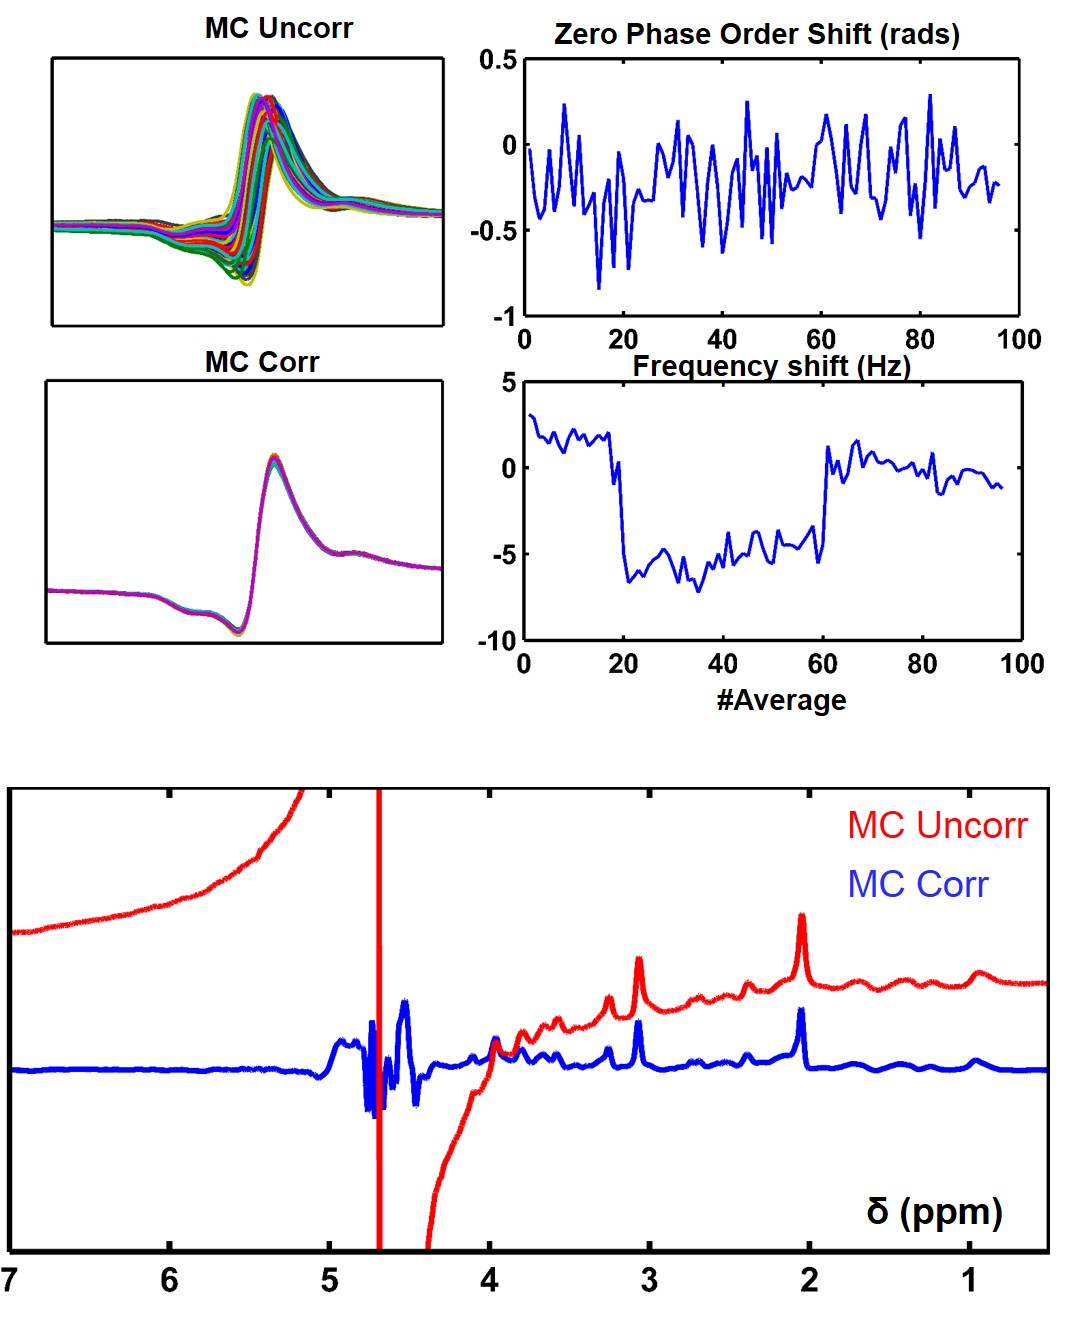
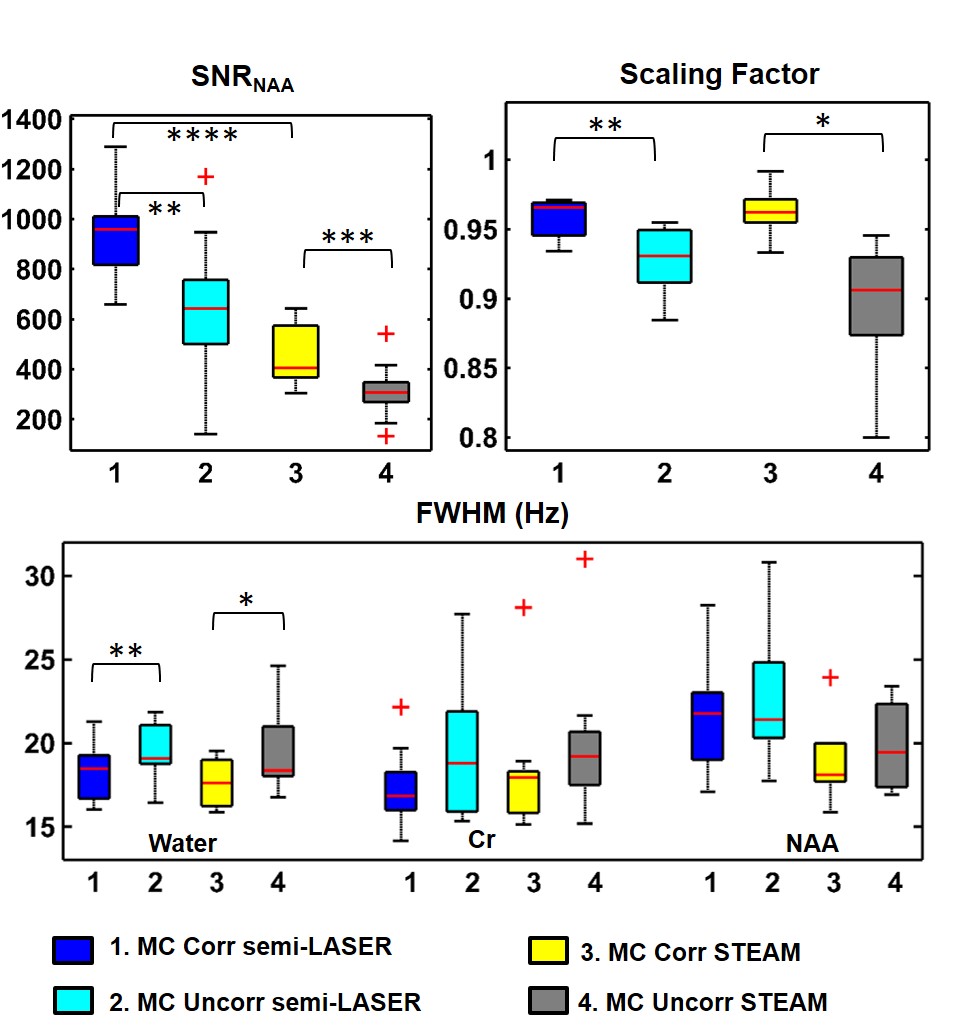
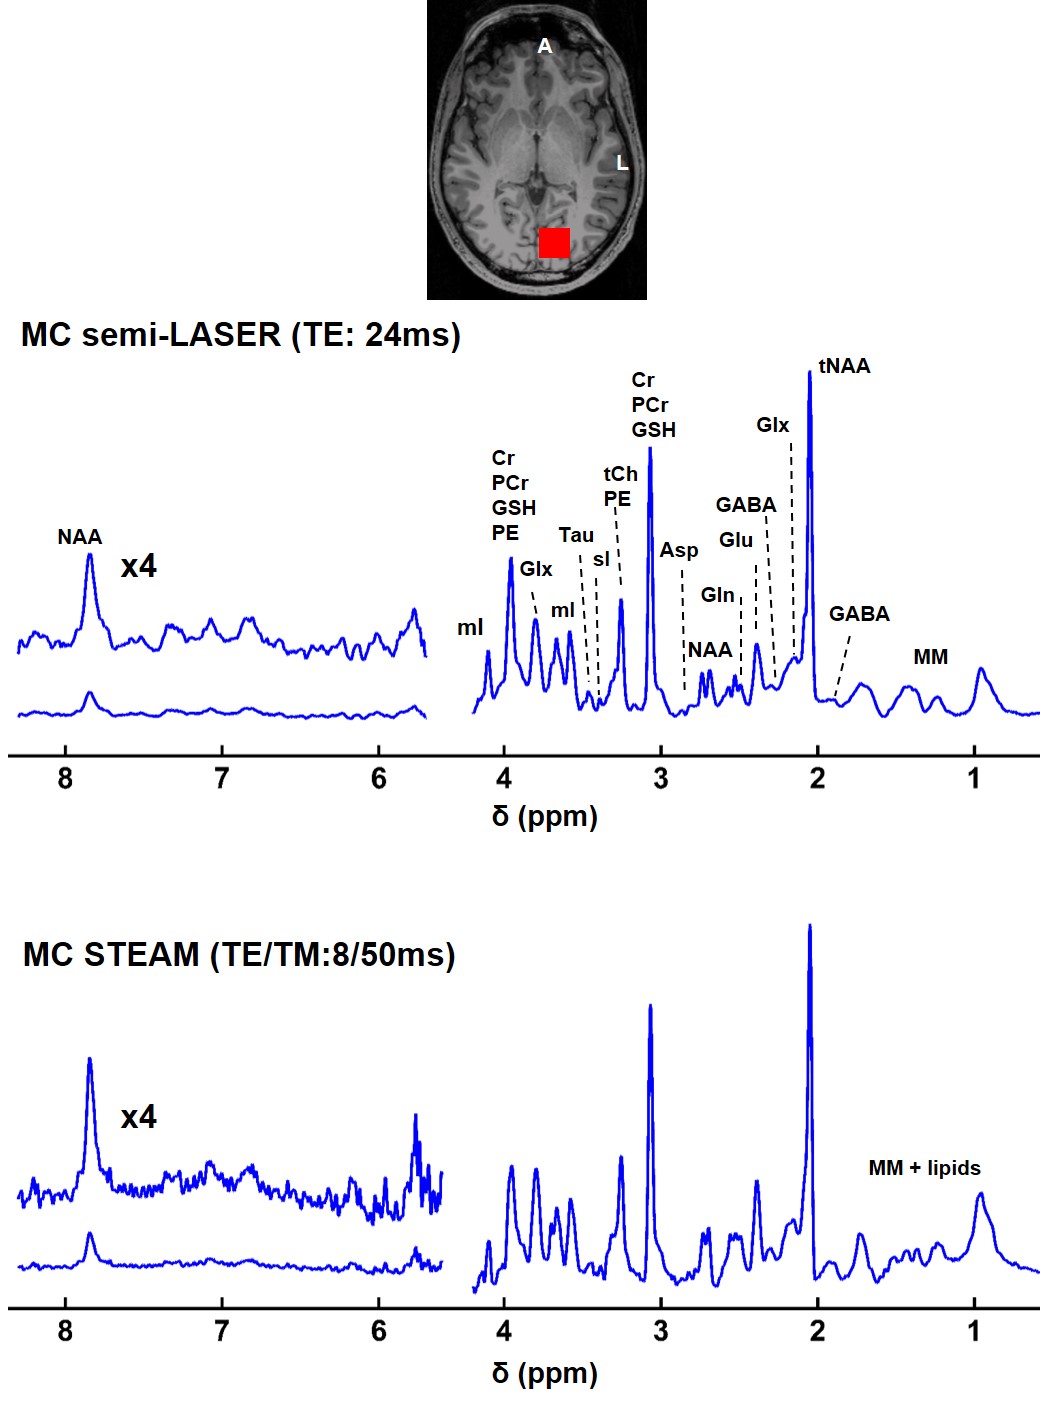
Figure 5: Spectra acquired using MC semi-LASER and MC STEAM (NEX=96) from a voxel in occipital lobe of the same volunteer. Several metabolites in both the upfield and downfield parts of the spectrum were detected. Spectra were filtered for display only using a Voigt filter (Gaussian part: 50ms, Lorentzian part: 7.8Hz) N-acetyl-aspartyl (NAA), N-acetyl-aspartyl glutamate (NAAG), NAA+NAAG (tNAA), Phosphocreatine (PCr), Creatine (Cr), glycerophosphocholine (GPC), Phosphocholine (PCh), PCh + GPC (tCh), Aspartate (Asp), Glutamate (Glu), Glutamine (Gln), Taurine (Tau), Glutathione (GSH), Phosphorylethanolamine and ethanolamine (PE), myo-Inositol (mI), scyllo-inositol (sI), γ-aminobutyric acid (GABA), Glycine (Glc) , Lactate (Lac) and Macromolecules (MM)