1060
Simultaneous Measurement of T1 and T2 Relaxation Times of Glutamate in the Frontal Cortex at 7T1National Institute of Mental Health, National Institutes of Health, Bethesda, MD, United States
Synopsis
Many central nervous system (CNS) abnormalities lead to significant changes in the microenvironment of glutamatergic neurons, which may alter relaxation times of glutamate. In this study, a method for simultaneously determining T1 and T2 of glutamate at 7T was presented. The method uses a point resolved spectroscopy (PRESS) sequence with multiple echo times, inversion-recovery times and RF suppression of aspartyl moiety of N-acetyl-aspartate (NAA).
Introduction
Glutamate as measured by magnetic resonance spectroscopy (MRS) is predominantly located in glutamatergic neurons, which are implicated in many psychiatric and neurological disorders. Previous clinical evidence has shown that altered T2 relaxation times of major singlets of the MRS spectra are associated with several psychiatric disorders 1. In this work, we modified a previously published technique 2 to simultaneously measure T1 and T2 values of MRS signals. T1 and T2 relaxation times of glutamate in the frontal grey matter (GM) and white matter (WM) voxels of eight healthy volunteers were simultaneously determined at 7T.
Methods
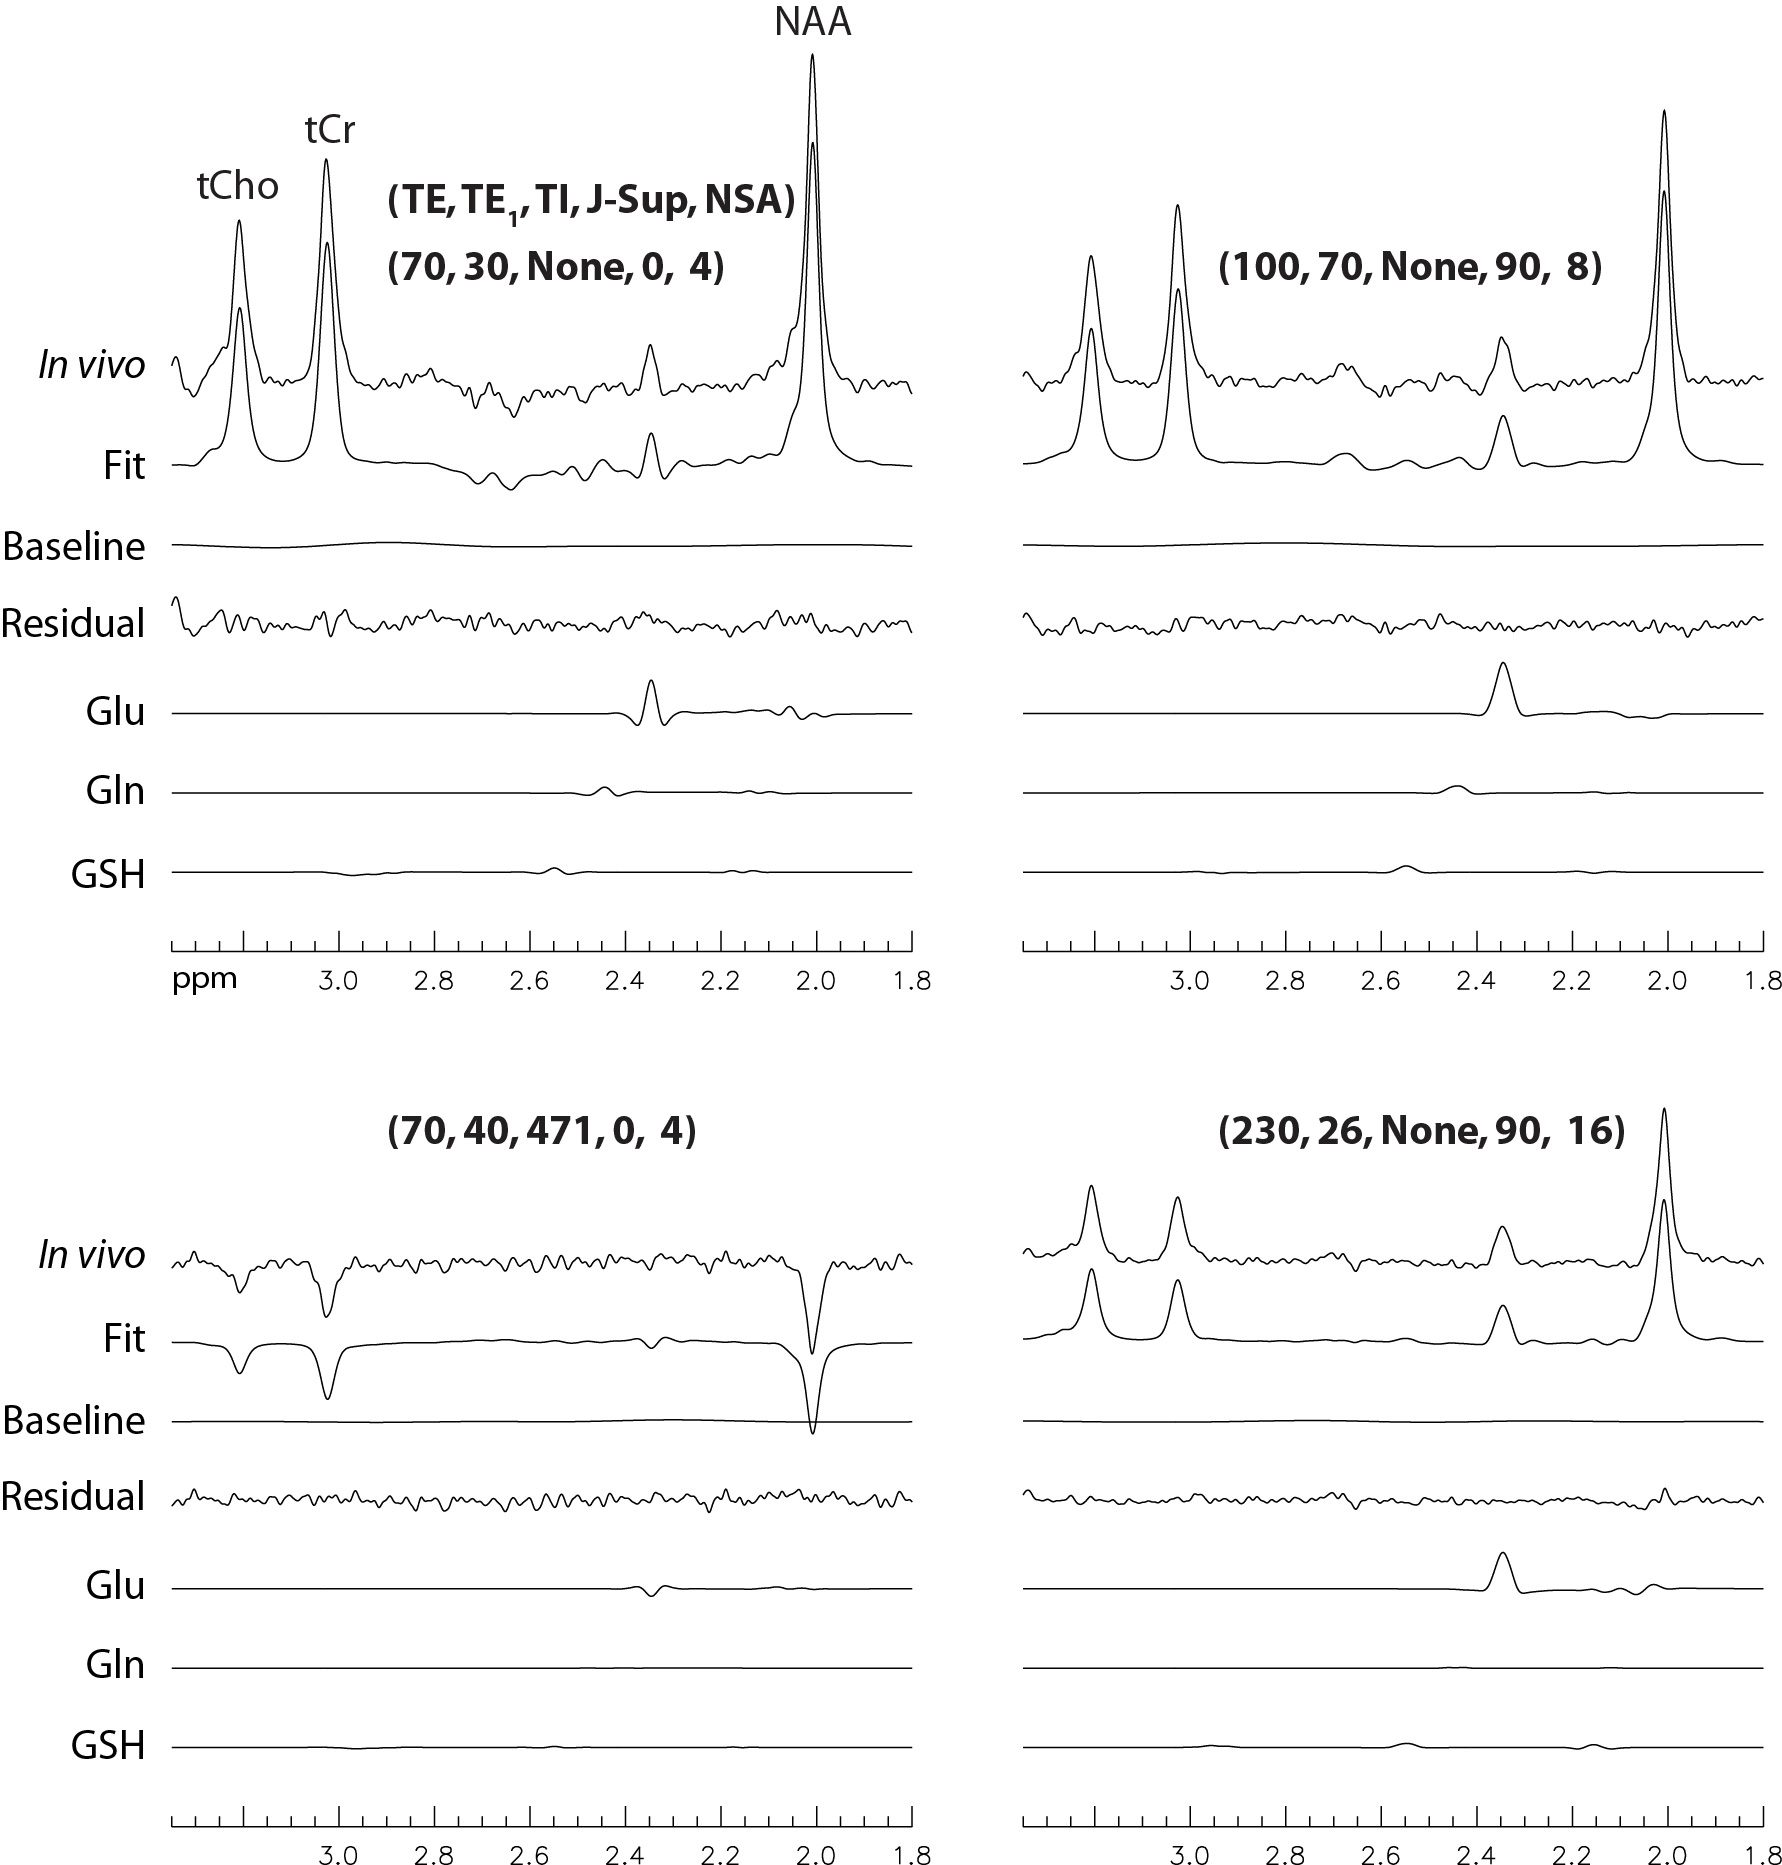
As shown in Fig. 1, the main building block of the pulse sequence consists of a PRESS sequence with an additional J-suppression pulse 3, which was used to suppress the N-acetyl-aspartate (NAA) multiplet at 2.49 ppm to eliminate its interference with the glutamine multiplet at 2.45 ppm and the glutathione (GSH) multiplet at 2.54 ppm. The following values of echo time (TE) were used to encode T2 weighting: 60, 70, 80, 90, 100, 110, 120, 130, 170, 220, and 230 ms. The TE values were chosen to maximize the sensitivity of glutamate. Prior to the PRESS block, eight variable power RF pulses with optimized relaxation delays (VAPOR) 4 were used to suppress the water signals. Before the VAPOR block, two broadband hyperbolic secant pulses were used to invert the longitudinal magnetizations of all metabolites. The first 90° hyperbolic secant pulse was used to normalize the longitudinal magnetizations of all metabolites to zero at the beginning of each time of repetition (TR). The second hyperbolic secant pulse was used to invert the longitudinal magnetizations of all metabolites for T1 weighting. Six different values of inversion time (TI) were used for the second hyperbolic secant pulse. The pulse sequence had a total of 30 different sets of acquisition parameters, corresponding to 30 sets of values for TE, TE1, TI, J-suppression flip angle, and the number of signal averages (NSA). Using a TR of 3 s, the total scan time was 9 min and 48 s.
$$ $$
Eight healthy volunteers were scanned and one of them was scanned twice. For each subject, data were collected from two 2 × 2 × 2 cm3 voxels in the frontal cortex. One voxel was placed in the grey matter (GM) dominant regions of prefrontal cortex (PFC) and medial pregenual anterior cingulate cortex (pgACC), both have been implicated in several psychiatric brain disorders 5,6. The other voxel was placed in the white matter (WM) dominant right frontal cortex. The acquired time domain data were Fourier transformed to obtain spectra for all 30 acquisition parameter sets. The 1.8 – 3.35 ppm regions of the 30 spectra were fitted together by linear combinations of the basis functions using an in-house developed fitting program. T2 scaling factors for different TEs and T1 scaling factors were computed for each iteration.
Results
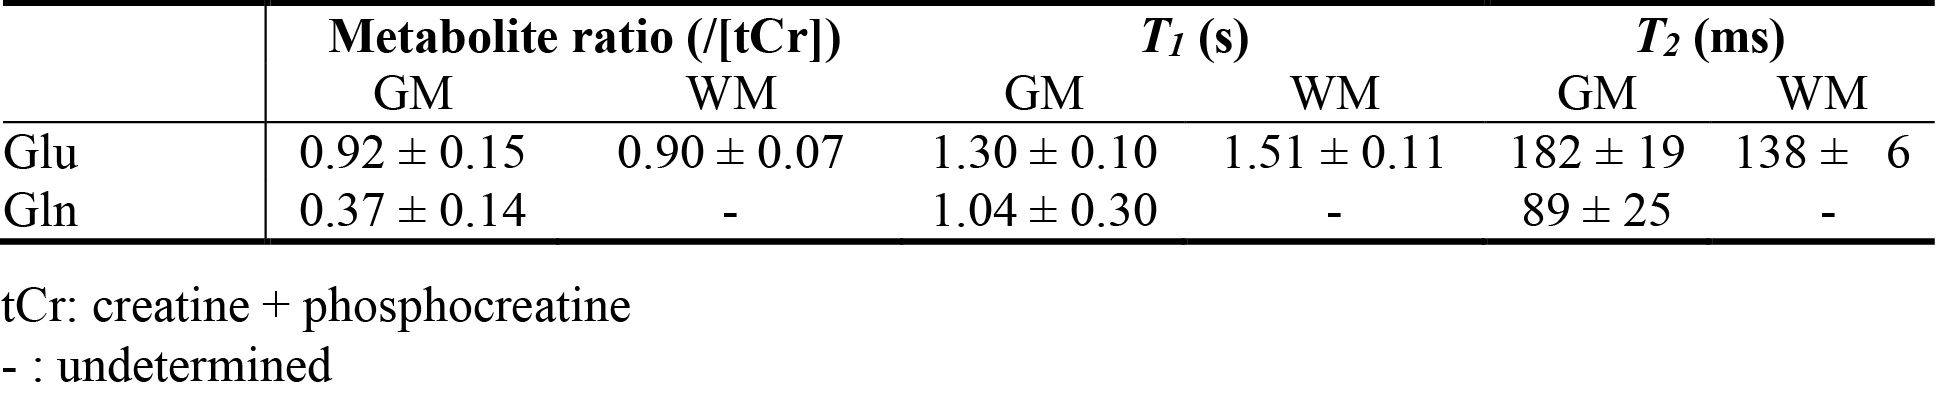
Stack plots of the reconstructed spectra and corresponding fits from the frontal GM voxel of one healthy volunteer are displayed in Fig. 2. Detailed fitting results for a typical subset of the 30 spectra were plotted in Fig. 3. Figs. 2 and 3 indicate that the signal variations of the in vivo spectra as functions of TE, TE1, TI, and J-suppression flip angle agreed very well with the spectral model and first principles. Quantifications of glutamate and glutamine are given in Table 1. T1 of glutamate in the frontal GM region (1.30 ± 0.10 s) was significantly shorter (p < 0.01) than in the frontal WM region (1.51 ± 0.11 s); T2 of glutamate in the frontal GM region (182 ± 19 ms) was significantly longer (p < 0.01) than in the frontal WM region (138 ± 6 ms).Discussion and Conclusions
Similar to the singlets 7, glutamate T2 in the GM was significantly longer than in the WM. On the other hand, T1 of glutamate in the frontal GM region was significantly shorter than in the frontal WM region. Concentration, T1, and T2 values of glutamine were also quantified in the frontal GM voxel (see Table 1). Overall, the electrically neutral glutamine relaxes significantly faster in tissue than the negatively charged glutamate. Due to its much lower concentration in WM, glutamine in WM was undetermined. In summary, the proposed method allows simultaneous determination of the concentration, T1, and T2 values of glutamate at 7T with relatively high precision in less than ten minutes of scan time per voxel, making it practically feasible to probe changes in the microenvironment of glutamatergic neurons of various brain disorders.Acknowledgements
We thank Mr. Christopher Johnson and Mrs. Maria Ferraris Araneta for recruiting and caring for the healthy volunteers. This work was supported by the intramural programs of the NIH and NIMH.References
1. Ongur D, Prescot AP, Jensen JE, Rouse ED, Cohen BM, Renshaw PF, Olson DP. T(2) Relaxation Time Abnormalities in Bipolar Disorder and Schizophrenia. Magnetic Resonance in Medicine 2010;63(1):1-8.
2. An L, Li S, and Shen J. "Simultaneous Determination of Metabolite Concentrations, Longitudinal and Transverse Relaxation Times", ISMRM 2016:3932, Singapore.
3. An L, Li S, Murdoch JB, Araneta MF, Johnson C, Shen J. Detection of glutamate, glutamine, and glutathione by radiofrequency suppression and echo time optimization at 7 tesla. Magnetic Resonance in Medicine 2015;73:451-458.
4. Tkac I, Andersen P, Adriany G, Merkle H, Ugurbil K, Gruetter R. In vivo H-1 NMR spectroscopy of the human brain at 7 T. Magnetic Resonance in Medicine 2001;46(3):451-456.
5. Devinsky O, Morrell MJ, Vogt BA. Contributions of Anterior Cingulate Cortex to Behaviour. Brain 1995;118:279-306.
6. Miller EK, Cohen JD. An integrative theory of prefrontal cortex function. Annu Rev Neurosci 2001;24:167-202.
7. Marjanska M, Auerbach EJ, Valabregue R, Van de Moortele PF, Adriany G, Garwood M. Localized H-1 NMR spectroscopy in different regions of human brain in vivo at 7T: T-2 relaxation times and concentrations of cerebral metabolites. Nmr in Biomedicine 2012;25(2):332-339.
Figures
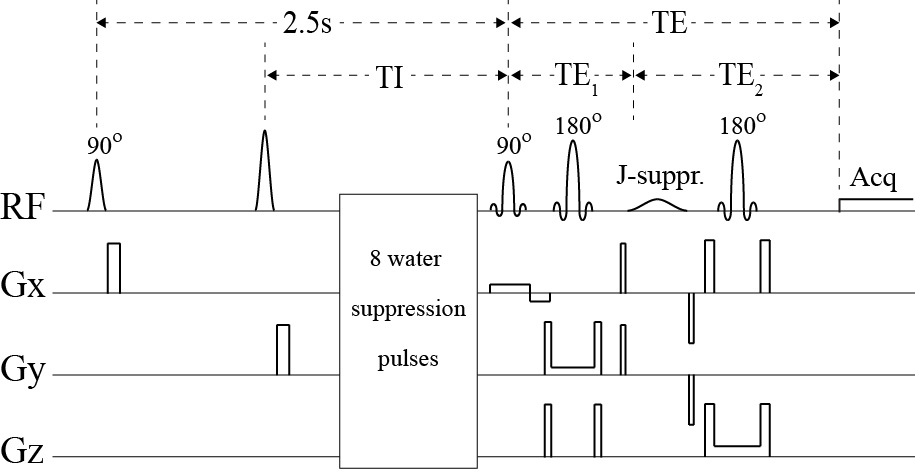
Fig. 1 Proposed pulse sequence with multiple variable acquisition parameters. The second RF pulse is a broadband hyperbolic secant pulse with a variable TI and a variable flip angle.