1059
High resolution maps of individual macromolecule components in the human brain at 9.4T1MPI for Biological Cybernetics, Tuebingen, Germany, 2IMPRS for Cognitive and Systems Neuroscience, Eberhard Karls University of Tübingen, Tuebingen, Germany, 3Institute of Physics, Ernst-Moritz-Arndt University Greifswald, Greifswald, Germany
Synopsis
Although ultra-short TE spectroscopy sequences enhance the information content of the spectrum, they are, in their nature, prone to quantification biases if the macromolecular (MM) components are not taken into account The aim of this study, was to 1) perform macromolecule mapping at 9.4T using an ultra-short TE double-inversion recovery (DIR) MRSI sequence, 2) model and parametrize the individual MM components, and 3) extract high resolution maps of individual MM components using the modelled MM basis set.
Introduction
Although ultra-short TE spectroscopy sequences enhance the information content of the spectrum, they are, in their nature, prone to quantification biases if the macromolecular (MM) components are not taken into account1,2. Additionally, evidence for regional differences in different MM components2 suggests that incorporating a single measured MM baseline for the fit cannot sufficiently explain the variations in different regions of the brain.
The aim of this study, was to 1) perform macromolecule mapping at 9.4T using an ultra-short TE double-inversion recovery (DIR) MRSI sequence, 2) model and parametrize the individual MM components, and 3) extract high resolution maps of individual MM components using the modelled MM basis set.
Methods
A total of 5 healthy volunteers were scanned on a 9.4T Siemens whole-body scanner with an in-house developed 16Tx/31Rx coil3 with a customized FID MRSI sequence4.
Metabolite-nulled spectra were acquired via DIR using a 10th order WURST pulse1 designed and optimized for use at 9.4T for an average transmit field of 15uT. The inversion times were numerically optimized for a range of T1 and T2 values using Bloch simulations and experimentally fine-adjusted to suppress residual metabolites. An optimized water suppression scheme4 with a duration of 62ms was interleaved. The WURST pulse duration was 40ms, bandwidth 2000Hz, and frequency shift -800Hz. The acquisition parameters were: FOV 200mmx200mmx10mm, matrix size 32x32x1, TR 4550ms, bandwidth 4000Hz, acquisition time 128ms.
Metabolite MRSI data at both low (32x32) and high (64x64) spatial resolutions were acquired using an FID MRSI sequence with an optimized 3 pulse water suppression scheme4. Other parameters include: FOV 200mmx200mm, slice thickness 10mm, flip angle 28 degrees, TR 220ms, bandwidth 4000Hz, acquisition time 128ms.
The metabolite-nulled spectra were used to parametrize and model the experimental macromolecule baseline as input for a MM basis set using HLSVD5 while using Pfeuffer et al6 as a guideline. The resulting macromolecule basis set was incorporated into LCMODEL7 and parameters were then fine-adjusted to best fit the measured MM. Maps for individual macromolecules were extracted from these fits and compared to those resulting from fitting the non-metabolite-nulled high resolution MRSI dataset with a basis set including all the metabolites and the parametrized macromolecules.
Results/Discussion
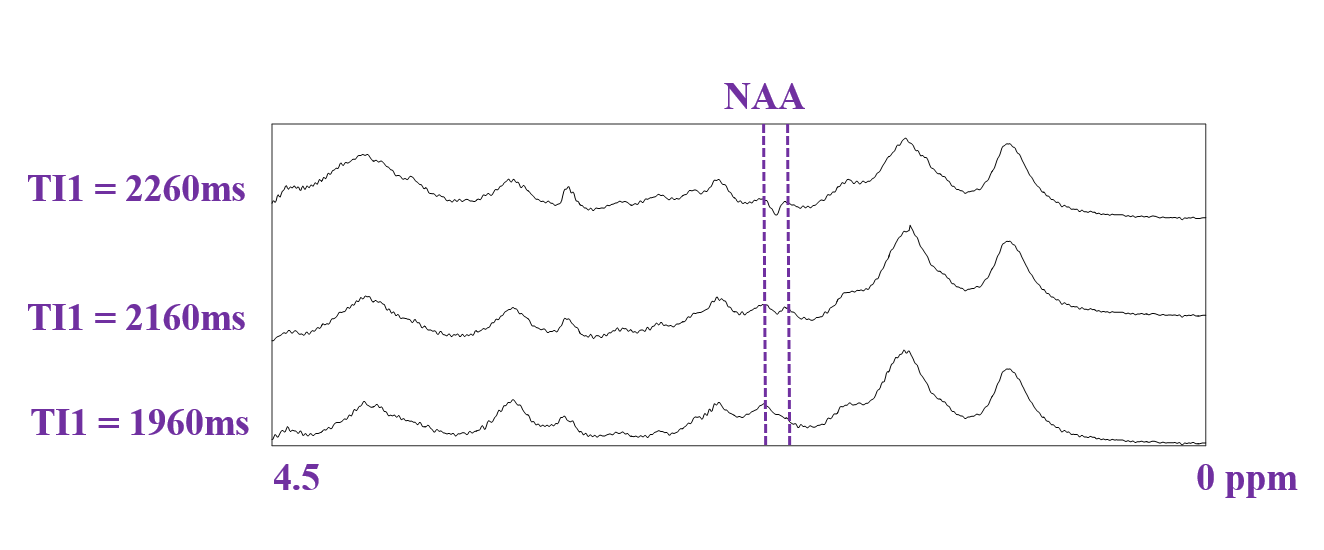
Figure 1 shows raw metabolite-nulled spectra acquired at different TI1 inversion times to fine-adjust this parameter and observe when the contribution of the negative NAA peak disappears (TI1=1960ms while TI2=600ms).
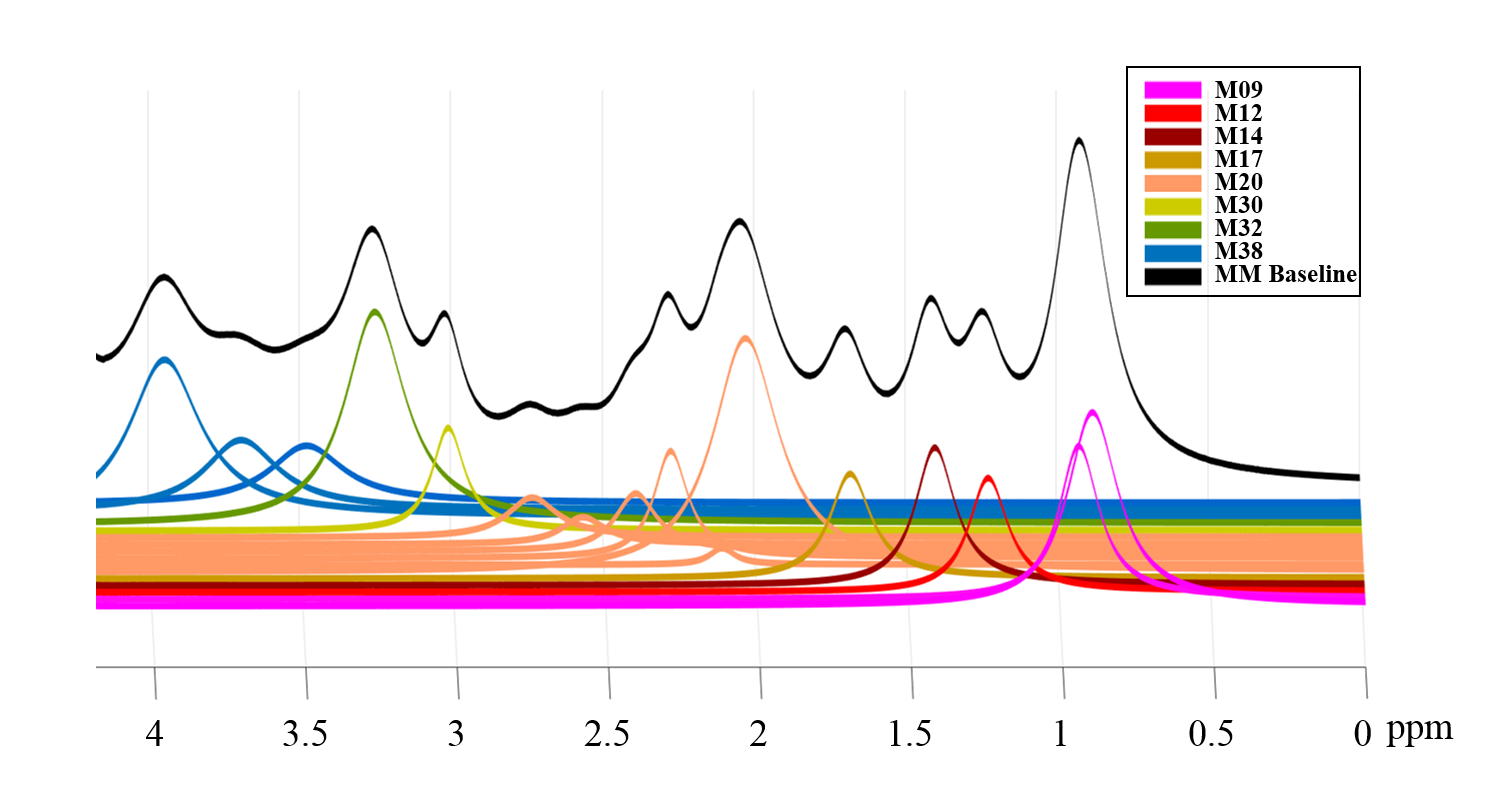
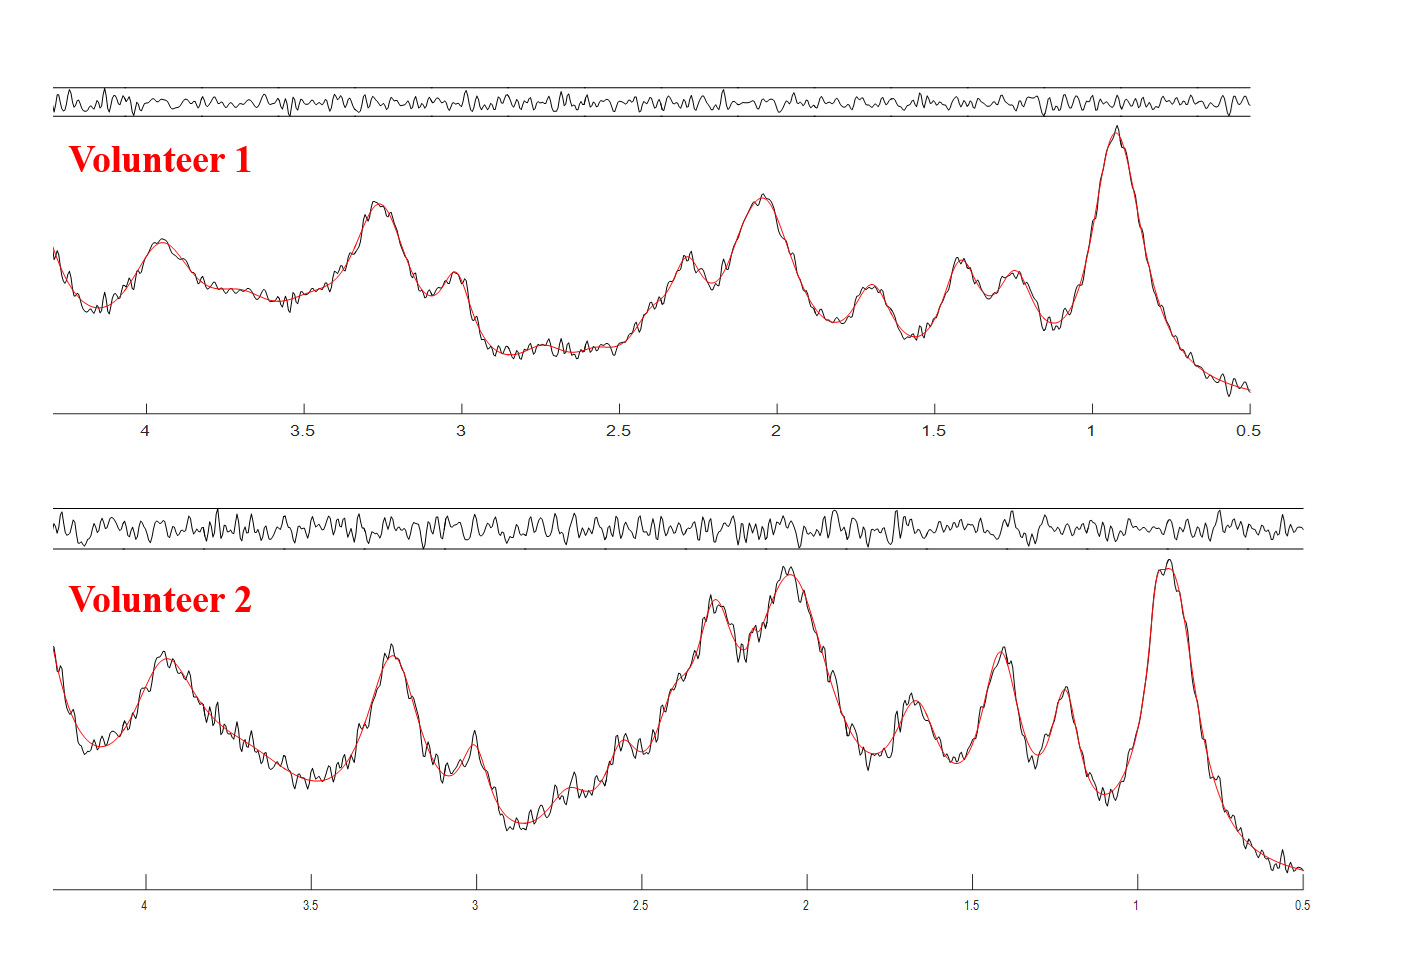
Figure 2 shows the MM components that were used to model the basis-set, the assignment of macromolecules are in agreement with De Graaf8. Figure 3 shows two macromolecule spectra from the central voxel of the brains of two different volunteers, along with their fitting result and residual resulting from fitting them with the modeled MM basis set. The residual confirms the accuracy in modelling and parametrizing the basis-set.
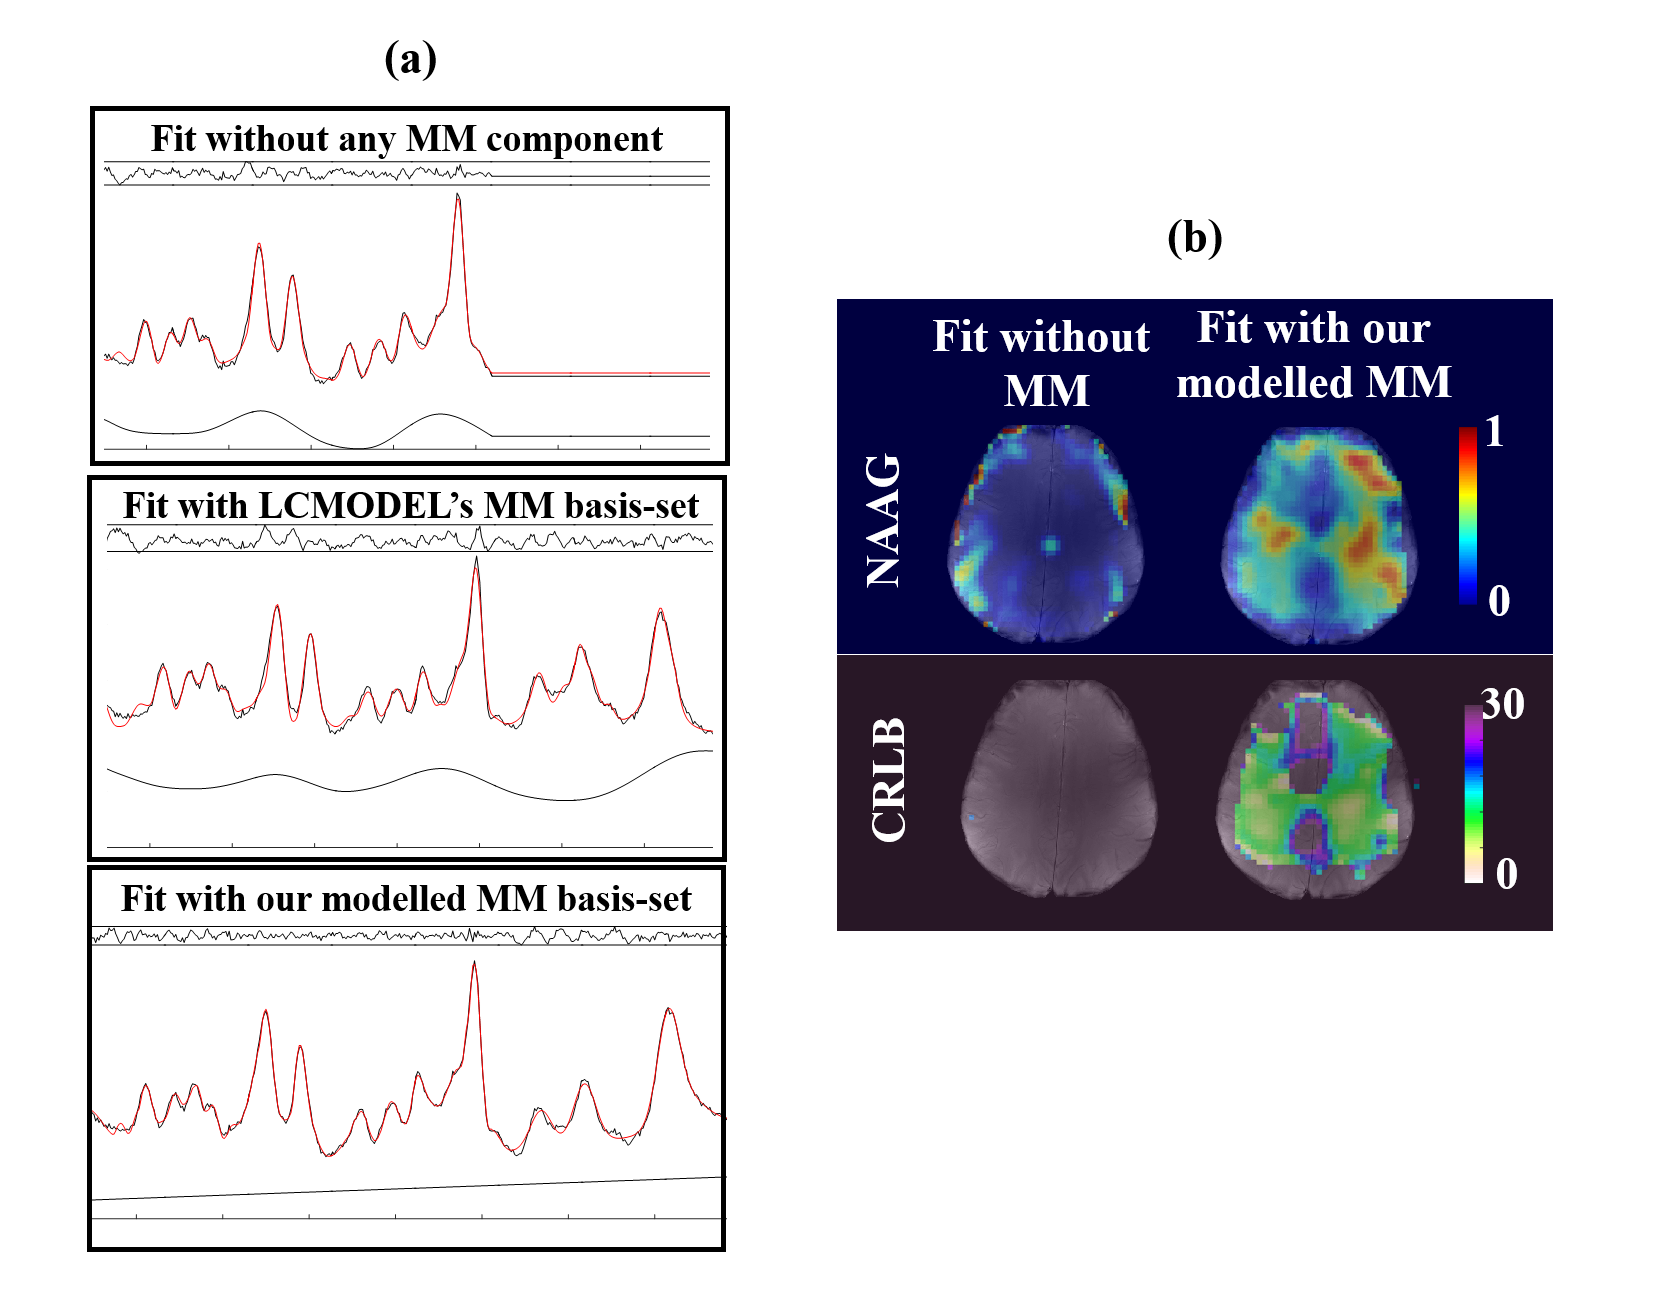
Figure 4a shows a non-metabolite nulled spectrum fit with three different basis-sets: 1) only metabolites, 2) metabolites and LCMODEL’s simulated macromolecule basis-set6, and 3) metabolites and our parametrized macromolecule components. The flat baseline after fitting the spectrum with our modelled MM basis-set shows that the modelling of the macromolecular base-line was successful. In contrast, the other two fits suffer from structured residuals and non-flat spline baselines. Figure 3b shows that when our modelled MM basis-set is used for the fit, NAAG can be detected with CRLB of below 30 in the white matter despite the low spatial resolution, whereas without the basis-set it was almost undetectable.
Finally, figure
5 shows individual macromolecule maps obtained at low spatial resolution by
fitting the metabolite-nulled MRSI dataset, and at high spatial resolution
resulting from fitting the metabolite spectra. The two sets of maps show
similar spatial distribution of the macromolecules. This shows that the
modelling of the MM components was successful for fitting both the
metabolite-nulled and metabolite spectra. Characteristic differences between
gray and white matter can be seen in the maps of M9, M14, M17 and M30 (where
the concentration in gray matter is higher) and in M32 and M38 (where the
concentration in white matter is higher).
Conclusion
Metabolite-nulled spectroscopic images were acquired at 9.4T using a DIR FID MRSI sequence. The acquired macromolecular baseline was parametrized and modelled. The resulting basis set was used to fit both metabolite-nulled and non-metabolite nulled spectra. As a result, high resolution maps of the individual macromolecules were obtained.
We showed that smaller metabolites such as NAAG can be reliably detected by including parametrized MM in fitting. The regional differences of the individual macromolecules confirms the need for a parametrized MM basis-set as opposed to using a single measured MM baseline for fitting.
Acknowledgements
This study was supported by the European Research Council Starting grant, project SYNAPLAST MR #679927.References
[1] Povazan et.al, NeuroImage 2015; [2] Geades et al., ISMRM 2016 [3] Shajan et al., MRM 2014 [4] Nassirpour et al., ISMRM workshop on spectroscopy 2016. [5] Cabanes et al., JMR 2001 [6] Pfeuffer et al., JMR 1999 [7] Provencher, MRM 1993 [8] De Graaf, Wiley 2007Figures