1058
Detection of MM using metabolite-nulled MEGA-LASER at 3T – A possible effect on GABA+ signal1Department of Biomedical Imaging and Image-guided Therapy, High Field MR Centre, Medical University Vienna, Vienna, Austria, 2Christian Doppler Laboratory for Clinical Molecular MR Imaging, Vienna, Austria, 3Jessenius Faculty of Medicine in Martin, Biomedical Center Martin, Division of Neurosciences, Comenius University in Bratislava, Martin, Slovakia, 4Harvard Medical School, Martinos Center for Biomedical Imaging, Massachusetts General Hospital, Boston, MA, United States
Synopsis
In GABA-edited spectroscopy signal of macromolecules overlaps the signal of GABA. This macromolecular contribution to GABA signal (GABA+) is variable throughout the brain and can bias the quantification. We aimed to map the signal of macromolecules at 2.99 ppm using metabolite-nulled 3D MEGA-LASER MRSI. We found the GABA+/total creatine to be higher in white matter (45%), which contradicts the literature. The MM2.99ppm was found higher in white matter as well (24%). The macromolecular tissue distribution is among other factors affecting the GABA+ signal, therefore the detection of GABA is preferable to GABA+ if the removal of macromolecules is possible.
Purpose
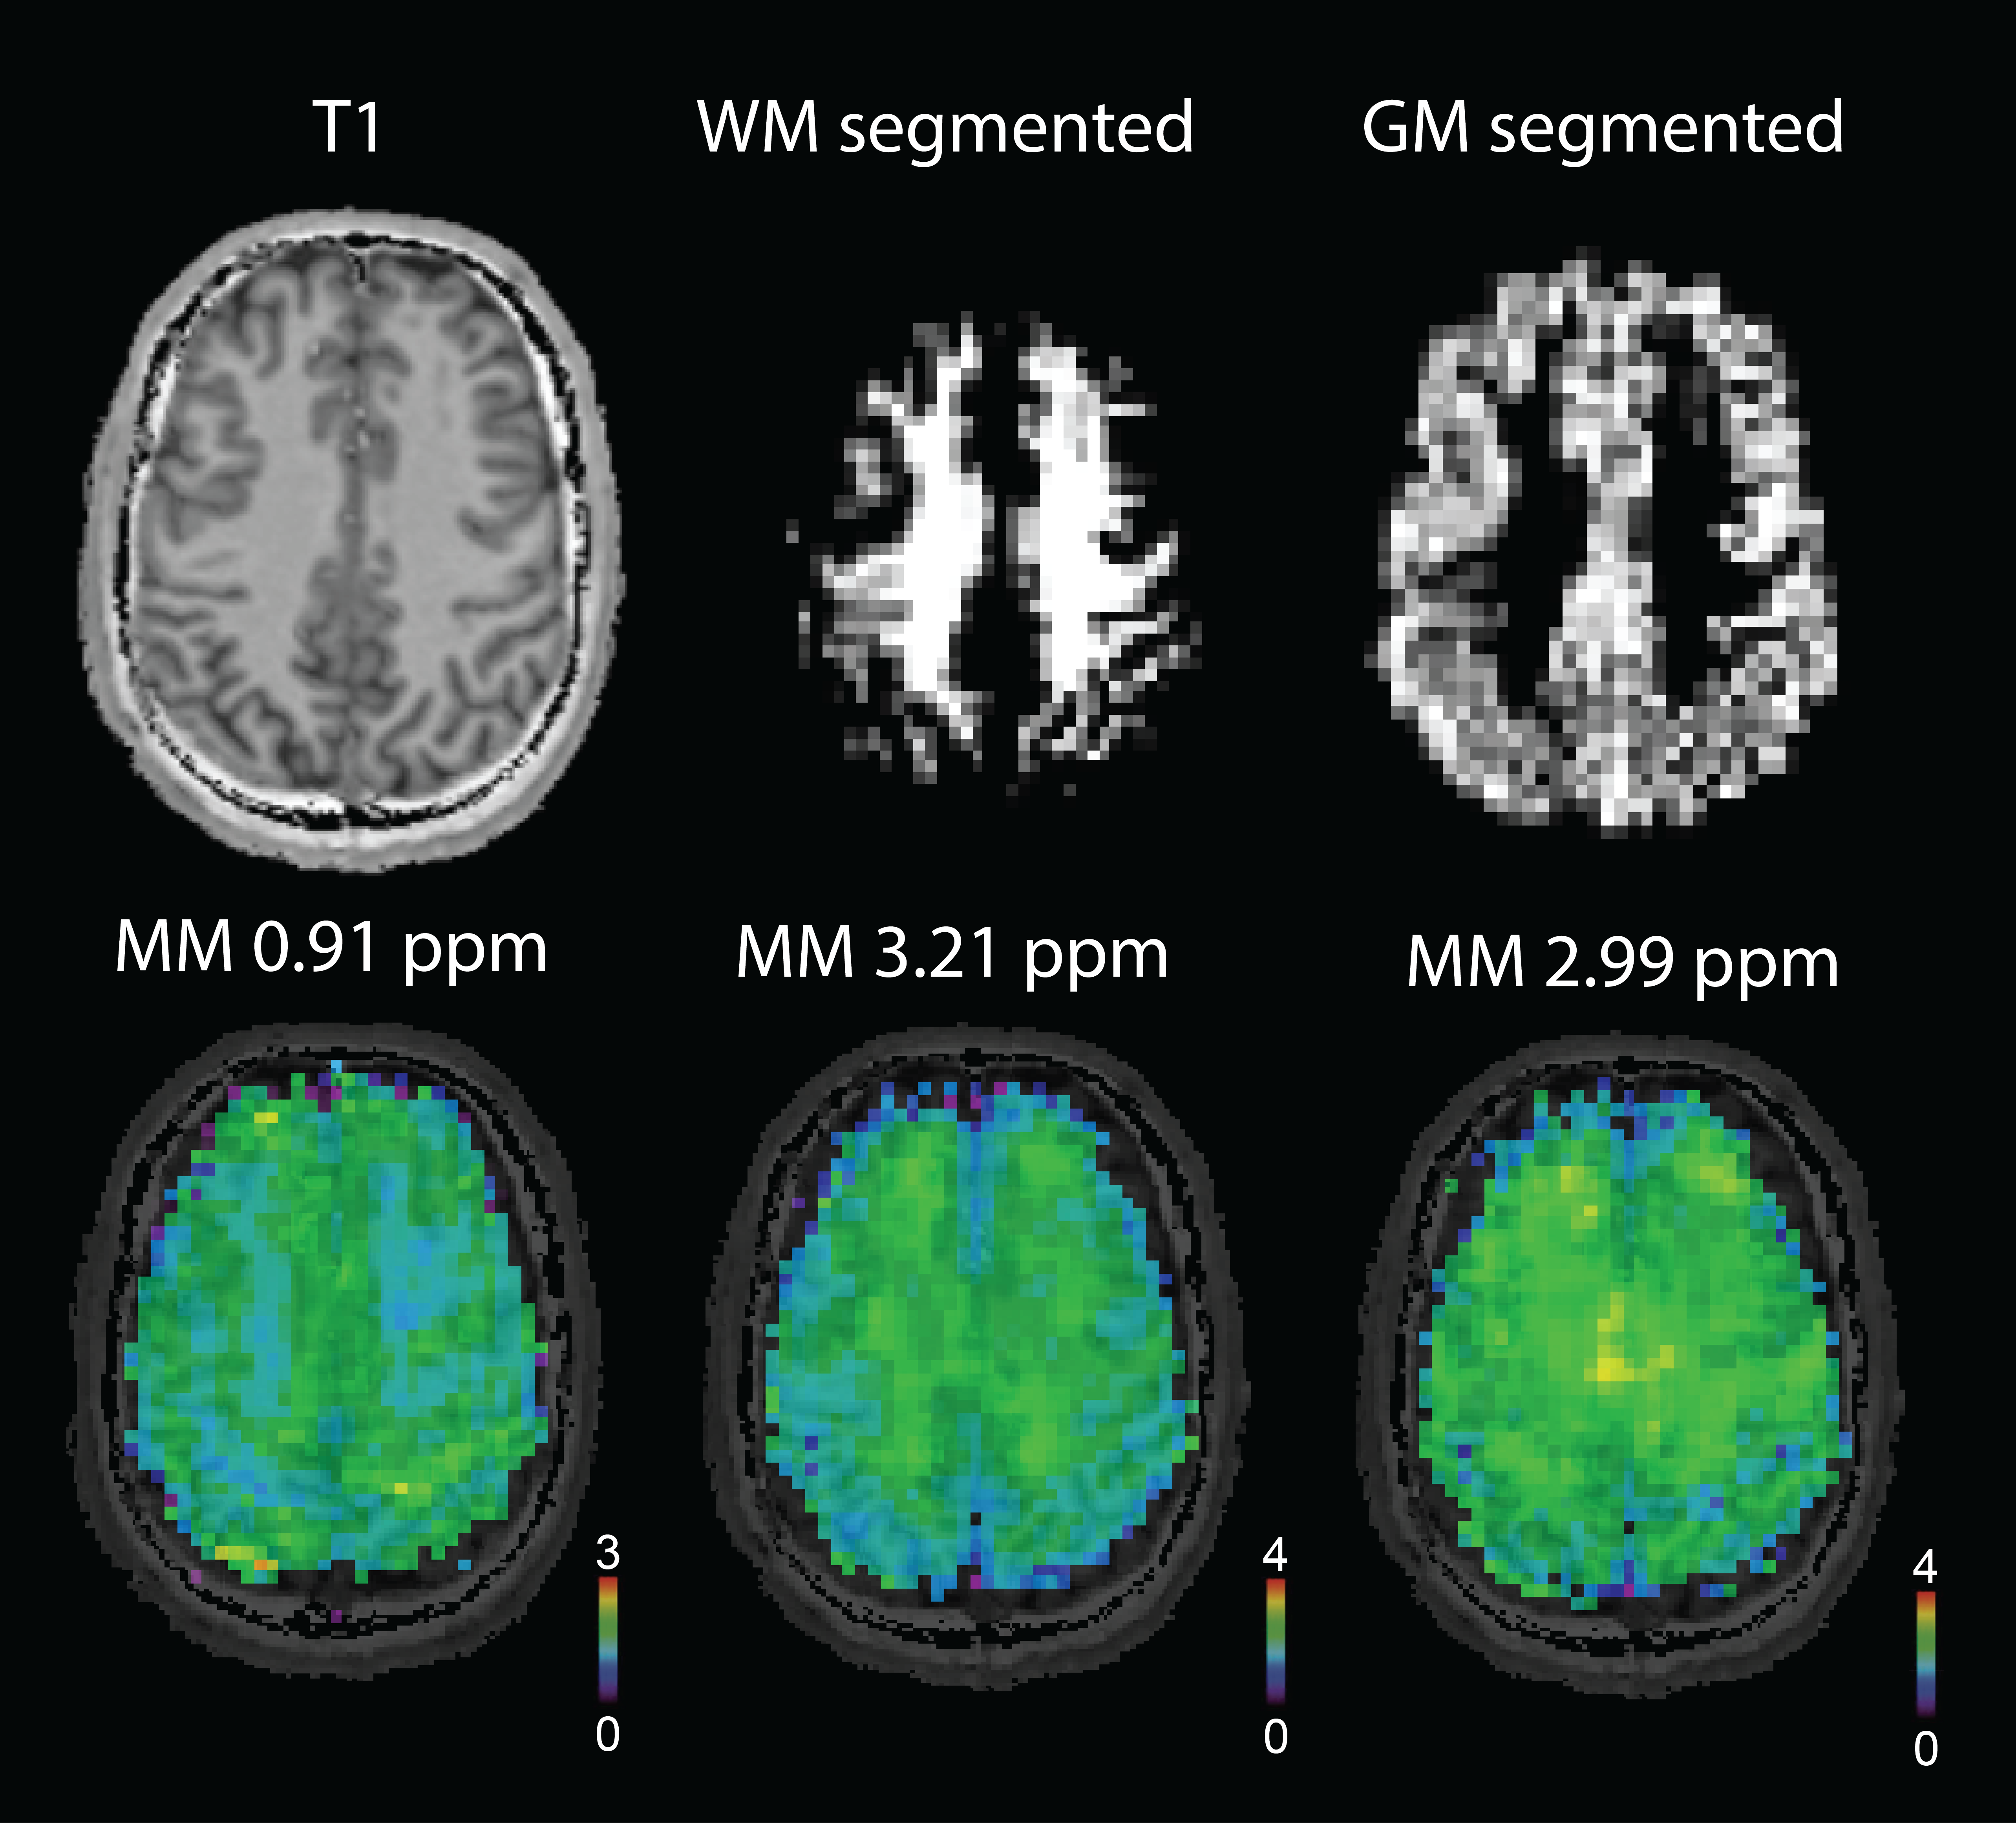
Gamma-aminobutyric acid (GABA) is considered to be the most prominent inhibitory neurotransmitter in the human brain. GABA-edited 1H magnetic resonance spectroscopy has shown to be a valuable technique to detect brain GABA levels in vivo. However in conventional GABA-edited MRS, the signal of macromolecules (MM) at 2.99 ppm is superimposed on the signal of GABA at 3.00 ppm due to co-editing. The MM contamination can be as high as 50%1, thus biasing the GABA quantification. Even though several approaches to handle MM were introduced2–4 many groups still report only GABA+ values. The GABA concentration has been reported two times higher in gray matter (GM) than white matter (WM)5. MM signals were found to be variable throughout the brain volume even in a healthy brain6. In addition, our previous studies at 7T have shown a higher concentration of MM peaks around 3 ppm in WM (Fig.1), as opposed to a major MM peak at 0.91 ppm. Hence the MM contribution to GABA+ may vary if GABA-edited MRSI is utilized and may substantially affect the GABA estimation. The objective of this study was to detect and map the MM signal at 2.99 ppm by including a pre-inversion into the MEGA-LASER 3D-MRSI sequence and discuss the possible influence on GABA+ signal.Methods
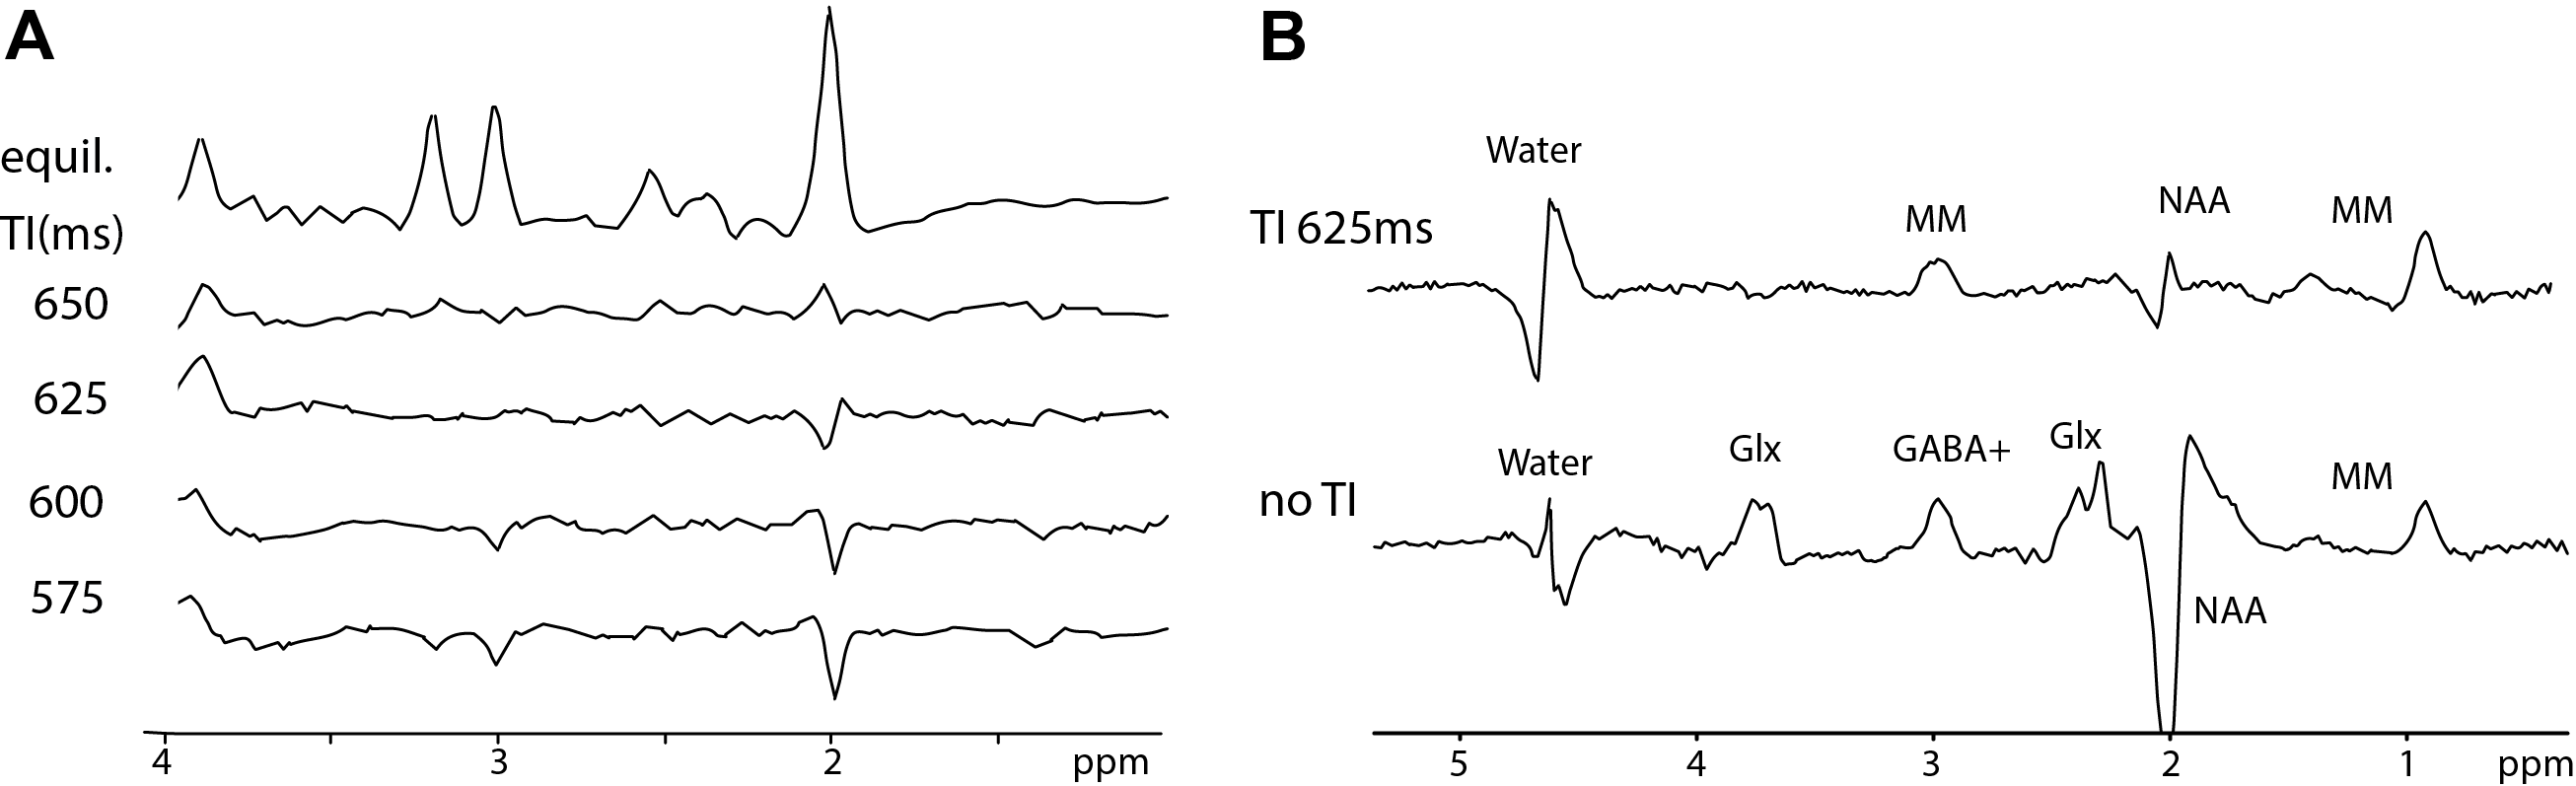
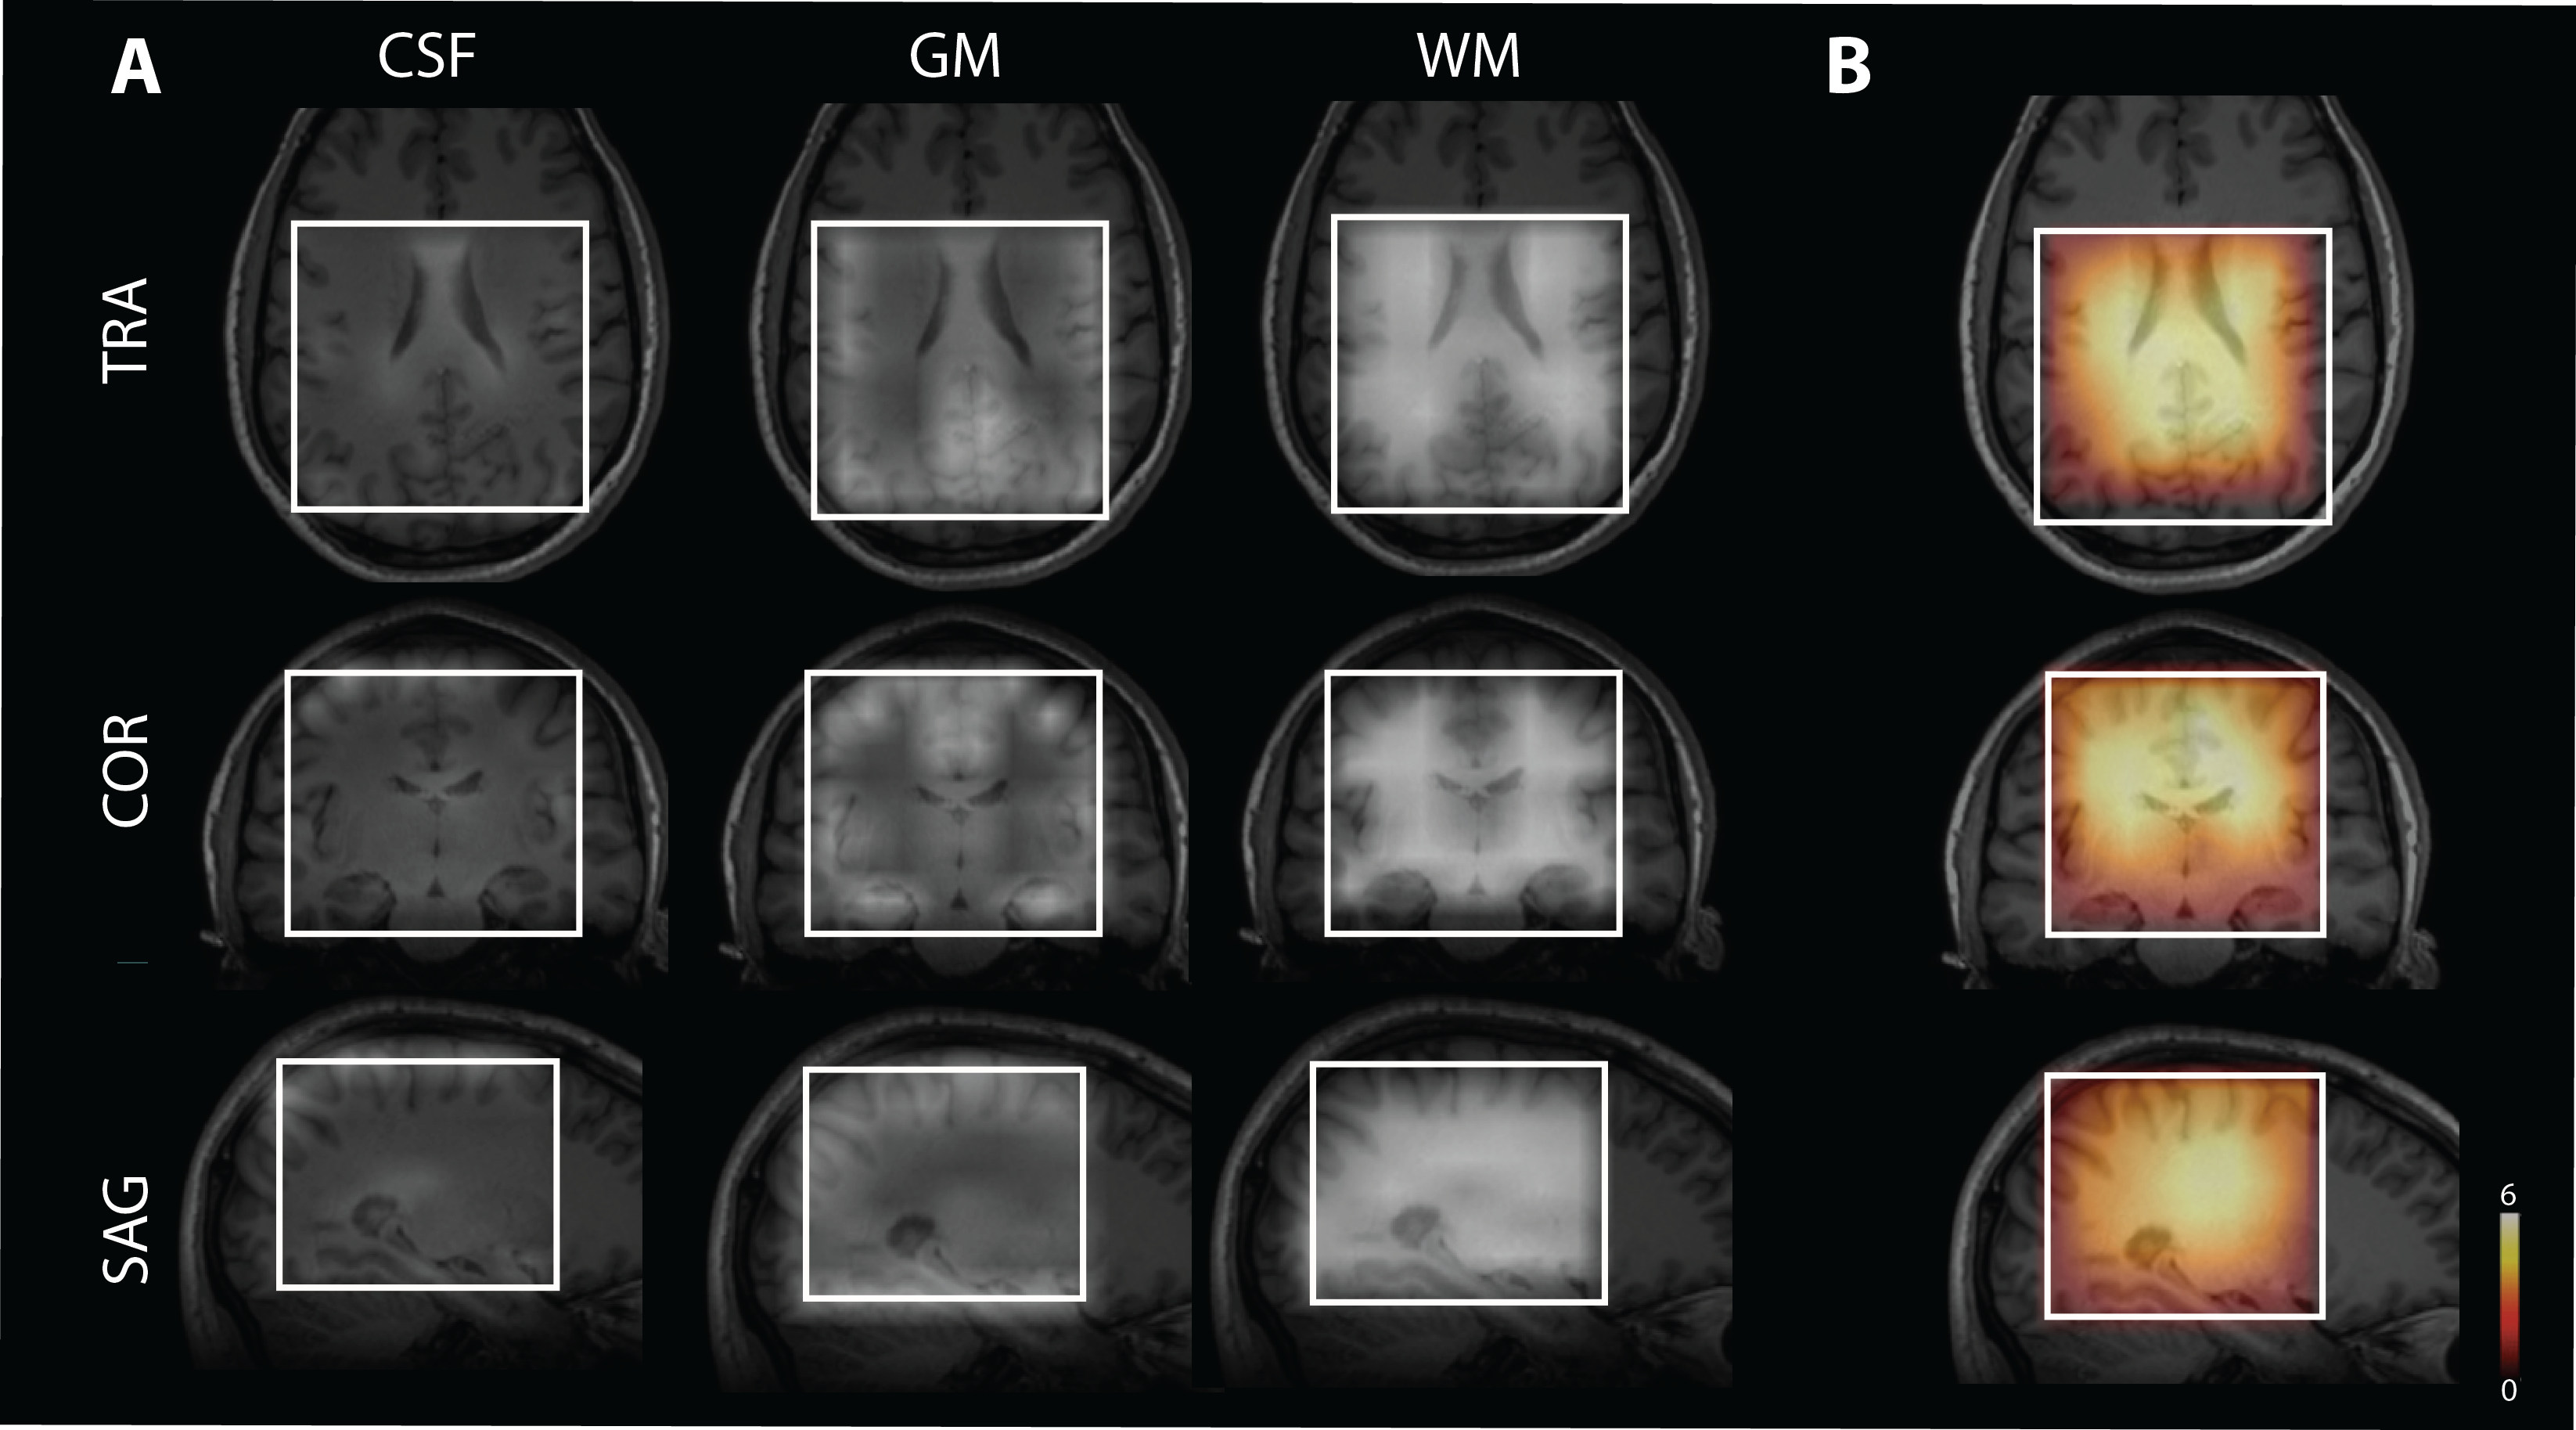
Seventeen healthy volunteers (9 males, with mean age of 29±6) were measured on a TIM Trio 3 T (Siemens Healthcare, Erlangen, Germany). A body coil was used for transmission and a 32‐channel head coil was used for signal reception (Siemens Healthcare). Constant‐density, spiral‐encoded, 3D‐MRSI sequence with MEGA‐LASER editing and real‐time motion, shim and frequency correction was used as described previously7,8. Fourteen volunteers were measured with the following parameters: TR=1.6s, TE=68ms, Gaussian editing pulses (60 Hz bandwidth/ 14.8 ms duration), 16 averages, VOI= 80 × 85 × 60mm3, matrix size of 14 × 14 × 12 (i.e. ~3 cm3 nominal voxel size) interpolated to 16 × 16 × 16 matrix. A WURST inversion pulse (5ms, 1300Hz) was implemented in the sequence prior to the excitation to achieve metabolite-nulling (TR=1.8s, TE=68ms, TI=625ms, 22 averages) in the remaining three volunteers. To determine an optimal inversion time a simulation and an inversion recovery experiment were carried out (Fig.2A). Spectral pre-processing including baseline correction and frequency alignment was done using in-house developed software. Spectra were quantified using LCModel 6.3 except of the signal of MM2.99ppm which was quantified by integration of the spectrum from 2.96-3.04 ppm. Tissue maps were derived from a T1-weighted MPRAGE image using FAST (FSL 5.0) and convoluted with the spatial response function of the MRSI (Fig.3A).Results
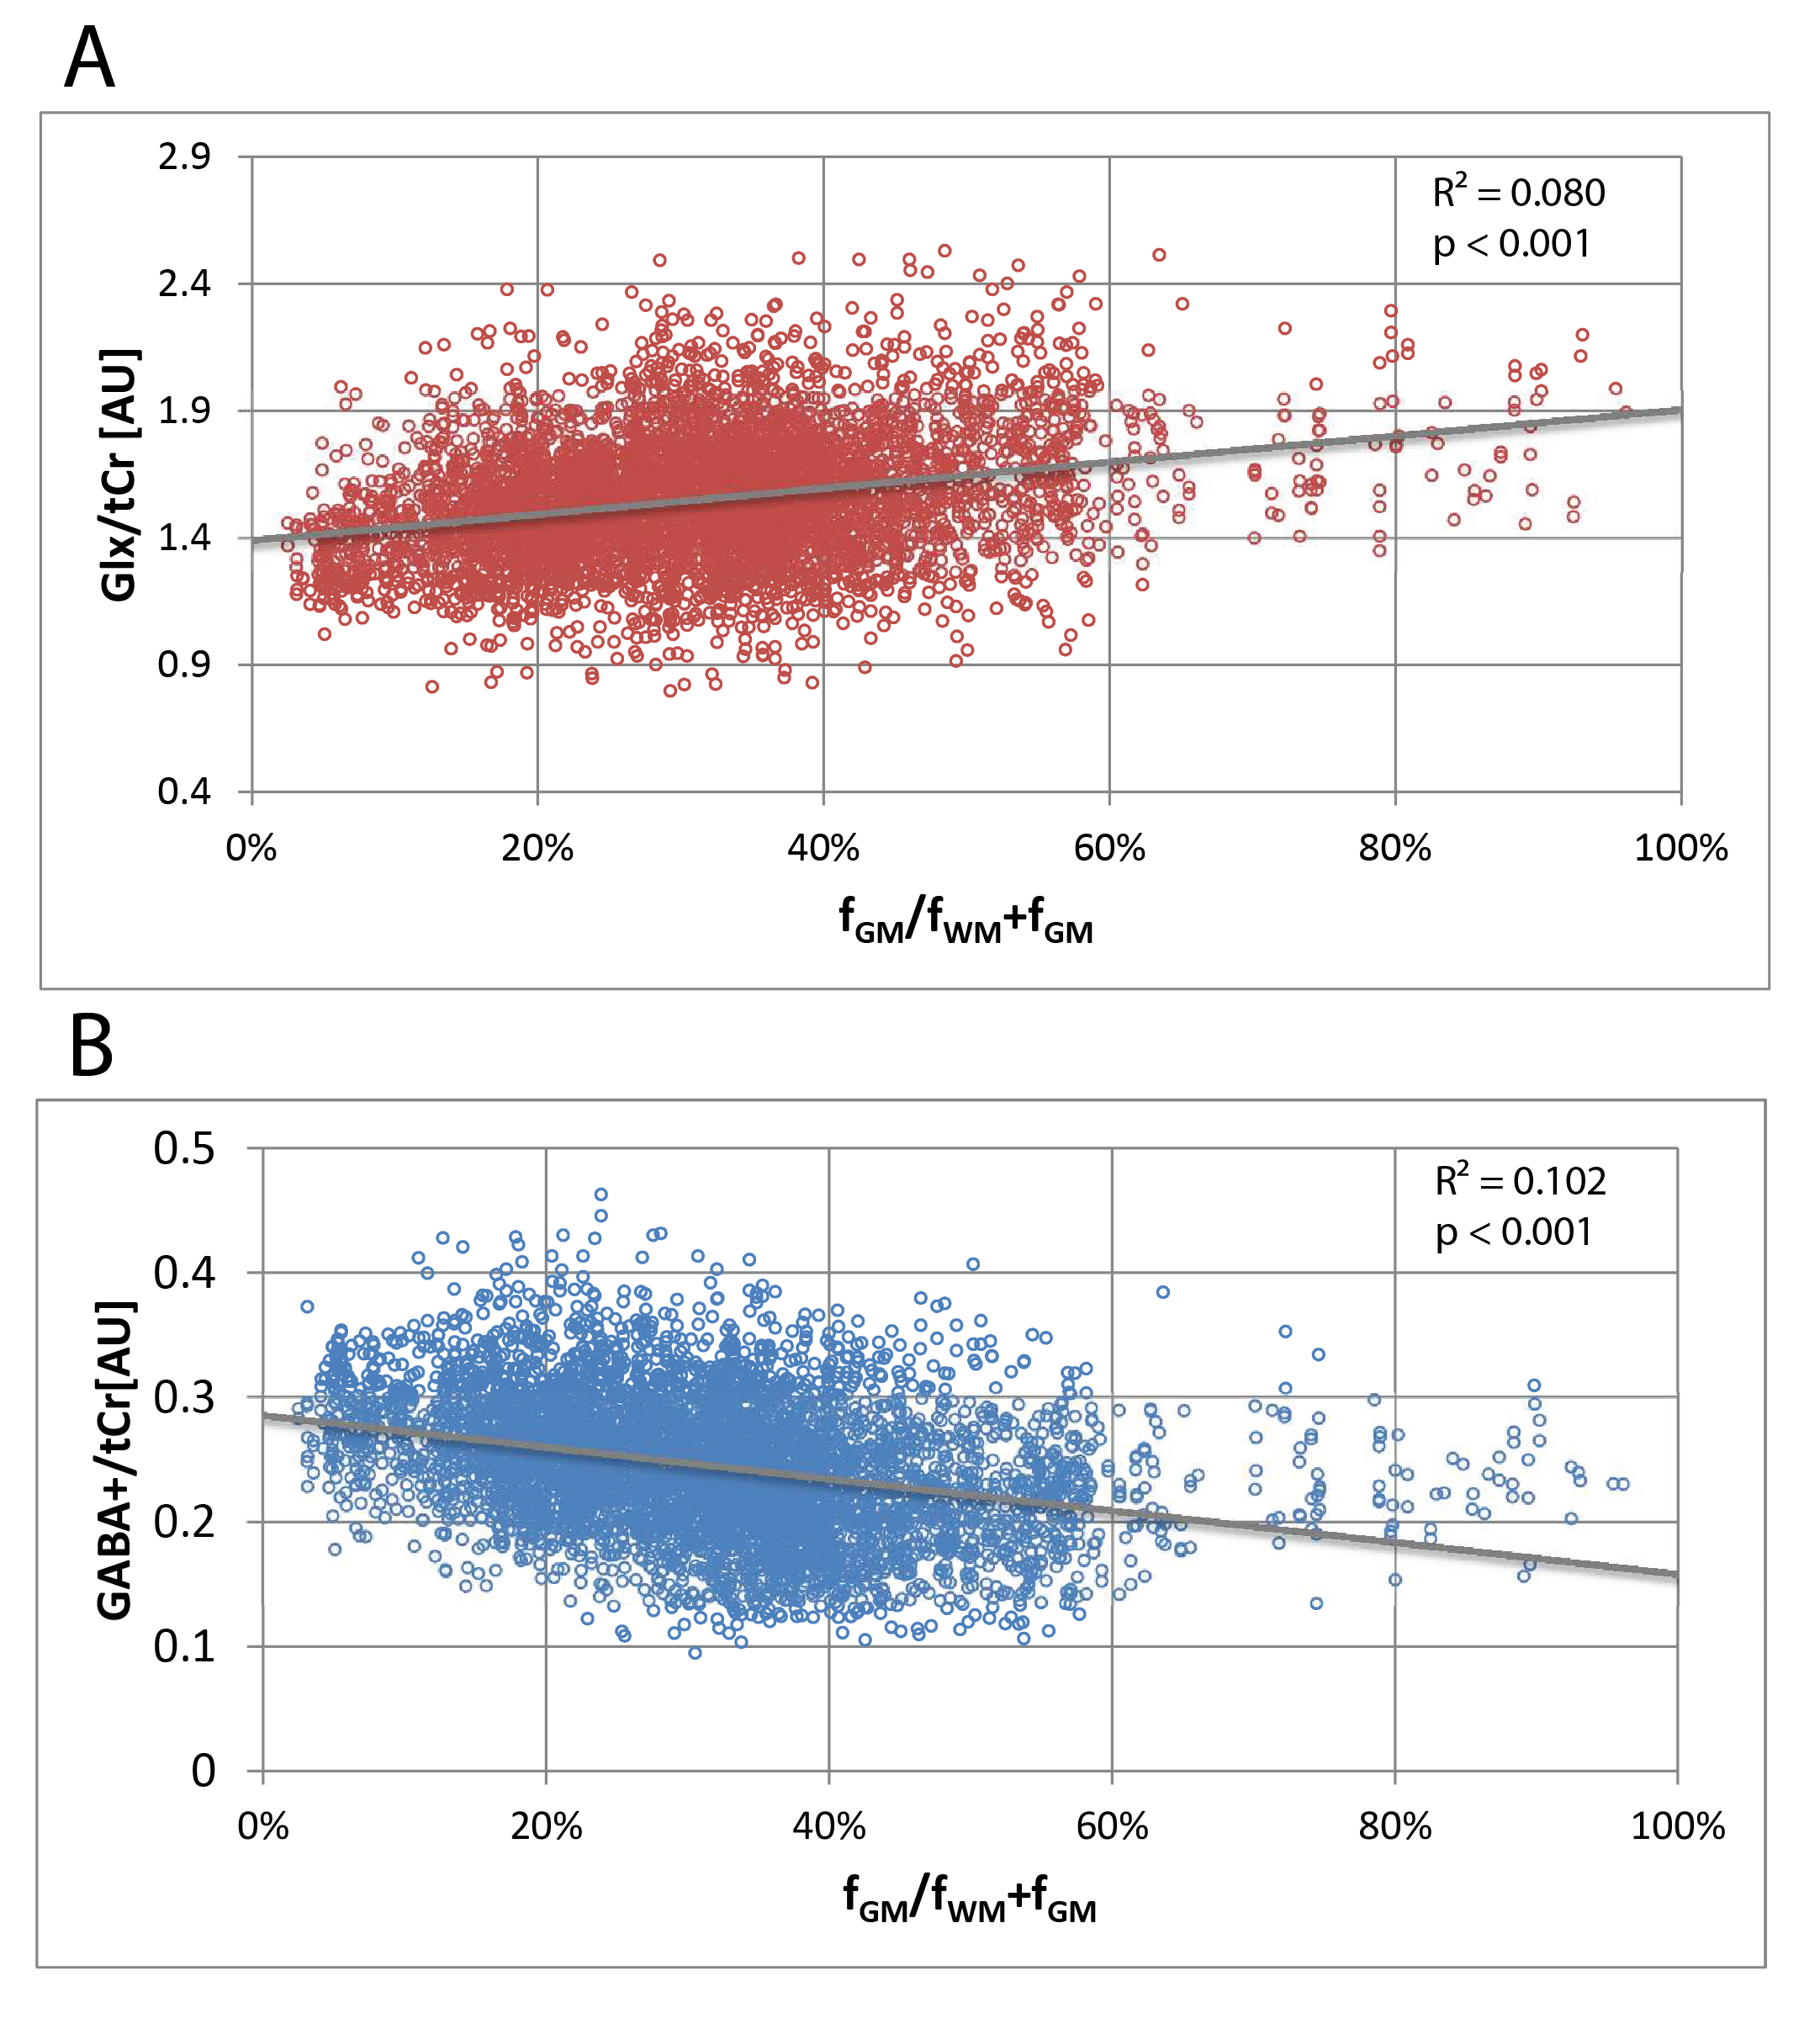
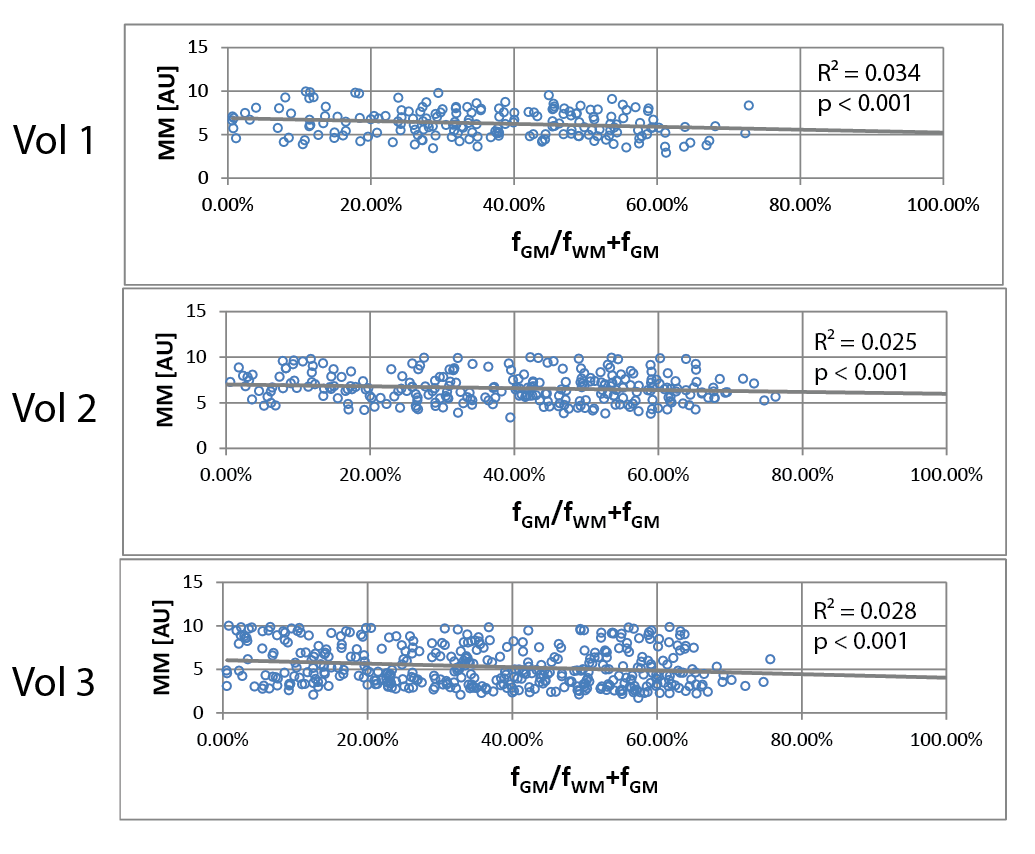
The relative concentration of Glx/tCr (Glutamine+Glutamate/Creatine+Phosphocreatine) was observed higher in pure GM by 26% whereas the GABA+/tCr (GABA+Macromolecules/ Creatine+Phosphocreatine) was higher in pure WM by 45% (Fig.4). We could detect the signal of MM2.99ppm by nulling the signal of metabolites (Fig.1B) as well as map this signal in three-dimensional volume of interest (Fig.3B). MM2.99ppm appears to be higher in average by 24% in pure WM compared with pure GM (Fig.5).Discussion/Conclusion
The observed higher WM GABA+ signal is in contradiction to previous studies5,9,10 (Glx signal on the other hand corresponds to literature). In Zhu et al.10 the ratio of GABA+/water measured by GABA-MRSI was found to be higher in GM. Furthermore elevated GM GABA(+) concentration correspond to GABA physiology5. In our study, the underlying MM signal at 2.99 ppm may partially contribute to the GABA+ concentration discrepancy, as it follows similar trend, however the higher MM in WM is most likely not the only effect. The values from relatively big VOI plotted against the tissue volume fraction may as well contain the effects of anatomical and regional variations of GABA. The signal of total creatine used as an internal reference may also influence the WM/GM differences since Cr concentration is higher in GM (by 45%, data not shown). The findings of this study are by no means final and a more thorough investigation will follow. MEGA-LASER and MEGA-PRESS MM contributions have to be analyzed and compared to clarify the differences with literature. A utilization of more advanced fitting approach (e.g. GANNET) to fit MM peak is desirable. We were able to detect and map the MM resonance at 2.99 ppm that is co-edited with GABA. This MM signal was higher in WM compared with GM. The MM distribution, among other factors, is reflected in the detected GABA+ signal. Therefore, especially in MRSI studies, the detection of GABA is preferable to GABA+ measurement, however the accurate removal of MM is complicated and subject of current research.Acknowledgements
No acknowledgement found.References
1. Mullins, P. G. et al. Current practice in the use of MEGA-PRESS spectroscopy for the detection of GABA. Neuroimage 86, 43–52 (2014).
2. Henry, P. G., Dautry, C., Hantraye, P. & Bloch, G. Brain gaba editing without macromolecule contamination. Magn. Reson. Med. 45, 517–520 (2001).
3. Murdoch, J. B. & Dydak, U. Modeling MEGA-PRESS macromolecules for a better grasp of GABA. Proc. Intl. Soc. Mag. Reson. Med. 19, 1394 (2011).
4. Edden, R. A. E., Puts, N. A. J. & Barker, P. B. Macromolecule-suppressed GABA-edited magnetic resonance spectroscopy at 3T. Magn. Reson. Med. 68, 657–661 (2012).
5. Jensen, J. E., de B. Frederick, B. & Renshaw, P. F. Grey and white matter GABA level differences in the human brain using two-dimensional, J-resolved spectroscopic imaging. NMR Biomed. 18, 570–576 (2005).
6. Považan, M. et al. Parameterization of measured macromolecular background in ultra-short acquisition delay 1H MRSI in the brain at 7T. Proc. Intl. Soc. Mag. Reson. Med. 24, 0024 (2016).
7. Hnilicová, P. et al. Spatial variability and reproducibility of GABA-edited MEGA-LASER 3D-MRSI in the brain at 3 T. NMR Biomed. 1–10 (2016). doi:10.1002/nbm.3613
8. Bogner, W. et al. Real-time motion- and B0-correction for LASER-localized spiral-accelerated 3D-MRSI of the brain at 3T. Neuroimage (2013). doi:10.1016/j.neuroimage.2013.09.034
9. Mikkelsen, M., Singh, K. D., Brealy, J. A., Linden, D. E. J. & Evans, C. J. Quantification of γ-aminobutyric acid (GABA) in 1 H MRS volumes composed heterogeneously of grey and white matter. NMR Biomed. 1644–1655 (2016). doi:10.1002/nbm.3622
10. Zhu, H., Edden, R. A. E., Ouwerkerk, R. & Barker, P. B. High resolution spectroscopic imaging of GABA at 3 Tesla. Magn. Reson. Med. 65, 603–609 (2011).
Figures