1057
A new pulse sequence for single-voxel 1H MRS measurement of cerebral Nicotinamide adenine dinucleotide (NAD+) in humans at 7T using 32-channel volume coil1Department of Rediology, University of Pennsylvania, Philadelphia, PA, United States, 2Research Branch, Sidra Medical and Research Center, Doha, Qatar
Synopsis
Nicotinamide adenine
Introduction
Nicotinamide adenine dinucleotide (NAD+) plays a vital role in the cellular metabolism as a coenzyme for electron transfer enzymes in addition to the reduction-oxidation reactions, in particular, have the involvement of NAD+ and NADH1,2. Thus, in vivo monitoring of NAD+ levels can be used to study the oxidative stress levels related to various physiological conditions. Currently, the in vivo detection of NAD species (NAD++NADH) is performed mostly via 31P MR spectroscopy. However, 31P MRS is limited by lower spectral resolution, making it difficult to resolve the oxidized and reduced forms of NAD species3. Very recently, 1H MR spectroscopy in a slice using a surface coil has been shown to detect NAD+ in the brain4,5. In the current study, we present a new sequence and method to detect single voxel localized 1H MRS detection of NAD+ from the human brain at 7T using a volume coil. The initial results are presented.Materials and Methods
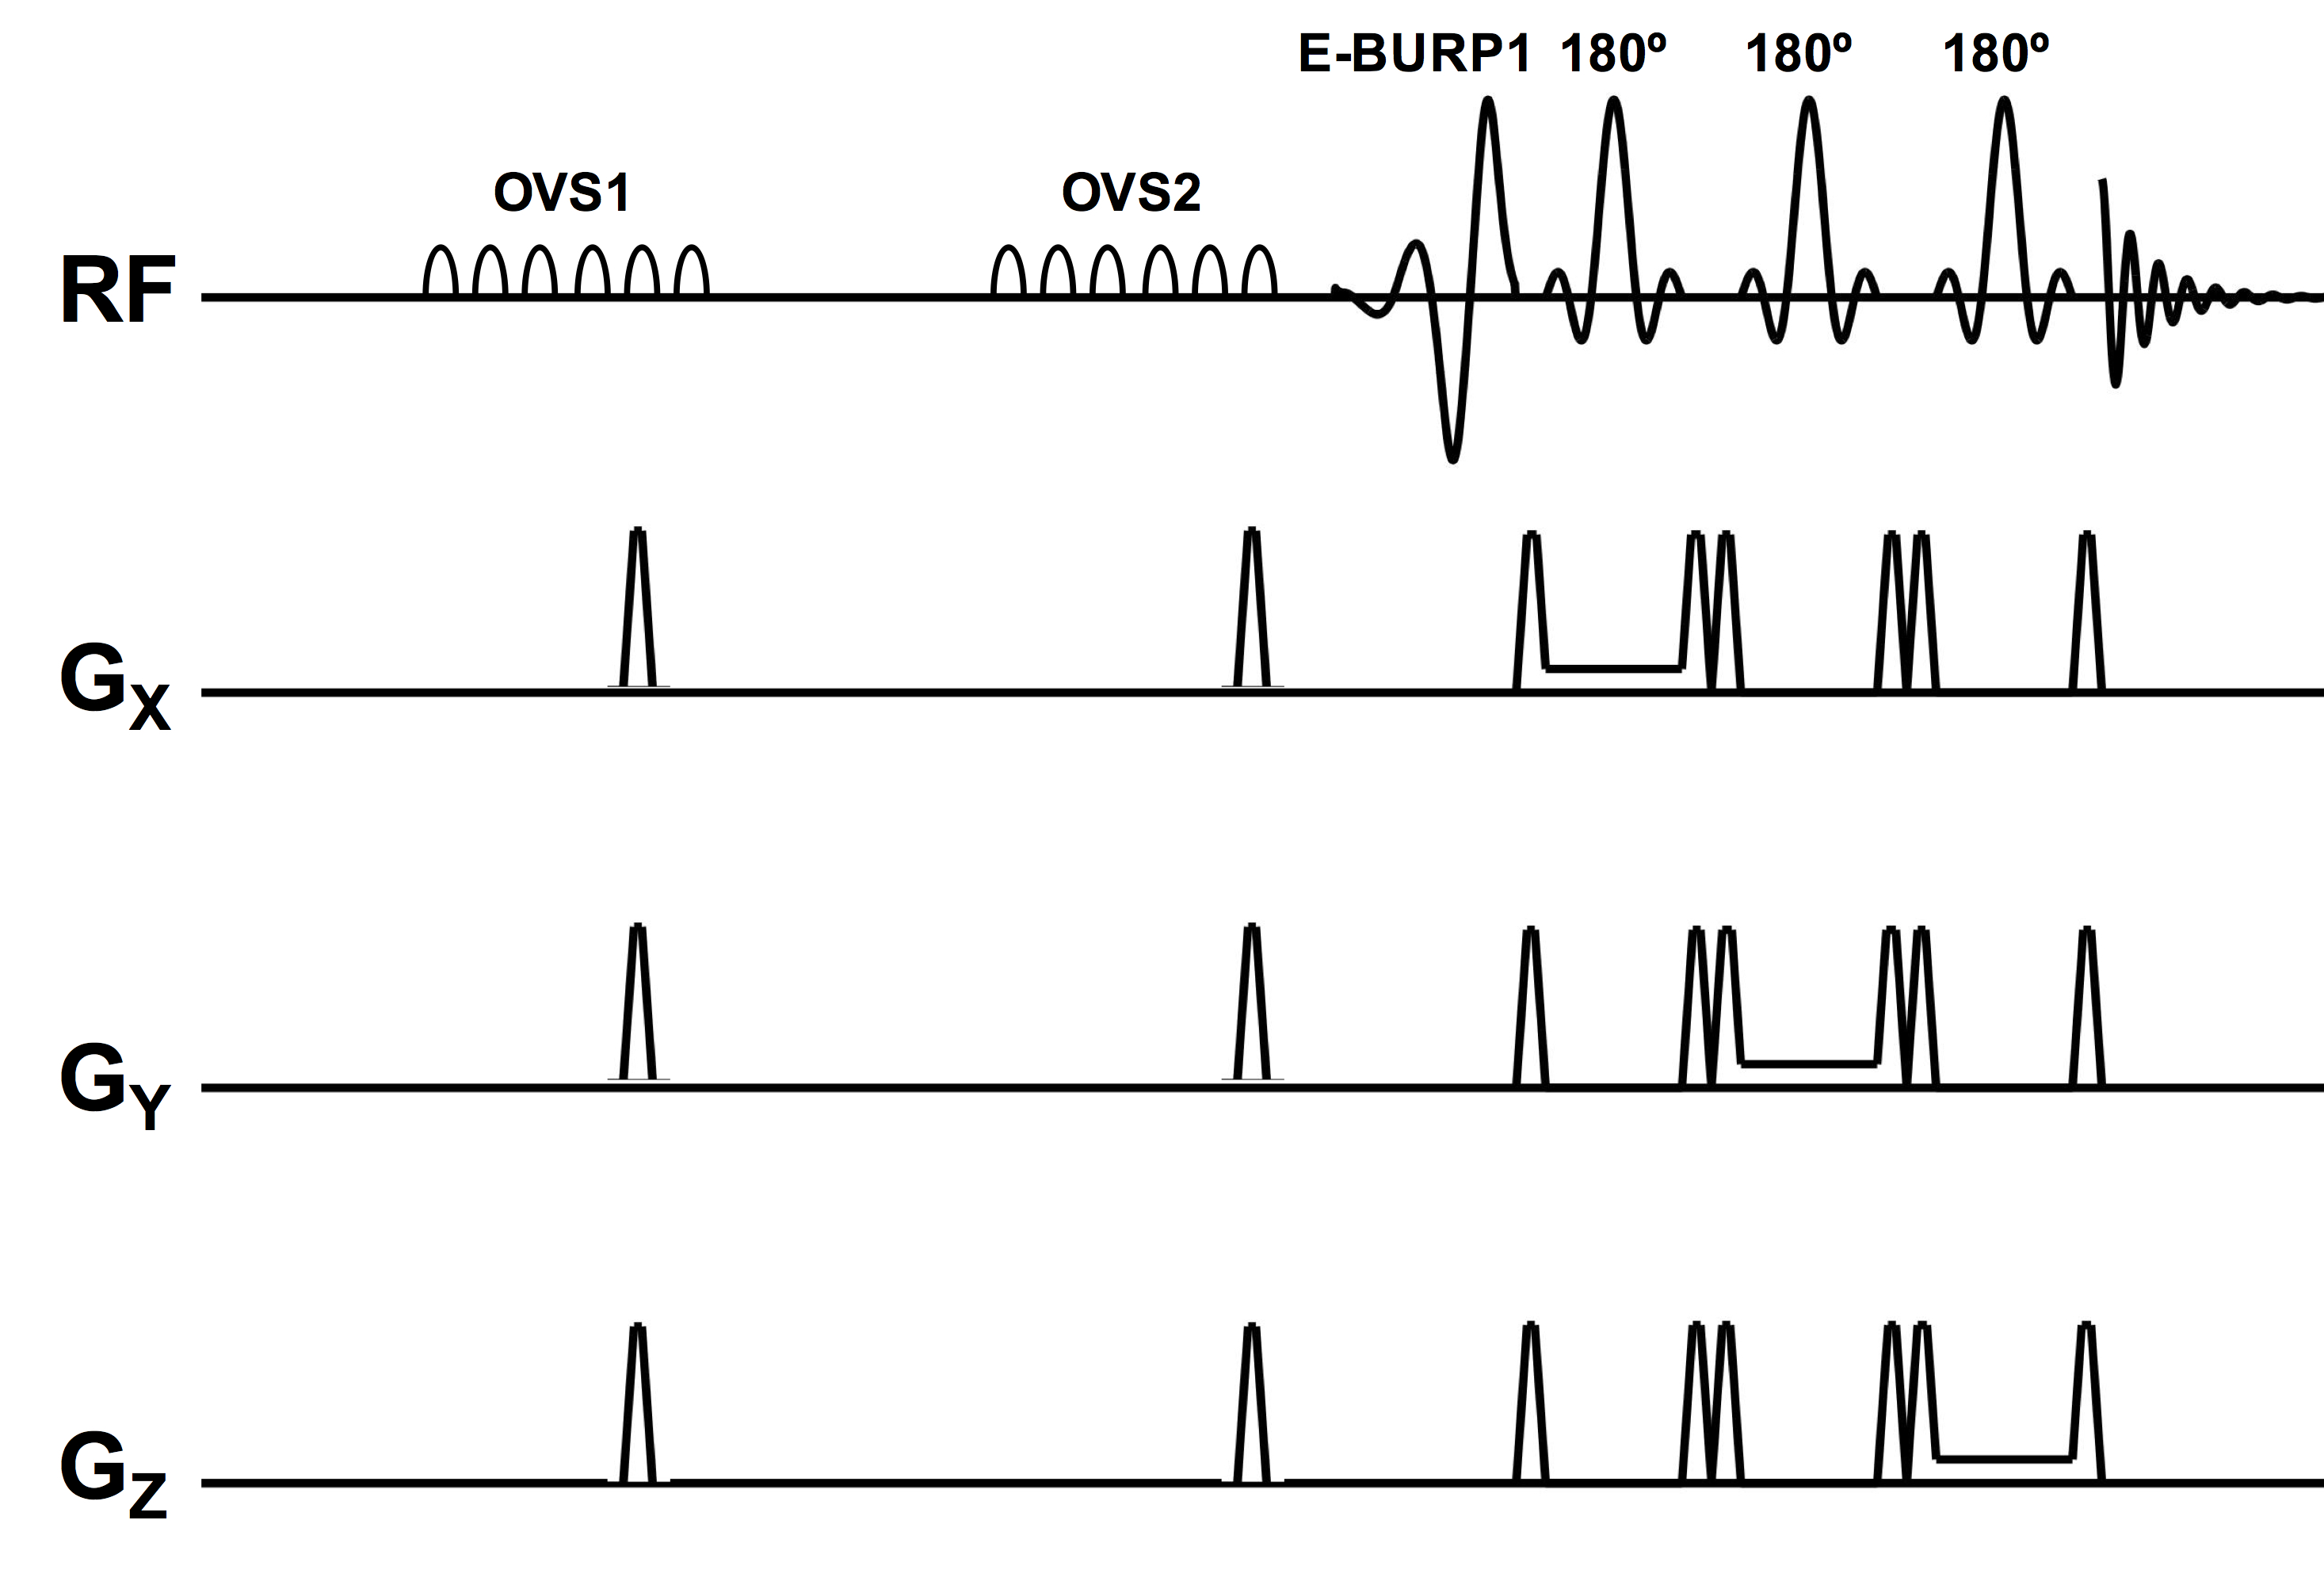
Pulse Design: The pulse sequence uses two outer volume suppression (OVS) blocks with 6 saturation pulses separated by 30 ms with spatial bandwidth 10cm and a gap of 2cm around all the three dimensions of the MRS voxel. This is followed by a spectrally selective self-refocused E-BURP1 90° pulse and 3 narrow-band (800Hz) spatially selective refocusing 180° Shinnar-Le Roux pulses for localization6 (Fig. 1). The 90° pulse is 7ms long and bandwidth 2 ppm (600Hz at 7T). The spectrally selective pulse and the 180° pulses are centered at 9.1 ppm for NAD and 4.7 ppm for water. Refocusing pulses that are spatially selective for localization are based on Shinnar-Le Roux pulse design and are 3.2ms long with a bandwidth of 800 Hz giving an overall TE of 19.3ms.
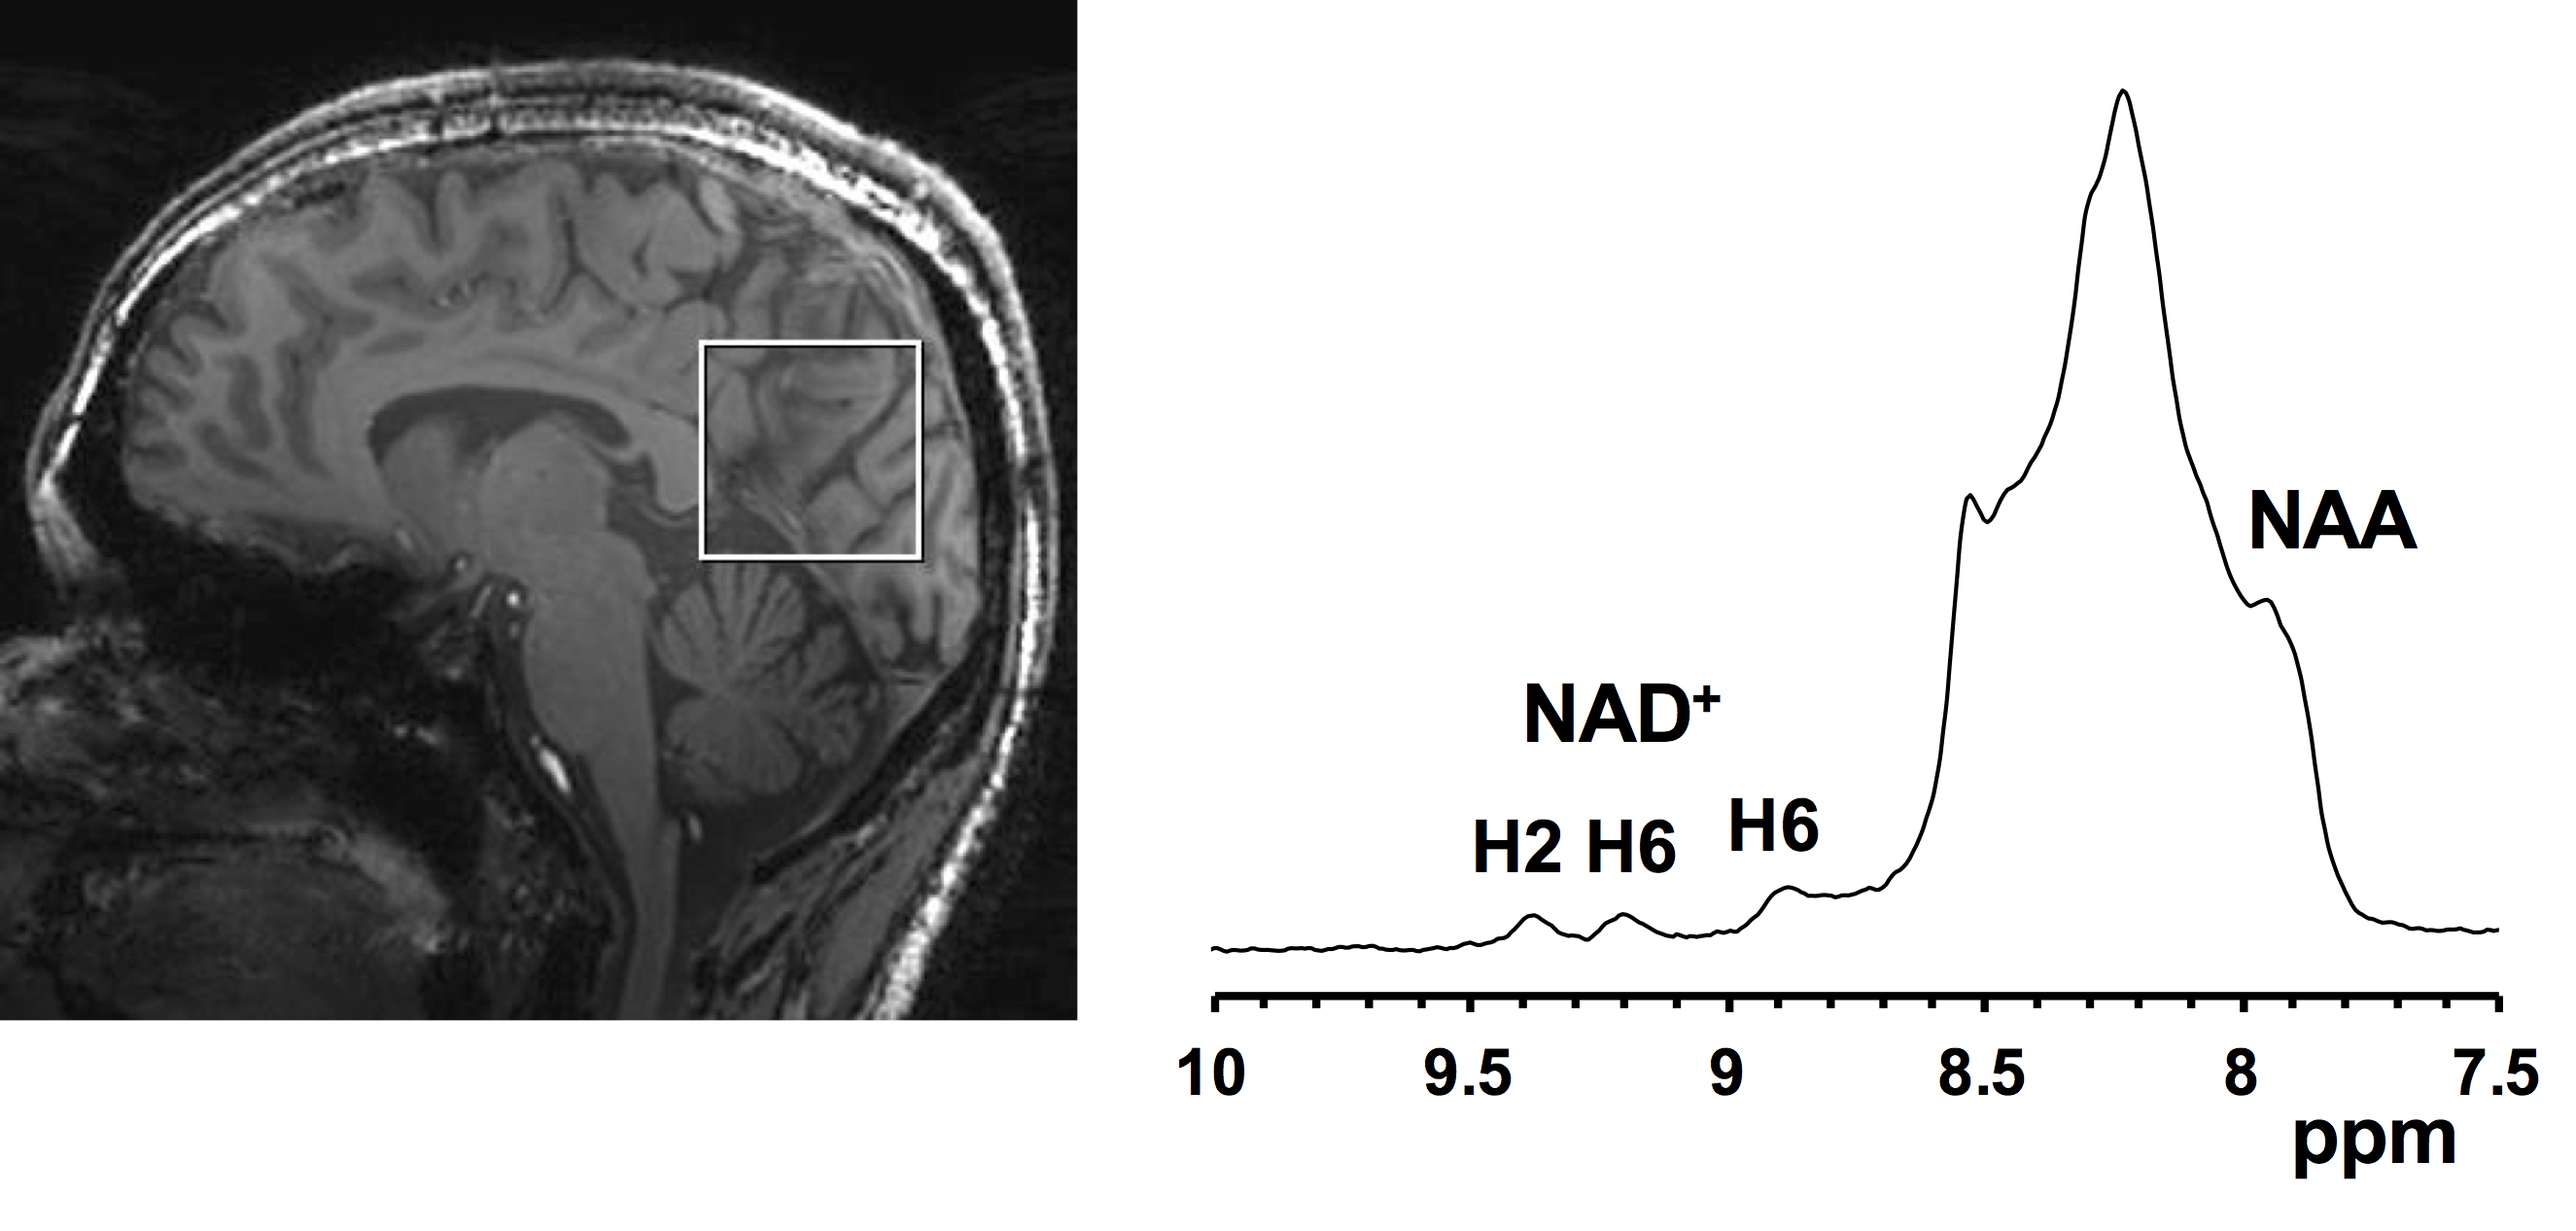
Acquisition: All the human studies were conducted under an approved Institutional Review Board protocol of the University of Pennsylvania on 7T Siemens scanner with a 32-channel phased-array head coil from healthy human brains. Five healthy subjects with mean age 43.2±13.6 yrs were scanned. T1-weighted anatomical three-dimensional (3D) magnetization-prepared rapid gradient echo (MPRAGE) images of whole brain were acquired using parameters: 176 axial slices, repetition time/echo time/inversion time (TR/TE/TI) = 2800/4.4/1500 ms, α = 7°, 0.8×0.8×0.8 mm3 resolution, iPAT=2, scan time 7:43 min. A voxel of 40×40×40 mm3 was placed in the parietal lobe of the head as shown in Fig. 2a. Water reference acquisitions were done with TR = 8s and 4 avgs and NAD+ acquisitions were done with TR=1s and 512 avgs.
Data Processing: Raw multi-channel time domain data from the scanner without any coil combination or signal averaging was used for post processing. Water data was used for channel wide eddy current calculations, channel selection and combination. From the water raw data, only channels with enough signal (5% of the signal from the channel with maximum signal) were selected, eddy current compensation applied and channels are combined to generate a water FID. Reference water spectrum was obtained by the Fourier transform of the water FID. The real part of this spectrum was fully phased and curve fitted. For generating the NAD+ spectrum, 16 averages in each block were used for block averaging and each block spectrum was eddy current corrected and channel combined, Fourier transformed, spectral frequency aligned and phase corrected using the position and phase of the broad NAA amide/unassigned purine nucleotide signal between 7.7 and 8.7 ppm. The final NAD+ spectrum was produced as the sum of all the individual blocks. For NAD+ quantification, the spectrum in the range of 9 to 9.5 ppm was fitted to a sum of 2 Lorentzians, and from the integral of the 9.34 ppm peak, NAD+ concentration was calculated by normalization with the water integral (assuming 80% water content in the brain).
Results and Discussion
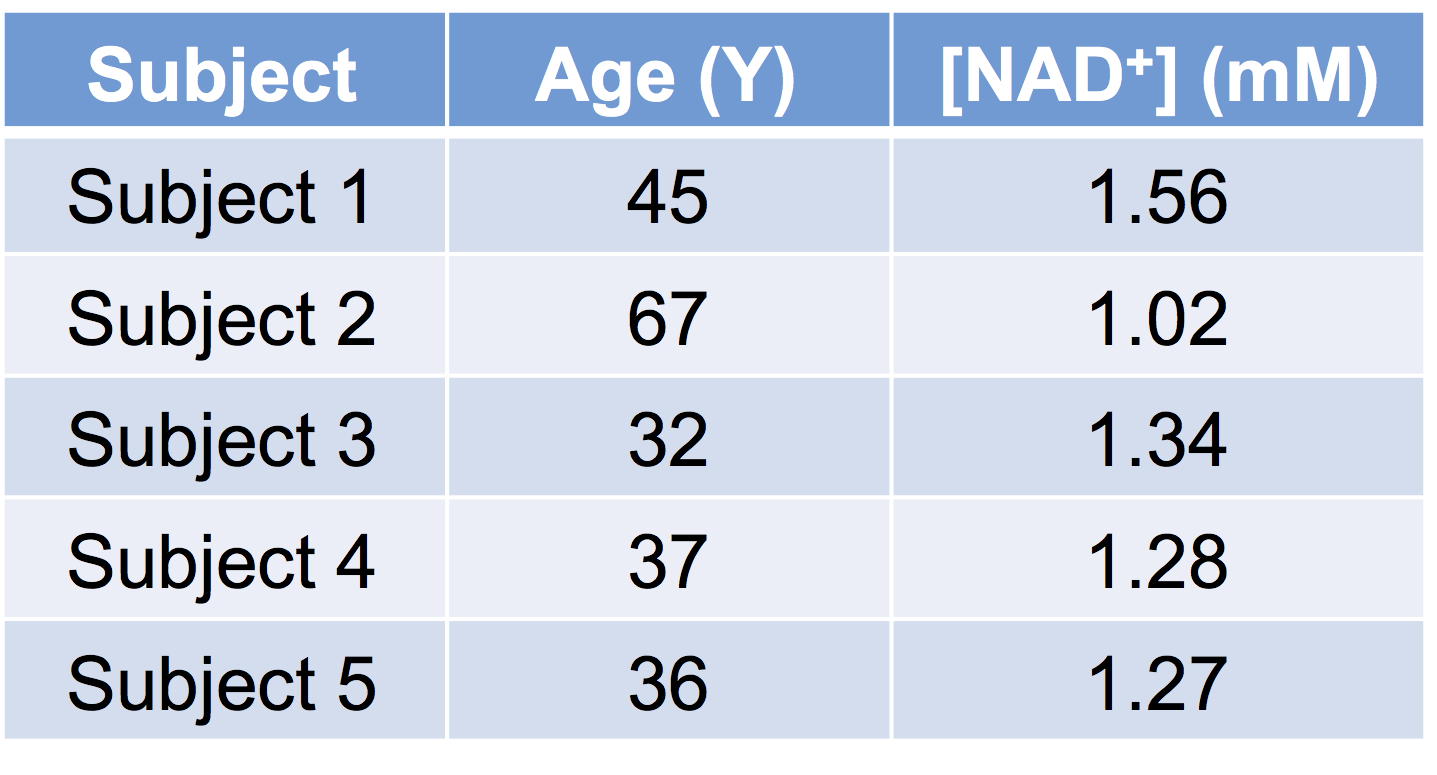
Fig. 2b shows the downfield region of a 1H MR spectrum acquired from human brain at 7T. Downfield to the NAA amide-bound proton signal at 7.9 ppm and multiple, unassigned signals from purine nucleotides between 8.0 and 8.6 ppm, three clear resonances at 8.8, 9.1 and 9.35 ppm. The non-overlapping NAD+ H2 resonance at 9.35 ppm was quantified. Table 1 shows the concentration of NAD+ in the parietal lobe of five healthy subjects. The average level of NAD+ in the human brain was quantified to be 1.29±0.19 mM. The measured cerebral NAD+ concentrations are higher than previously reported (~0.3 mM) in the literature3,4,5 and this discrepancy is currently under investigation.Acknowledgements
This project was supported by the National Institute of Biomedical Imaging and Bioengineering of the National Institutes of Health through Grant Number P41-EB015893 and the National Institute of Neurological Disorders and Stroke through Award Number R01NS087516.References
1. Stein LR and Imai S Trends Endocrinol Metab (2012) 23:420-38; 2. Bai P and Canto C Cell Metab (2012) 16:290-95; 3. Lu M et al Magn Res Med (2014) 71:1959-72; 4. de Graaf RA and Behar KL NMR Biomed (2014) 27:802-09; 5. de Graaf RA et al Magn Reson Med (2016) DOI:10.1002/mrm.26465; 6. Geen H and Freeman R J Magn Reson (1991) 93:93-141Figures