1052
Combined Transmit Array and 8-channel Receive Coil Array for 19F/1H for Human Lung Imaging at 1.5 T Utilizing MEMS Transmit-receive Detuning1Unit of Academic Radiology, University of Sheffield, Sheffield, United Kingdom, 2GE Healthcare Inc., Aurora, OH, United States
Synopsis
MRI of inert fluorinated gases is a developing method for pulmonary ventilation imaging, but image quality is constrained by low spin density. Additionally, proton imaging is desirable for complementary structural information from the lungs. Here, an 8-element transmit/receive coil array for 1.5 T is presented, which is capable of imaging both 19F and 1H nuclei with higher SNR when compared to single-element alternatives. Microelectromechanical systems (MEMS) switches are utilized to provide broadband transmit-receive isolation over the frequency range of both nuclei. Coil channel isolation is demonstrated and MEMS switching performance with phantom imaging of both nuclei.
Background
Imaging 19F gases in the lungs is challenging because of low spin density1, so to facilitate the acquisition of high resolution images a receive array is advantageous. The combination of a birdcage coil and receive array has its limitations since a body sized birdcage coil strongly couples to the 1H body coil, restricts movement in the bore and increases patient set-up times. Microelectromechanical systems (MEMS) have been proposed as a method for decoupling coils with a number of advantages (e.g. broadband operation, low DC power, fast switching) over the strategy of utilizing tank/trap circuits enabled by pin diodes2.Purpose
To develop a combined fixed phase and amplitude transmit array and 8-element receive array for 19F lung MRI at 1.5 T. The coil is optimized for 19F and realized with individual transmit-receive switches using MEMS switches for broadband decoupling so the coil may be used concurrently for 1H imaging.Methods
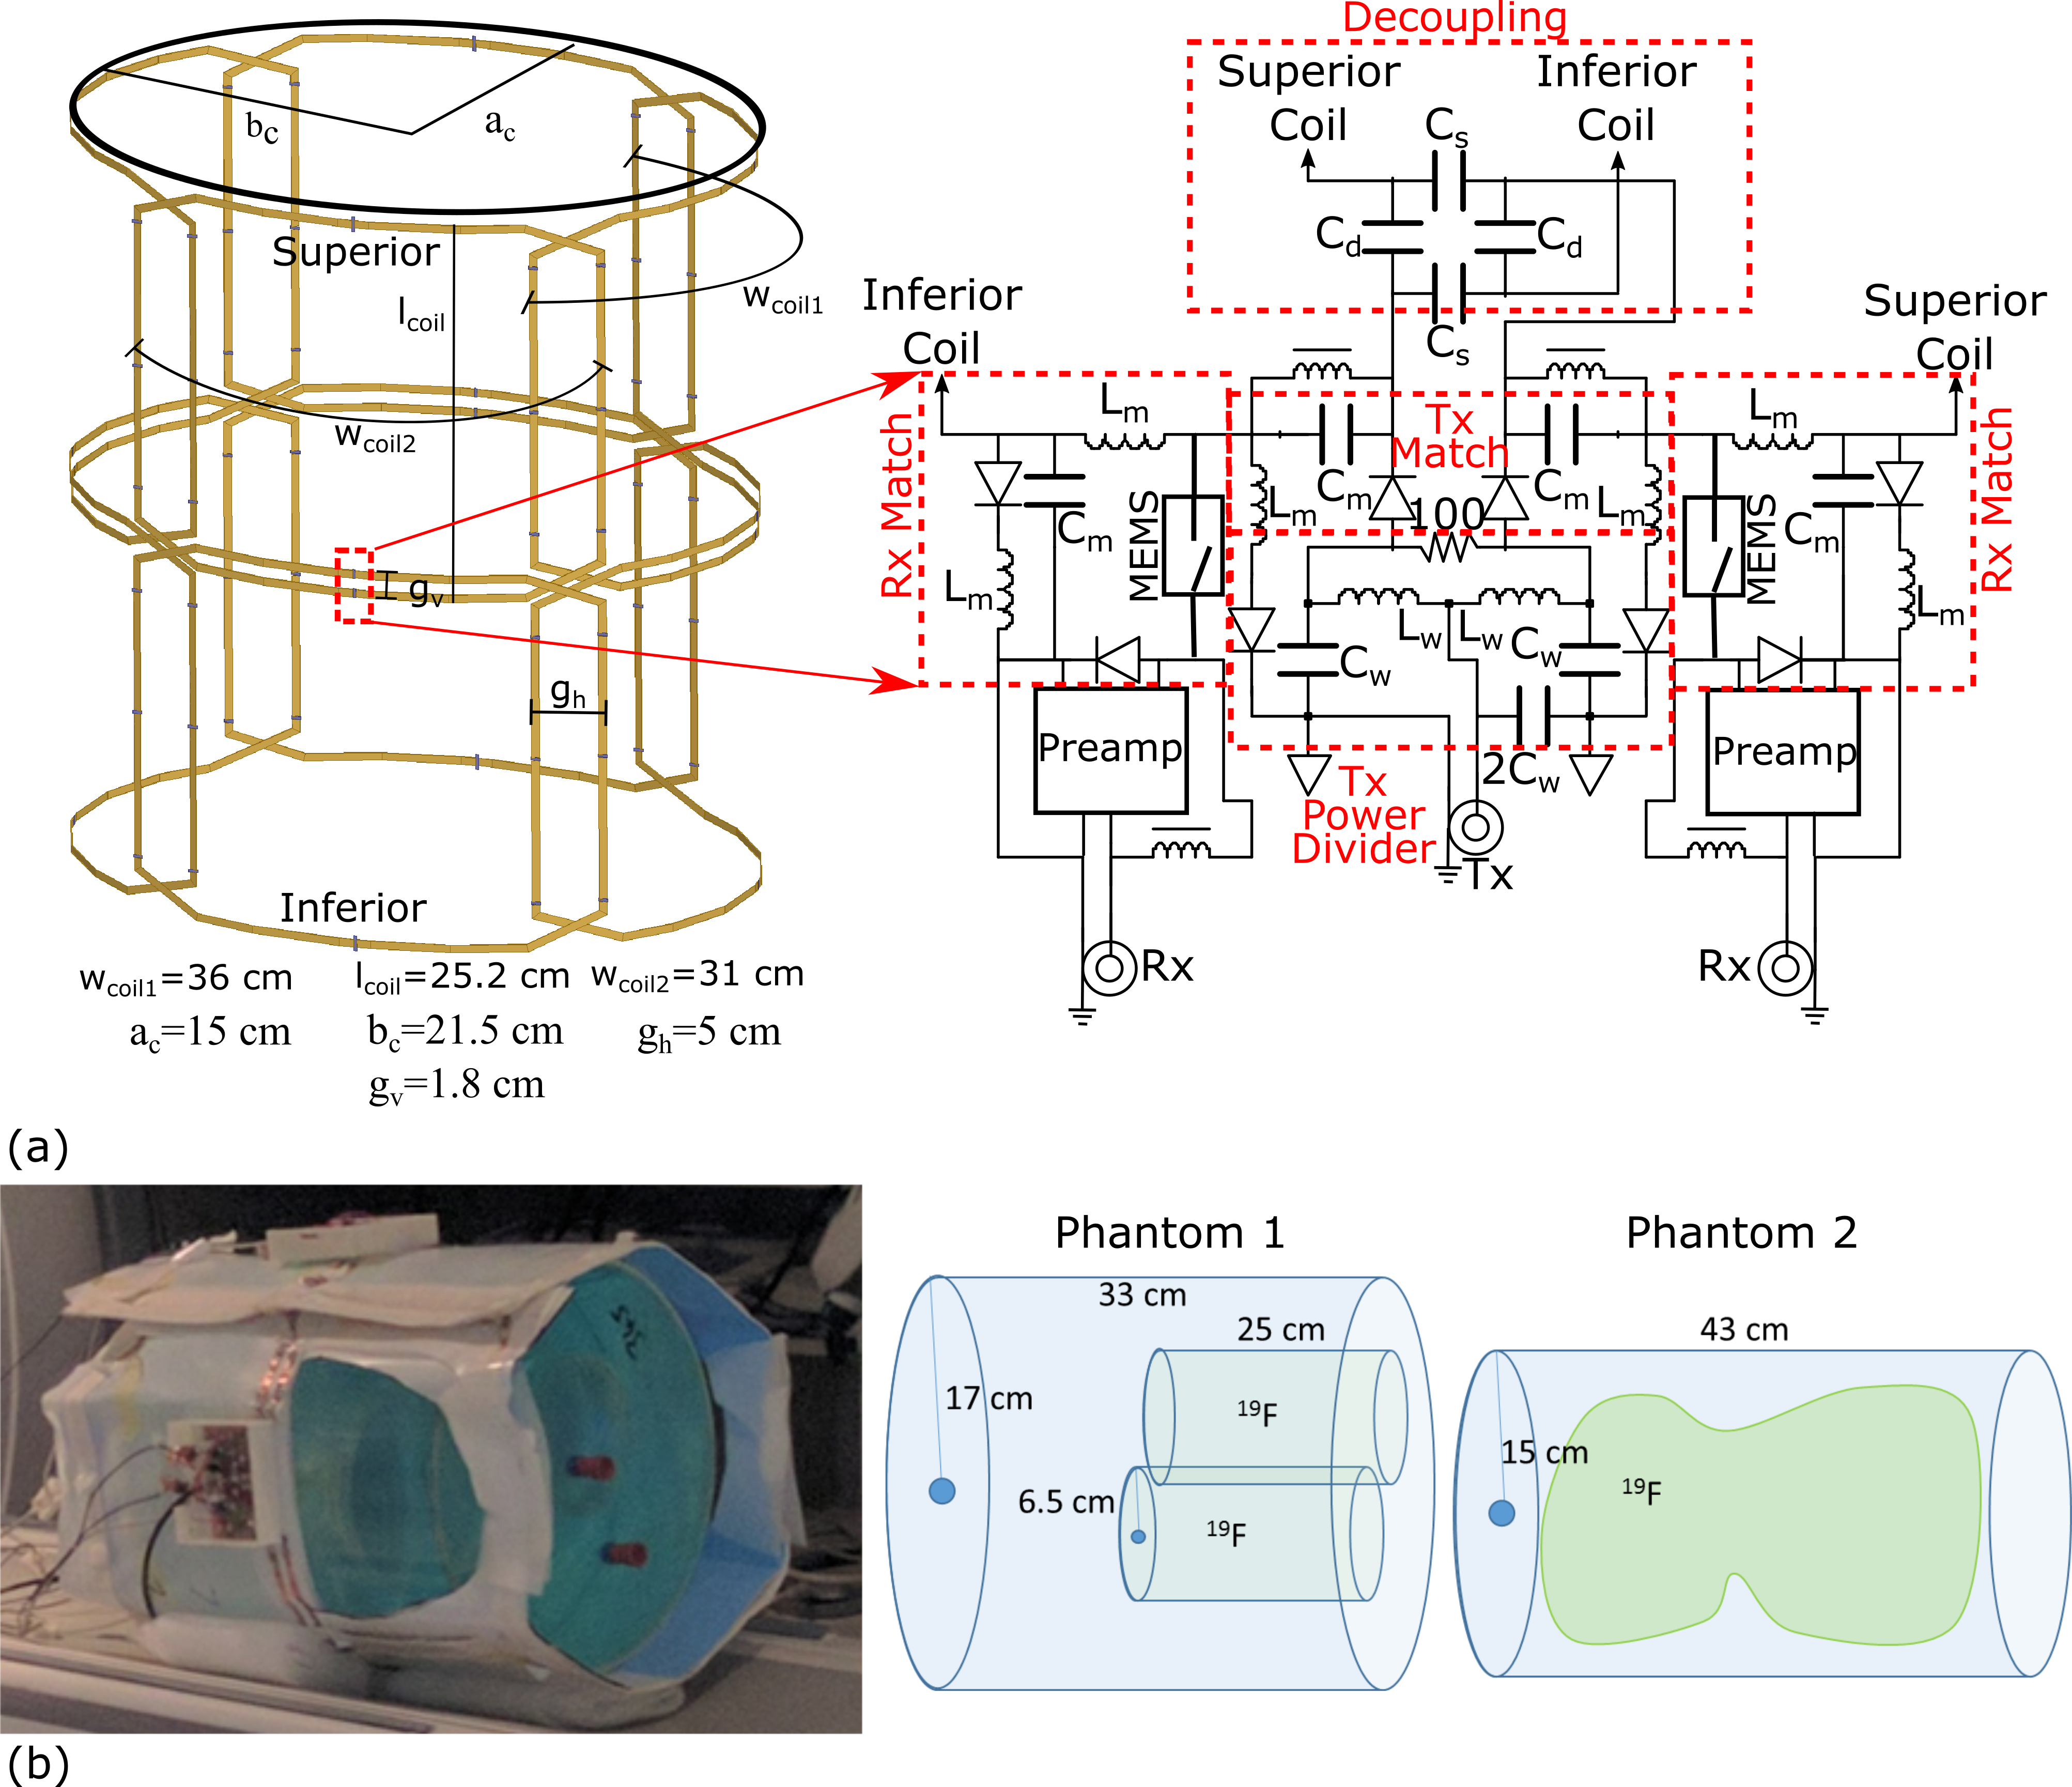
The 8-element coil array simulation model and radiofrequency (RF) matching and decoupling circuitry is shown in Figure 1(a). Photograph of the setup on the scanner and diagrams of phantoms used are shown in Figure 1(b). The coil dimensions conform to an average adult human chest dimensions. The array was constructed with copper tape (5mm width) on a Teflon substrate. Adjacent coils had critical overlap gap, while capacitive decoupling3 decoupled superior-inferior pairs. Additional decoupling in reception was provided by the low input impedance preamplifiers (1.5Ω)4. The transmit power delivered to four coil pairs was split equally using lumped element hybrid couplers. A driver network converted the coil bias signal to the VDD (82 V) required for switching MEMS. Matching and decoupling between coils was measured with coil preamplifiers disconnected and detuning of Rx and Tx ports with preamplifiers operational. The operational consistency of MEMS switching was demonstrated using a test circuit consisting of a bias signal emulating system default signals, the MEMS driver and a RF source.
Phantoms were used to emulate the human lungs (tissue and air space) made up of a 3.6g/ℓ NaCl and 1.96g/ℓ CuSO4⋅5H2O solution and inner container filled with C3F8 mixed with 20% O2. One of the phantoms used has two insertable 2ℓ containers, while the other contains a 12ℓ bag filled with perfluoropropane gas.
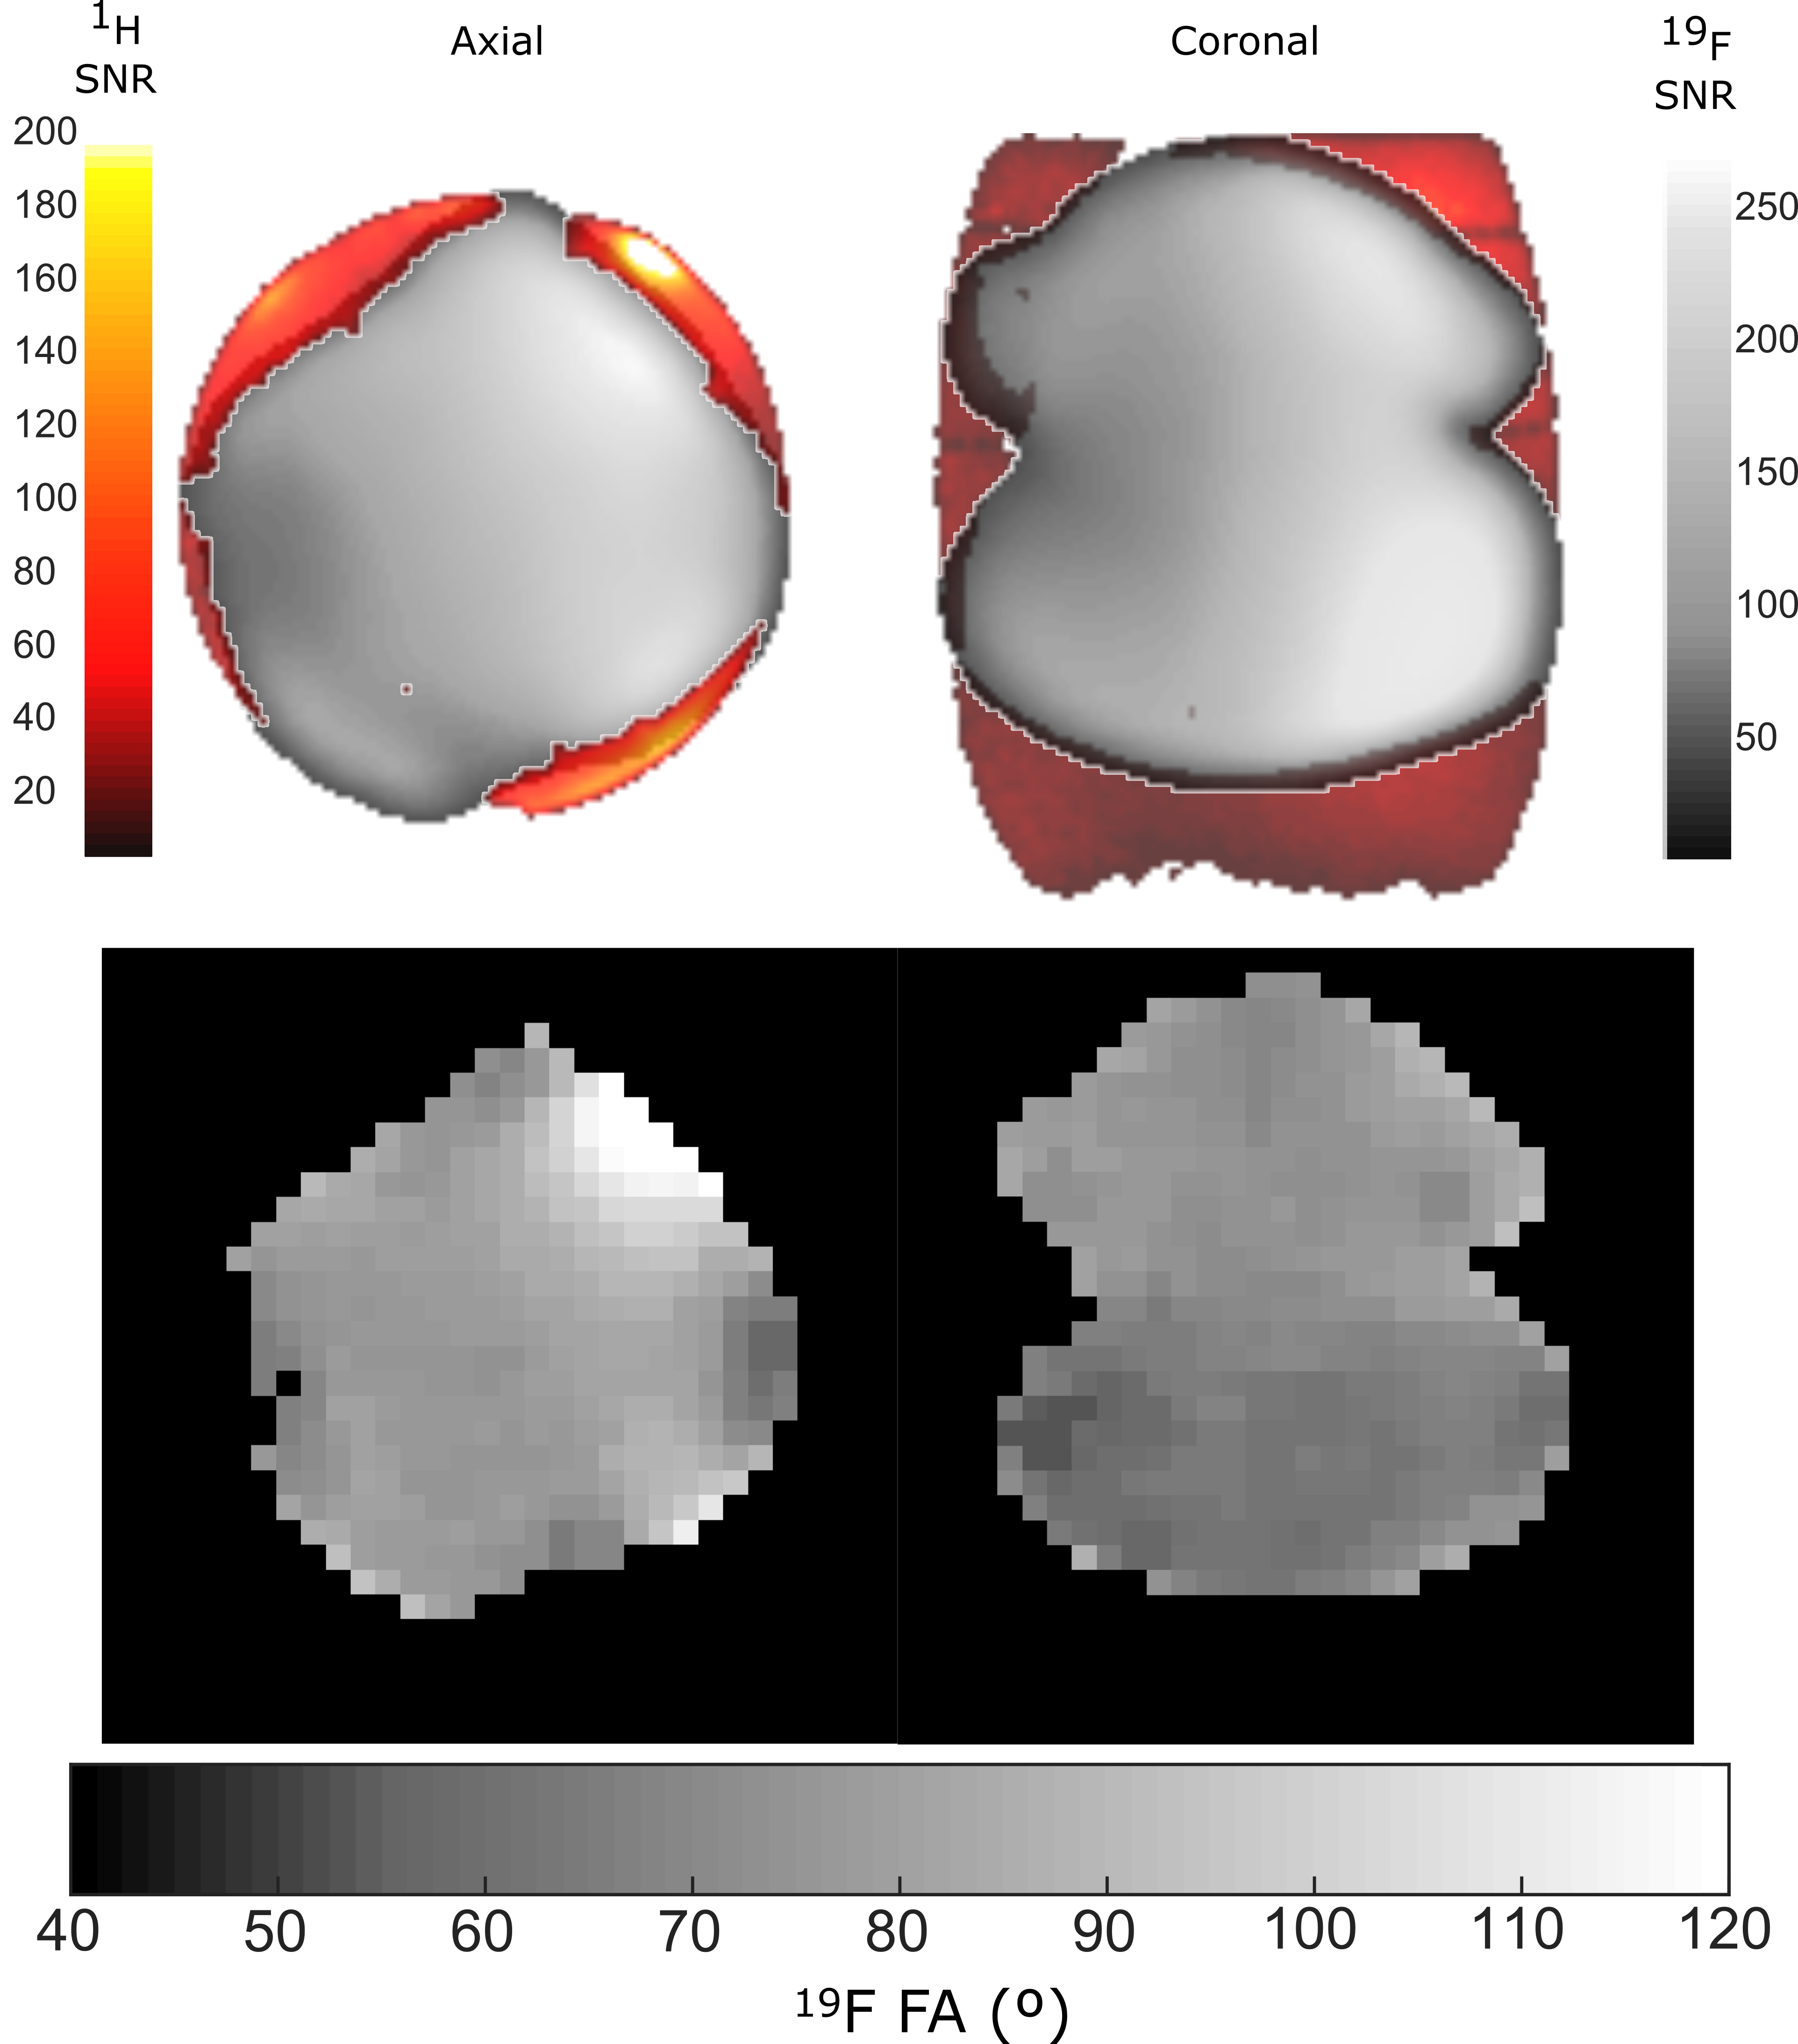
Flip angle (FA) maps were generated by repeated imaging using a gradient echo pulse sequence (2kW peak power, 32×32 resolution, TE=2.2ms, TR=80ms, bandwidth=15.6kHz, 40cm field of view, 100mm slice thickness and 20 averages) with a linearly varying RF transmit power, then curve fitting signal intensity according to a sinusoidal function. SNR and FA maps presented are with maximum power input. Proton images are obtained using a similar sequence (160W peak power, 128×128 resolution, TE=4.5ms, TR=20ms, bandwidth=15.6kHz, 40cm field of view, 10mm slice thickness and 1 average). Sensitivity maps of the individual channels and noise correlations were used to optimally reconstruct the images5.
Results
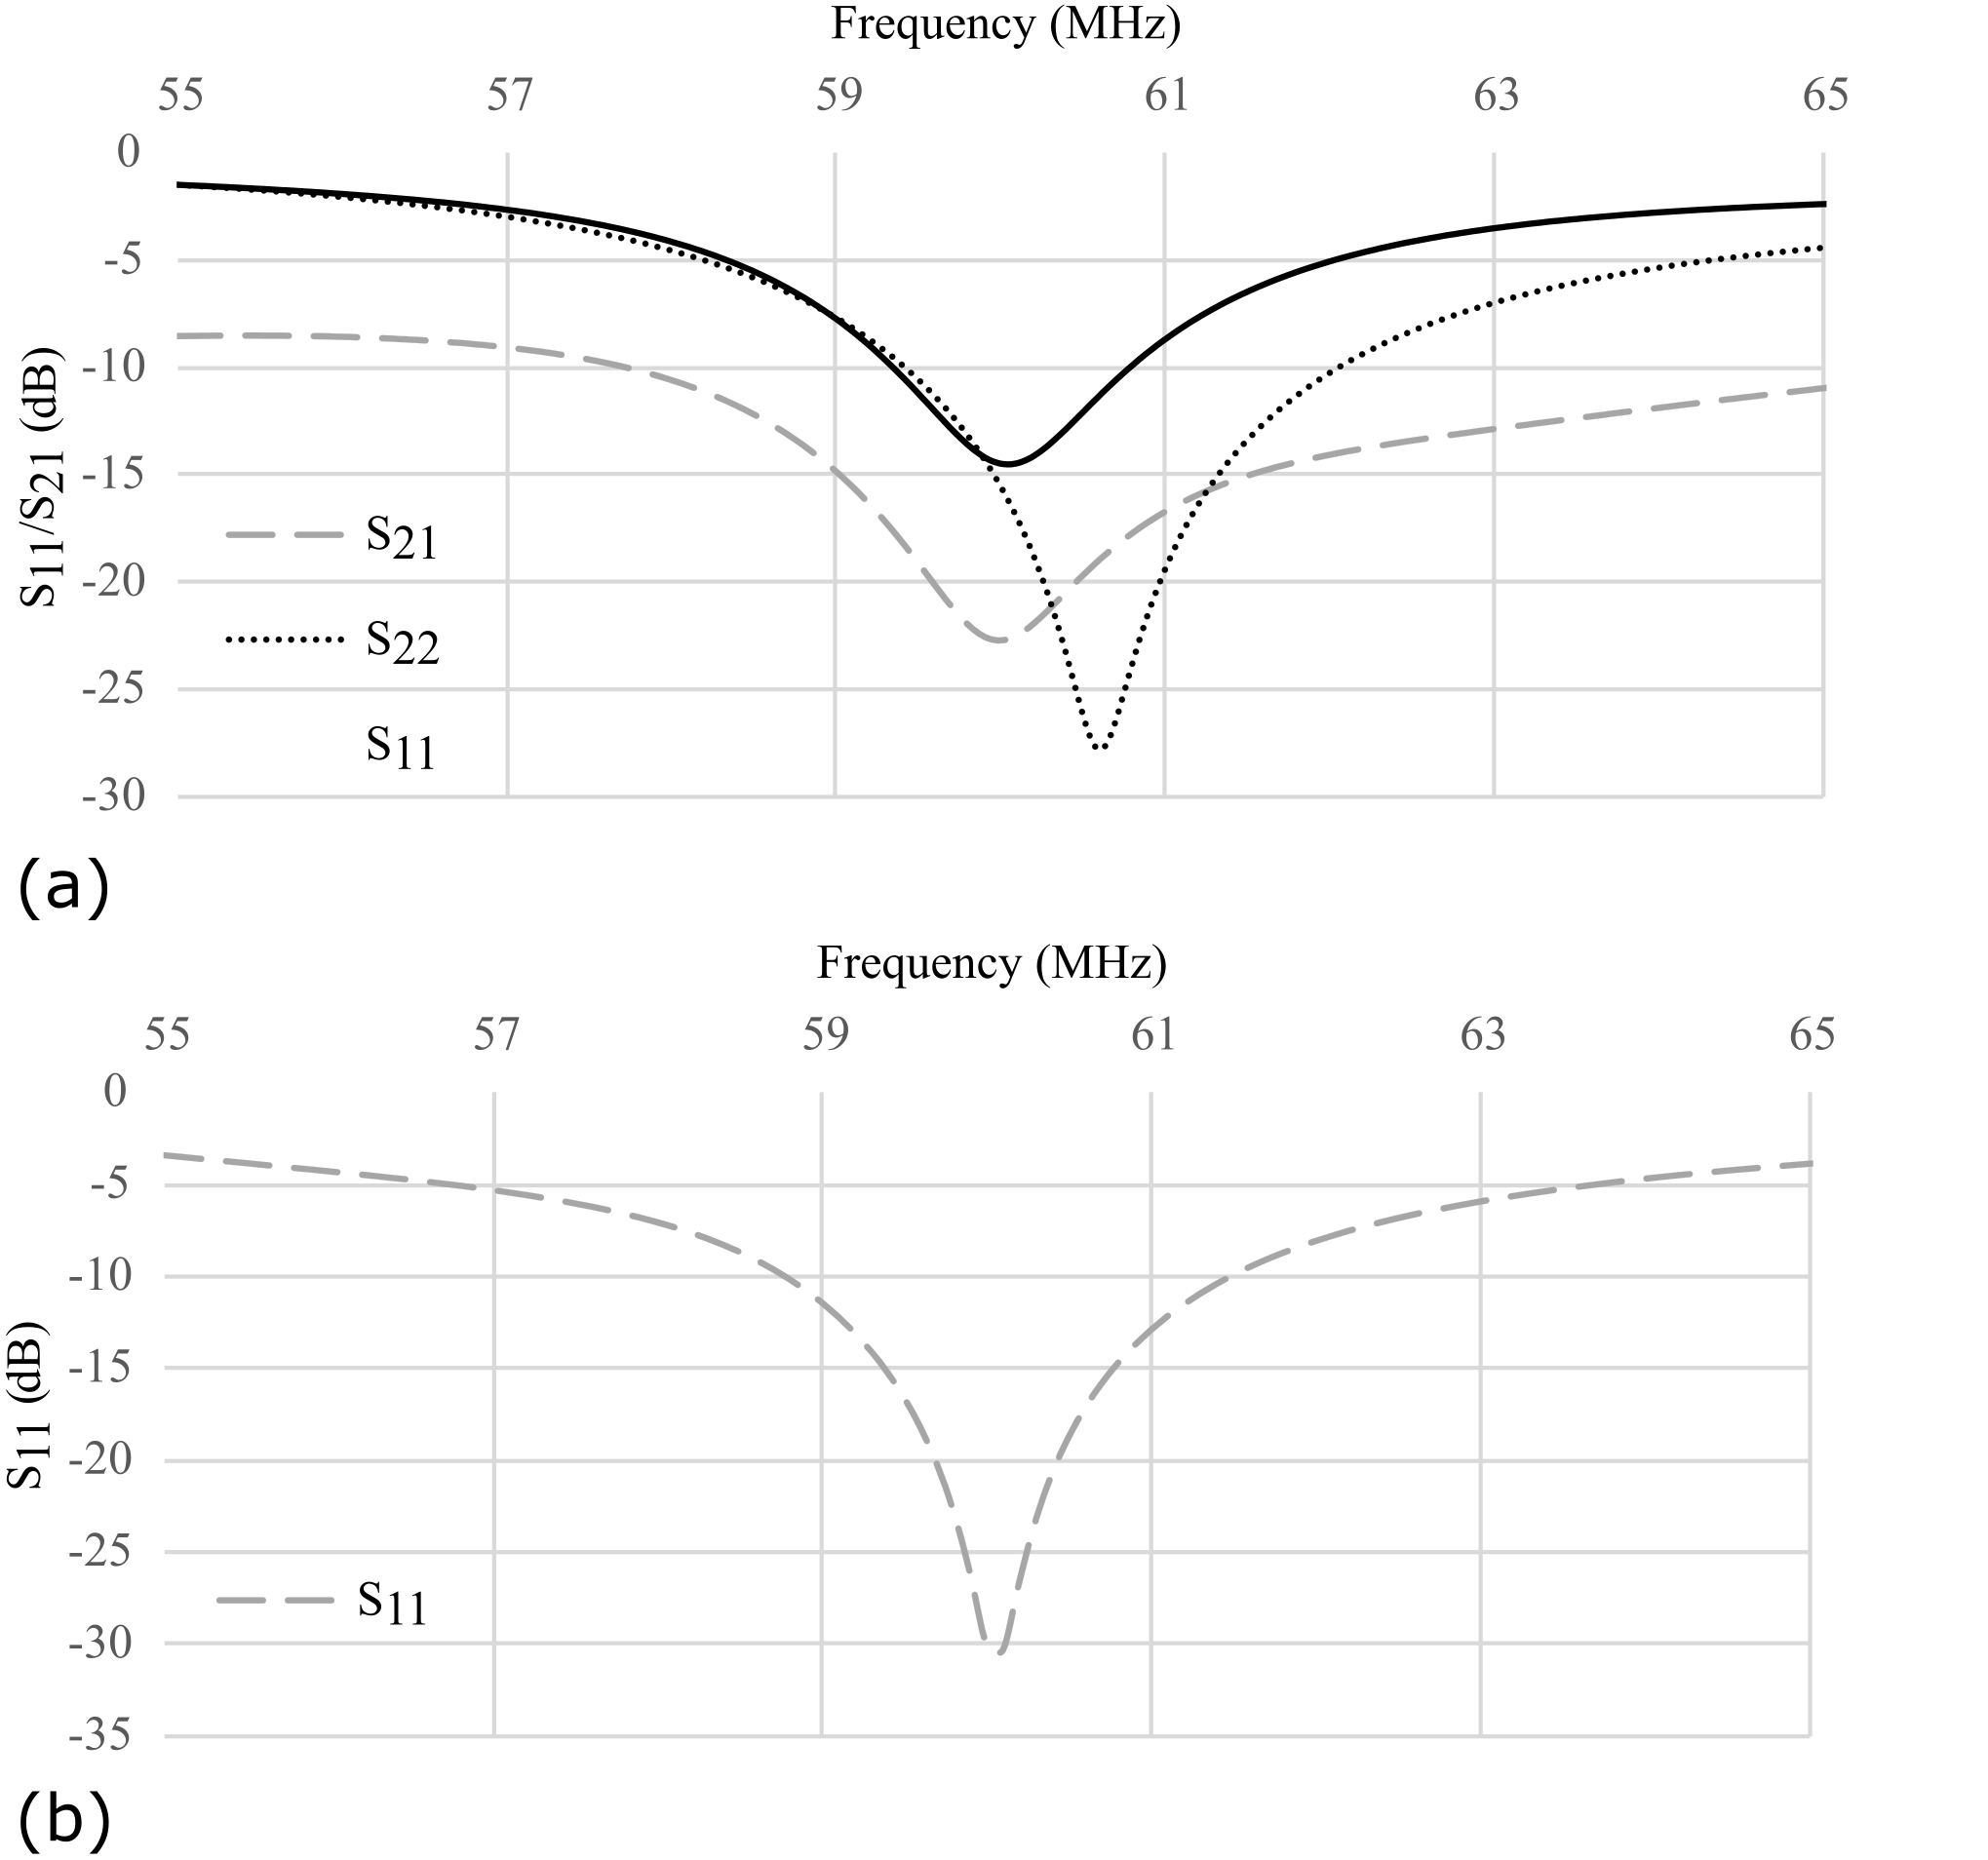
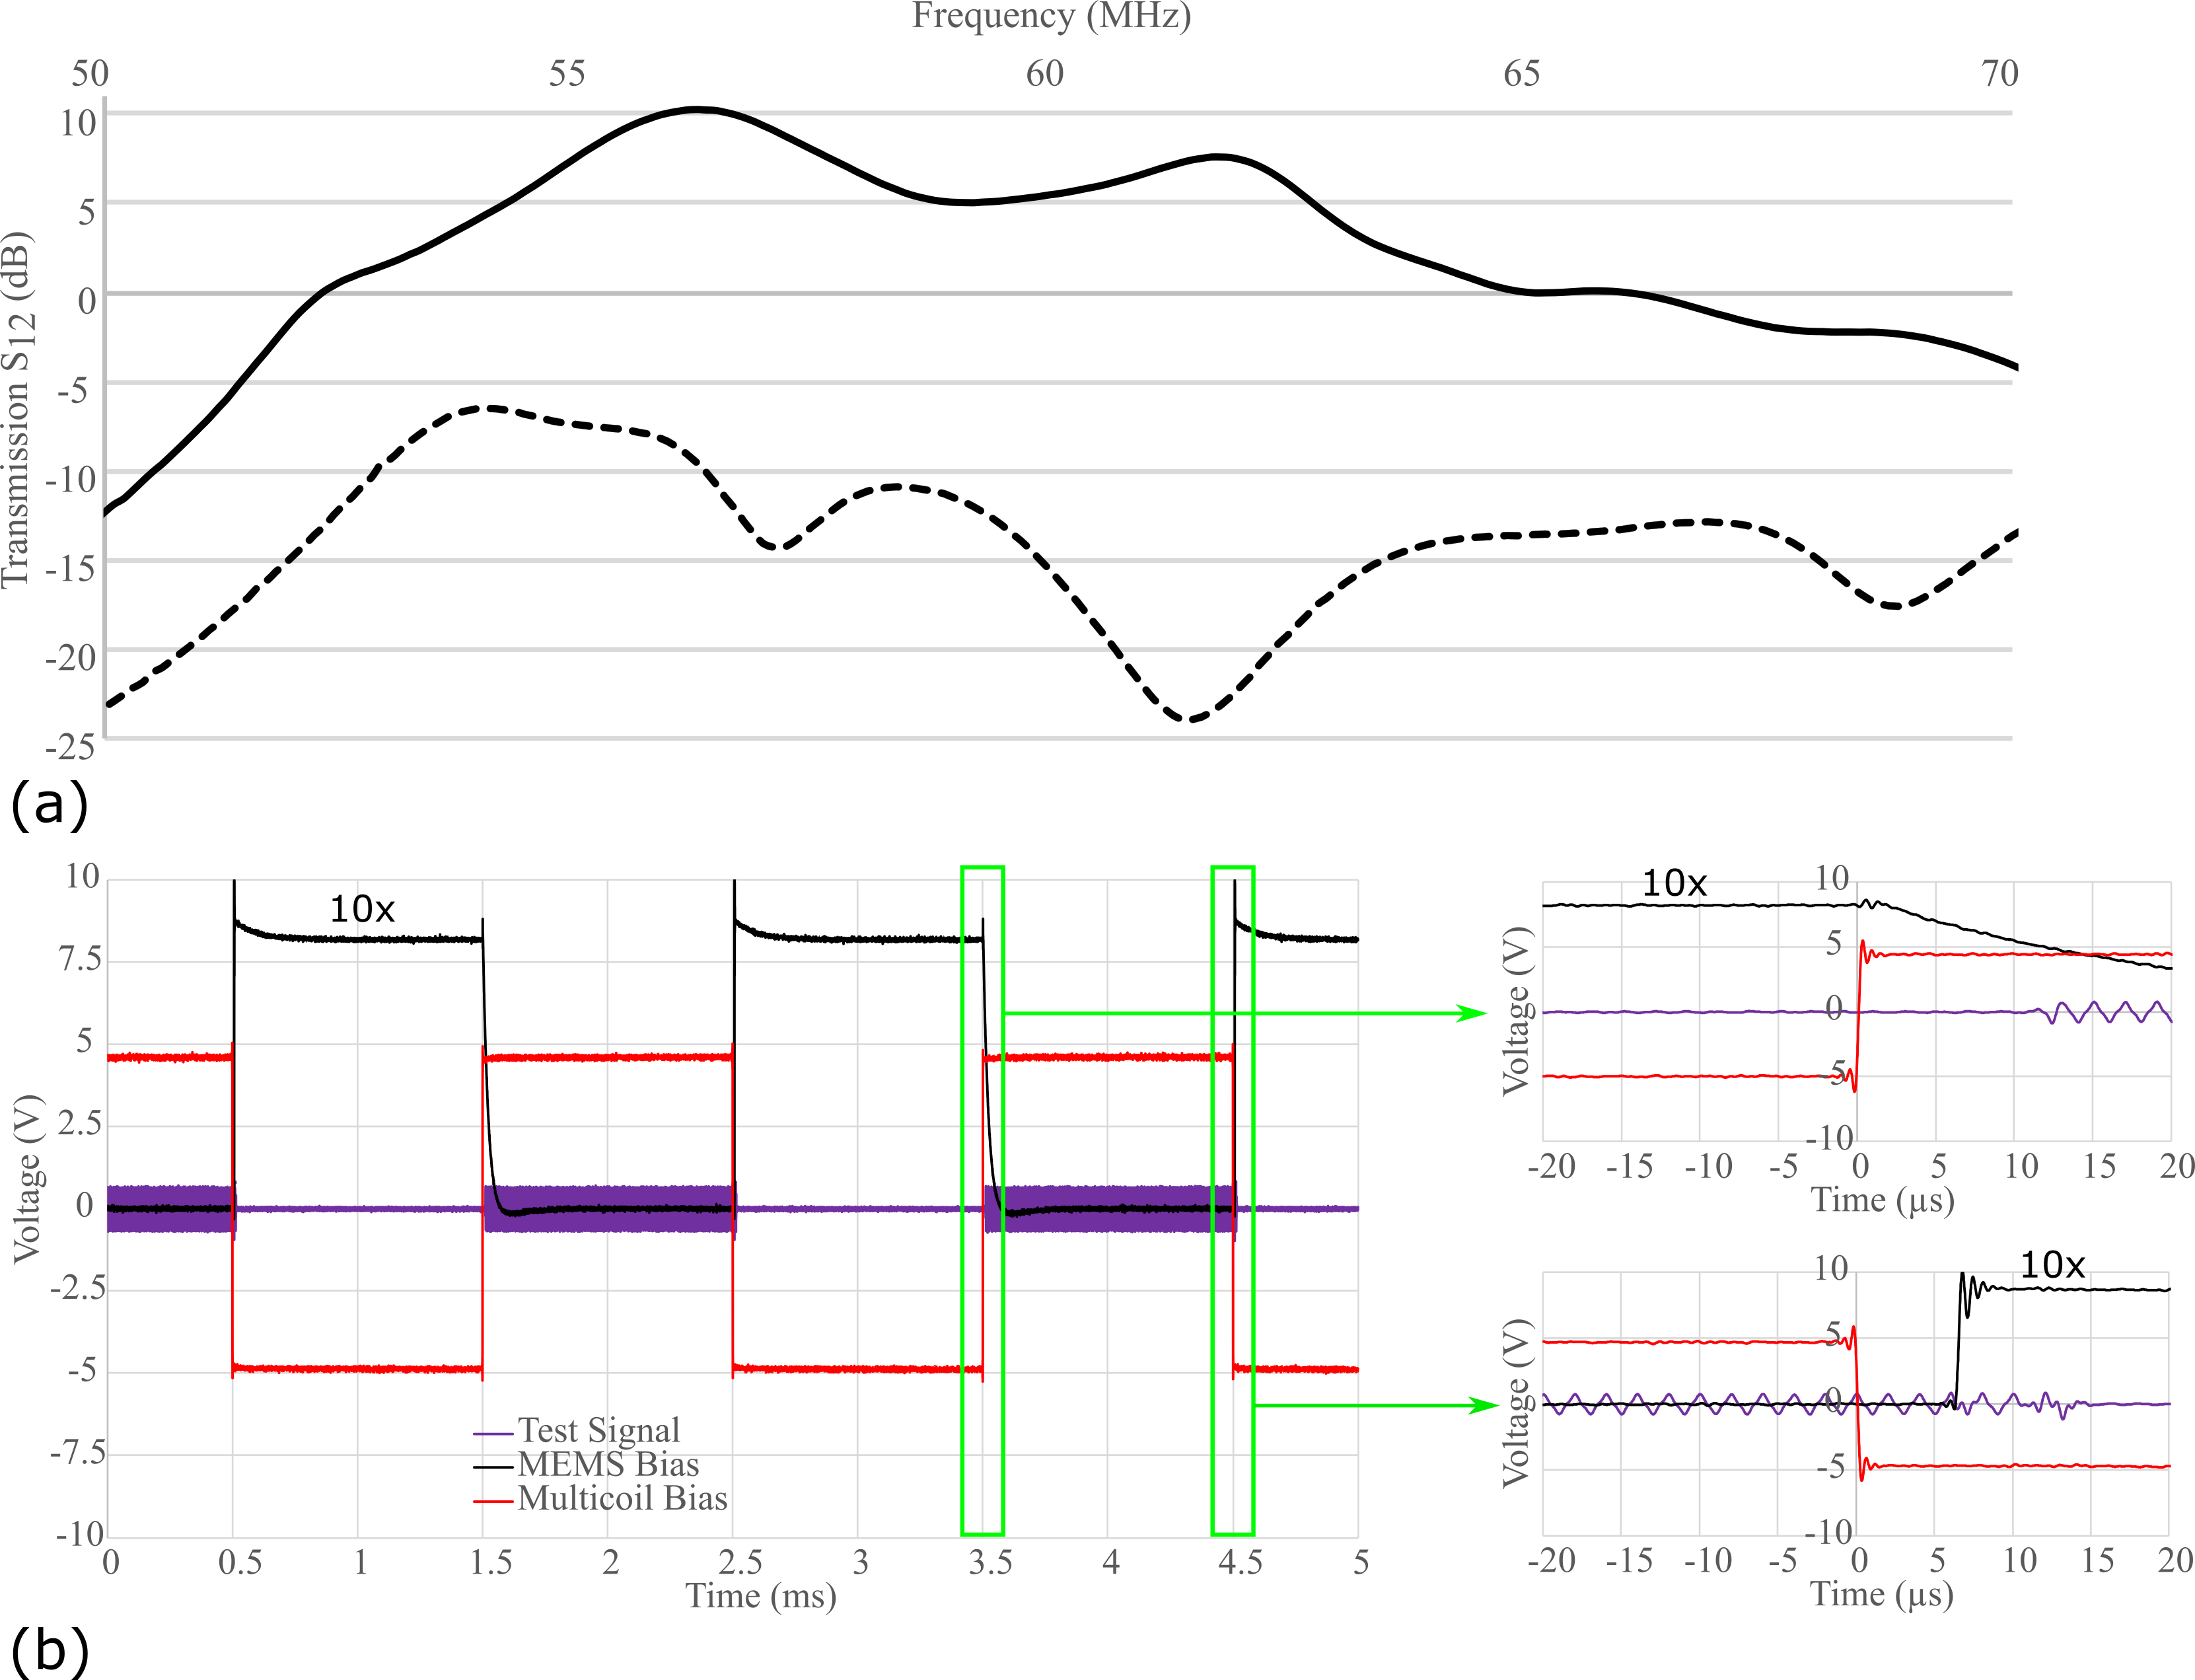
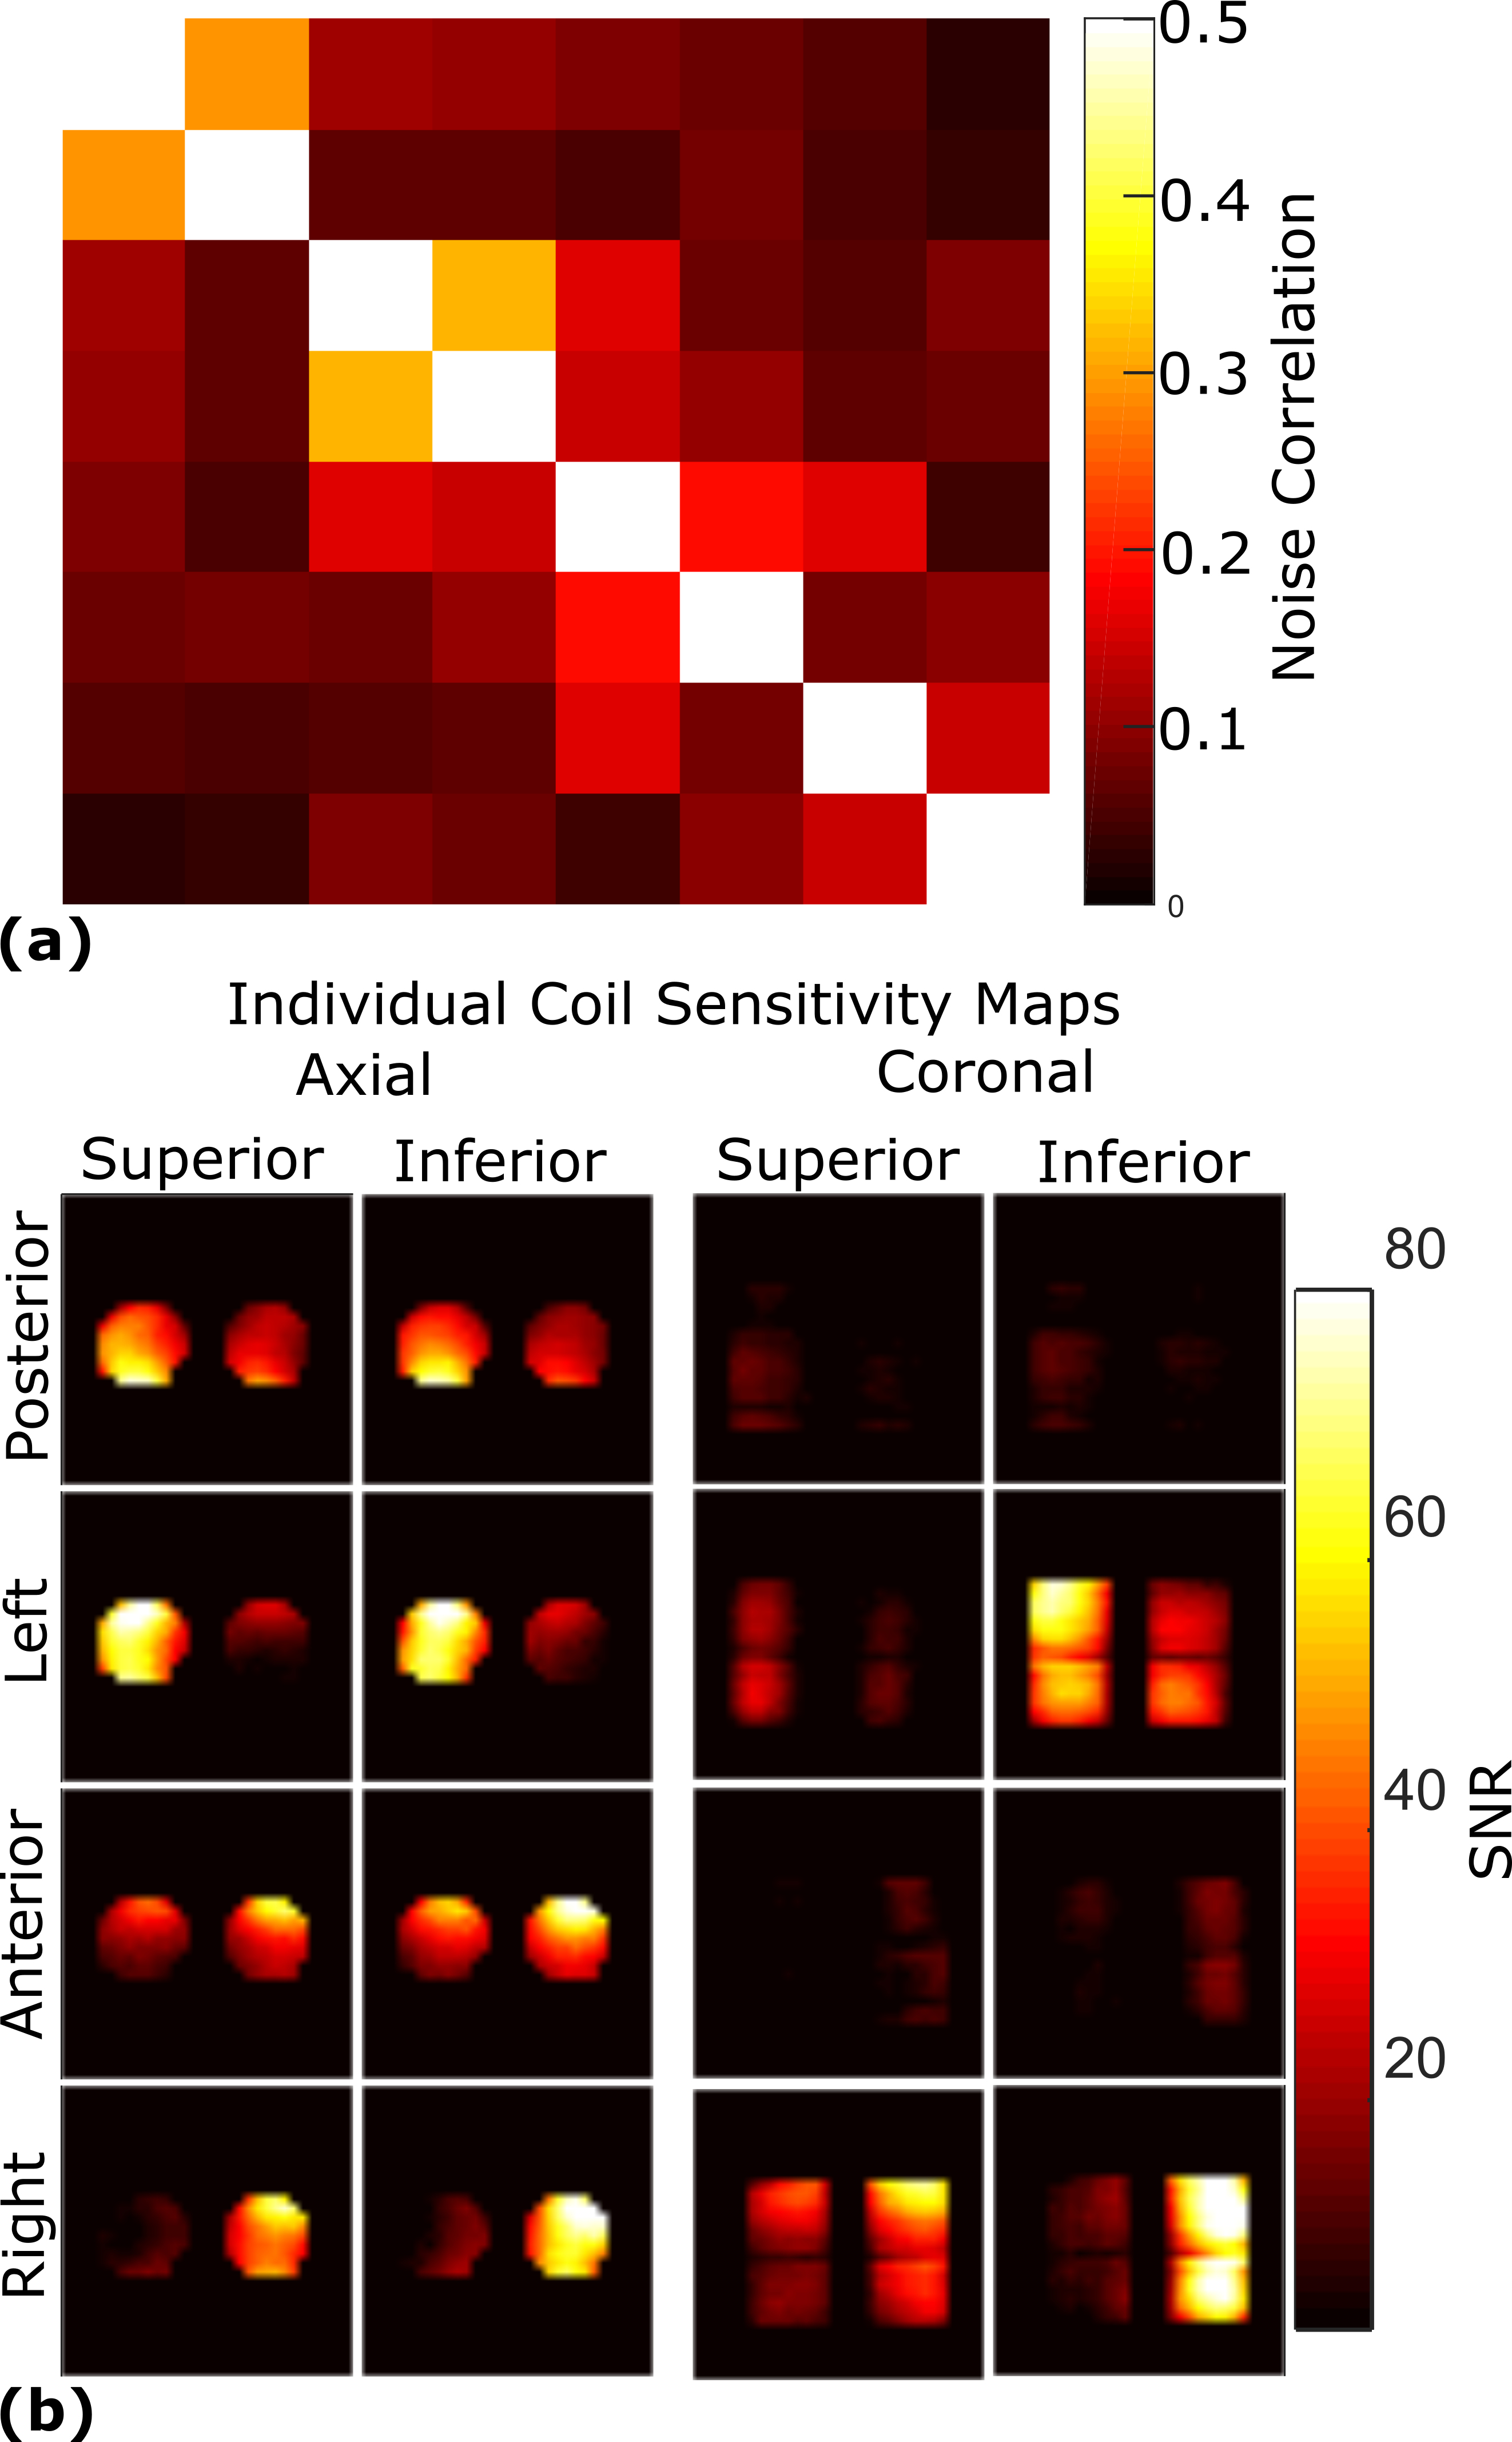
Measurement of superior/inferior coil matching in the receive state (Figure 2(a)) and at the Tx port in transmit state (Figure 2(b)) show low reflection loss and low coupling (S21) between coils. Measurements of the Tx and Rx isolation in Figure 3(a) demonstrate additional 20dB isolation provided by the MEMS, which is sufficient for receive preamplifier protection and safety along with power division between elements, inherent isolation and additional detuning from diodes (overall >40dB isolation). Demonstration of the MEMS driver and MEMS state switching in Figure 3(b) showed a 15µs delay when switching into receive (low impedance) state and 12µs delay when switching to transmit (high impedance) state. Noise correlations between the elements in Figure 4(a) are highest for the superior-inferior pairs, but low overall. Sensitivity maps in Figure 4(b) show distinct patterns consistent with low coupling. FA maps in Figure 5 demonstrate a homogeneous excitation throughout the region of interest.Discussion and Conclusion
The MEMS switch has a small 4µs delay, but the driver adds an additional 11µs. The delay is small when compared to the 50µs previously reported6, and is sufficient for the short TE sequences expected to be employed for imaging 19F in the lungs. The circuit and dividing topology using individual transmit switching for each superior/inferior pair eases constraints on the isolation required for each channel. Although transmit efficiency at the 1H frequency is compromised, overlaid 19F and 1H images confirm co-registered images in the same exam can be obtained without adjustment. Future in vivo evaluation with the developed coil array is in progress to assess the feasibility of combined 19F functional lung imaging and 1H structural imaging. Additionally, the use of MEMS introduces many new opportunities for multi-tuned coil design.Acknowledgements
Doctoral program funding for Adam Maunder was partially provided by support from GE Healthcare Inc. and scholarships from the Natural Sciences and Engineering Research Council of Canada (NSERC) and University of Sheffield. This work was funded by the National Institute for health research (NIHR), Medical Research Council (MRC) and University of Sheffield Hyperpolarised Imaging Group - POLARIS. The views expressed in this abstract are those of the author and not necessarily those of NHS, NIHR, MRC or the Department of Health.References
1. H. Kauczor, R. Surkau, and T. Roberts, "MRI using hyperpolarized noble gases," Eur Radiol, 1998;8:820-827
2. D. Spence and M. Aimi, "Custom MEMS Switch for MR Surface Coil decoupling," Proc. Intl. Soc. Mag. Reson. Med., 2015;23:704
3. A. M. Maunder, M. Daneshmand, P. Mousavi, B. G. Fallone, and N. De Zanche, "Stray Capacitance Between Magnetic Resonance Imaging Coil Elements: Models and Application to Array Decoupling," IEEE Transactions on Microwave Theory and Techniques, 2013;61:4667-4677
4. A. Reykowski, S. M. Wright, and J. R. Porter, "Design of Matching Networks for Low Noise Preamplifiers," Magnetic Resonance in Medicine, 1995;33:848-852
5. P. B. Roemer, W. A. Edelstein, C. E. Hayes, S. P. Souza, and O. M. Mueller, "The NMR phased array," Magnetic Resonance in Medicine, 1990;16:192-225
6. M. Fuentes, E. Weber, S. Wilson, B. Li, and S. Crozier, "Micro-Electromechanical Systems (MEMS) based RF-switches in MRI – a performance study," Proc. Intl. Soc. Mag. Reson. Med., 2010;18:704
Figures