1046
Exploring various radial trajectories for optimal relative phase correction in dual-echo subtraction ZTE MRI1Institute for Biomedical Engineering, University and ETH Zürich, Zürich, Switzerland
Synopsis
In dual-echo subtraction ZTE MRI, it is crucial to correct for gradient delays and phase offsets induced by eddy currents for high image quality. Relative phase correction is a data-driven approach to correct for the gradient hardware imperfection, but it requires that phase offsets induced by eddy current in positive and negative projections to be exact opposite of each other. This work has explored various radial trajectories to satisfy this condition in order to achieve optimal correction for gradient hardware imperfection in dual-echo subtraction ZTE MRI.
Introduction
Dual-echo subtraction MRI with zero echo time (DE-ZTE) provides contrast for samples with short transverse relaxation times [1]. DE-ZTE employs 3D center-out radial spatial encoding scheme where RF excitation is performed after the projection gradient is switched on to acquire ZTE signal [2], followed by complete rewinding of the projection gradient to acquire gradient echo (GRE) signal within one TR. Due to hardware imperfection, the complete rewinding of the projection gradients leads to delays and eddy currents in the coils that result in shifted TE and phase offset in GRE. While they can be corrected based on relative linear and constant phase between projection pairs, but it relies on the conditions that the projection pairs experience exact opposite phase offsets and same off-resonance effects [3]. In this work, various radial trajectories were explored with aims to satisfy the conditions to allow optimal gradient delay and eddy current correction. It was revealed that the relative phase correction performed best when the positive and negative projections experienced exact opposite gradient history and when the time elapsed between from the acquisition of positive to negative projections remains constant throughout the measurement.
Background
Relative Phase Correction [3]
Let S+ and S- denote positive and negative projection signal, respectively. Then the signal equation is given by:
S+(r) = S+corr(r) ∙ exp(+i(∆k∙r + Φ+eddy + Φ+off-resonance))
S-(r) = S-corr(r) ∙ exp(-i(∆k∙r + Φ-eddy + Φ-off-resonance))
where ∆k denotes shift in k-space, Φ denotes phase offsets induced by eddy currents or off-resonance and r denotes spatial position. The phase offsets are extracted based on relative phase difference, which is given by:
Φ+(r) - Φ-(r) = 2∙(∆k∙r + Φeddy)
where Φ+ and Φ- are signal phase of the projection pair in the spatial domain. Then linear phase fitting is performed in order to estimate ∆k and k0 and these are applied to projection signal in the image domain as follows:
S+corr(r) ∙ exp(+i(Φ+off-resonance)) = S+(r) ∙ exp(-i(∆k∙r + Φ+eddy))
S-corr(r) ∙ exp(-i(Φ-off-resonance)) = S-(r) ∙ exp(+(∆k∙r + Φ-eddy))
However, this method assumes that:
Φ+eddy = -Φ-eddy
Φ+off-resonance = Φ-off-resonance
To examine these assumption, phase offsets were measured using field camera [4]. In ideal condition, the phase difference should provide phase offsets induced by eddy currents, which is influenced by gradient history.
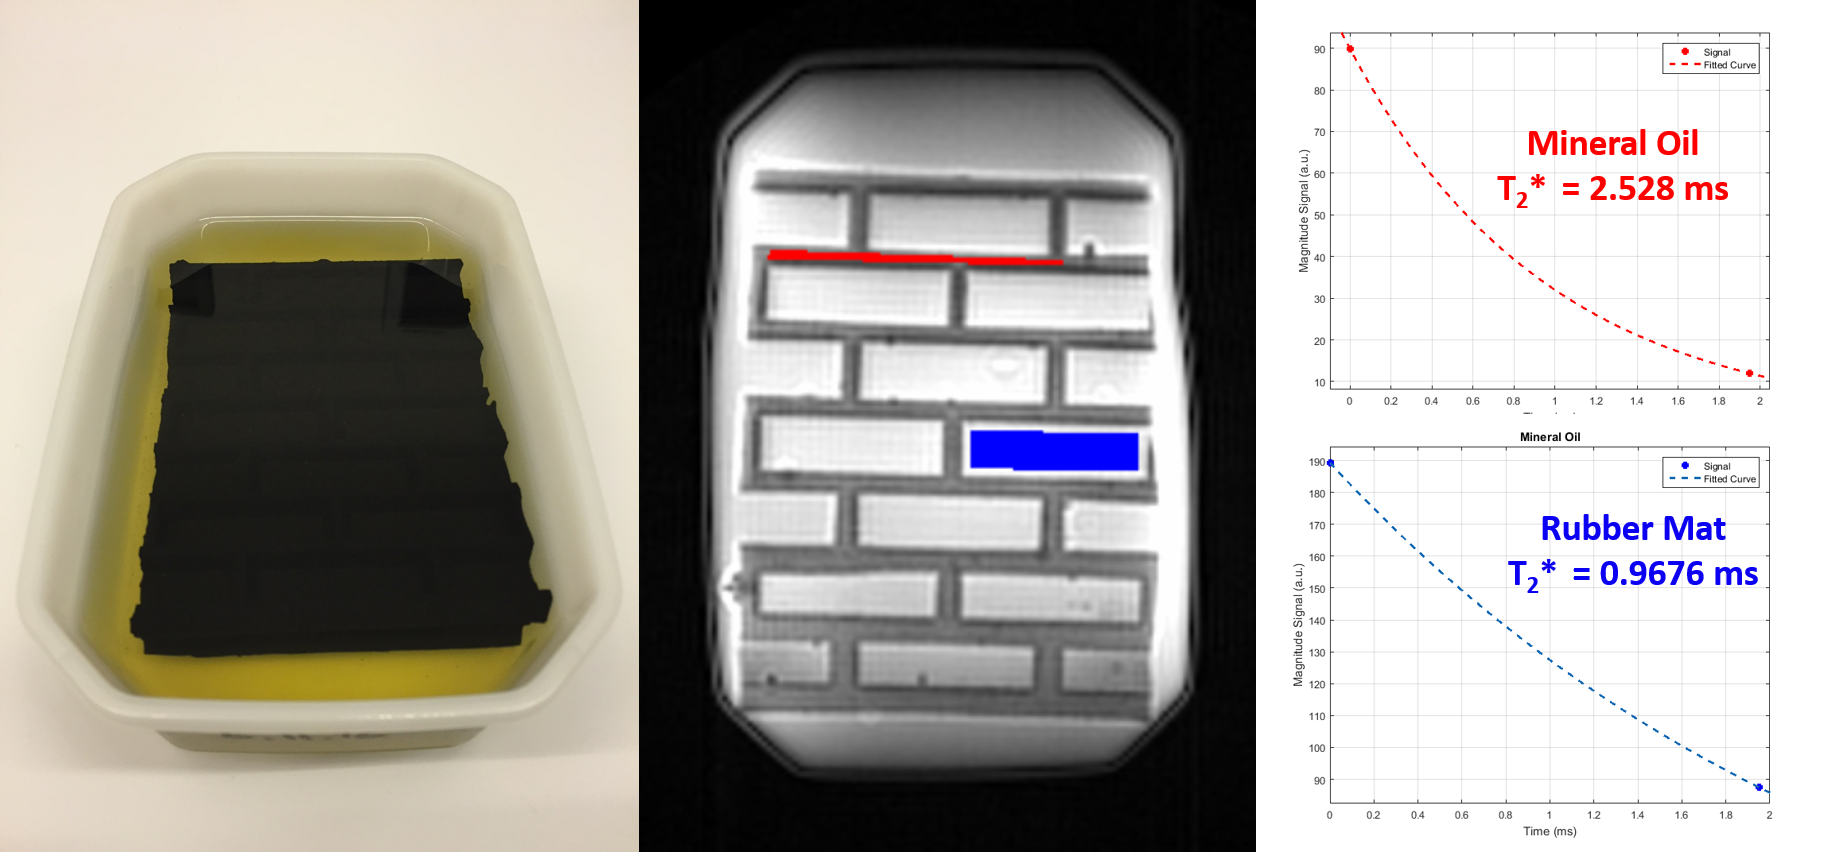
Weighted Subtraction
To enhance short transverse relaxation time components, ZTE and GRE images are subtracted with a weight [5] as following:
SUB(x,y,z) = ZTE(x,y,z) - w ∙ GRE(x,y,z)
where w = exp(TE / T2_threshold) such that voxels with T2* shorter than T2_threshold are suppressed.
Methods
Field probes are used to measure DE-ZTE trajectory as described in [3]. High-Resolution Protocol: G = 24.4652, BW = 250 kHz, Voxel size = 1 mm isotropic, Matrix size = 240, nDummy = 2000, nPro = 184320, nInt = 2, dwell time = 4 us, NSA = 1, TE = 2 ms, TR = 5 ms, RF pulse duration = 2 us. Scan time = 15:32 min. Low-Resolution Protocol: G = 24.4652, BW = 250 kHz, Voxel size = 2 mm isotropic, Matrix size = 120, nDummy = 2000, nPro = 46080, nInt = 2, dwell time = 4 us, NSA = 1, TE = 2 ms, TR = 5 ms, RF pulse duration = 2 us, Scan time = 4:01 min. For all weighted subtractions, T2_threshold = 2.2 ms.
Results & Discussions
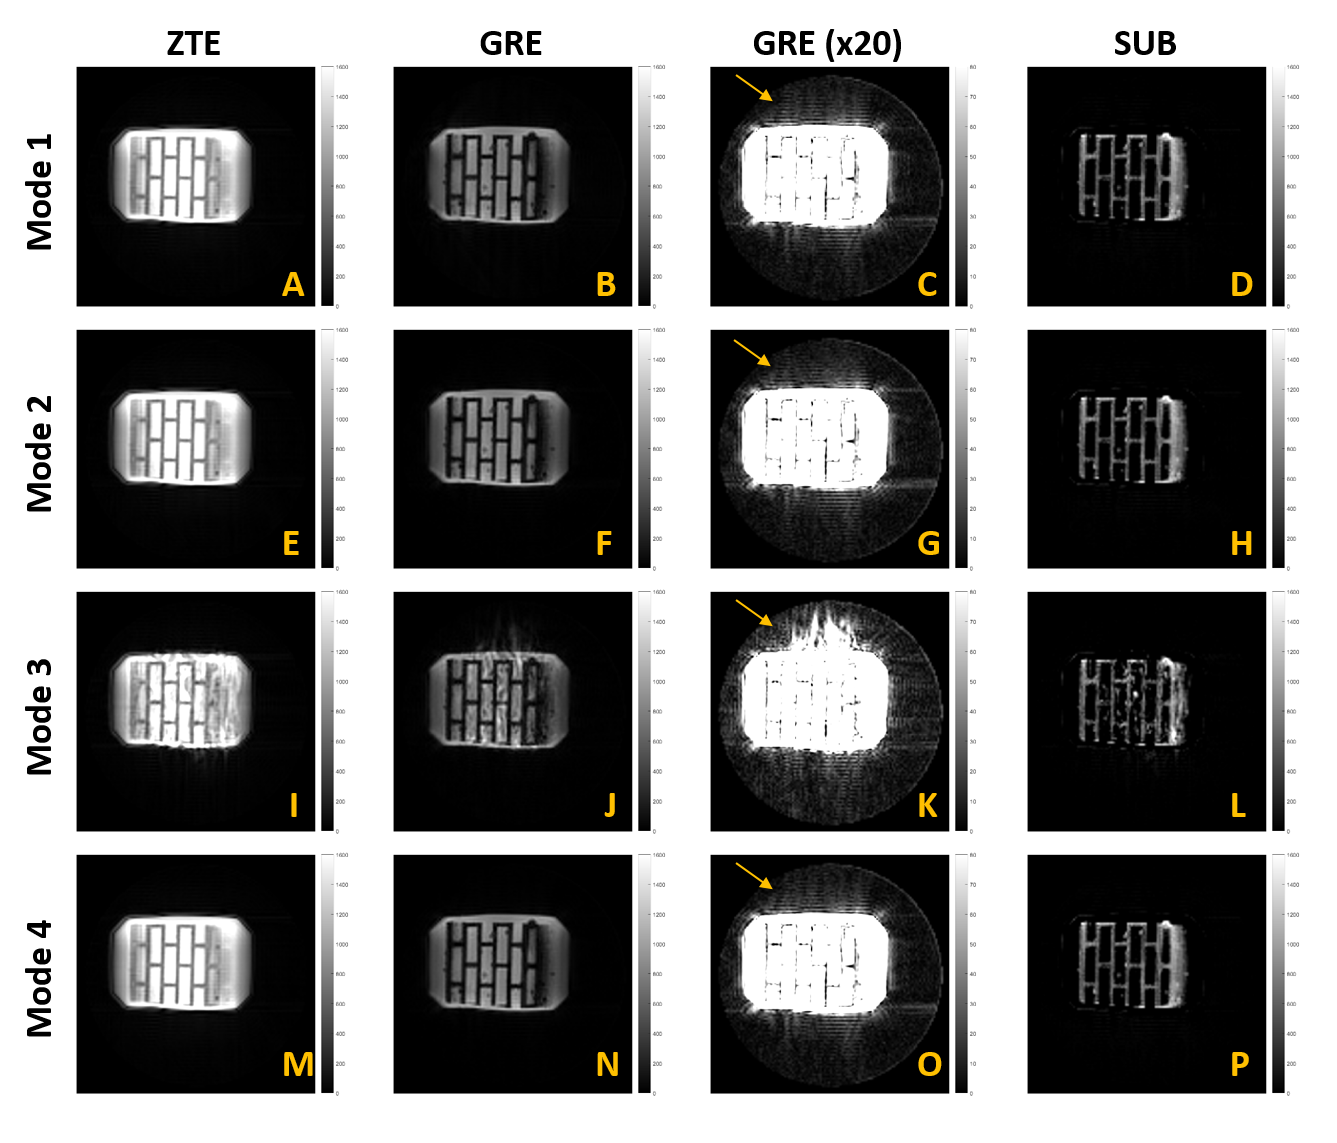
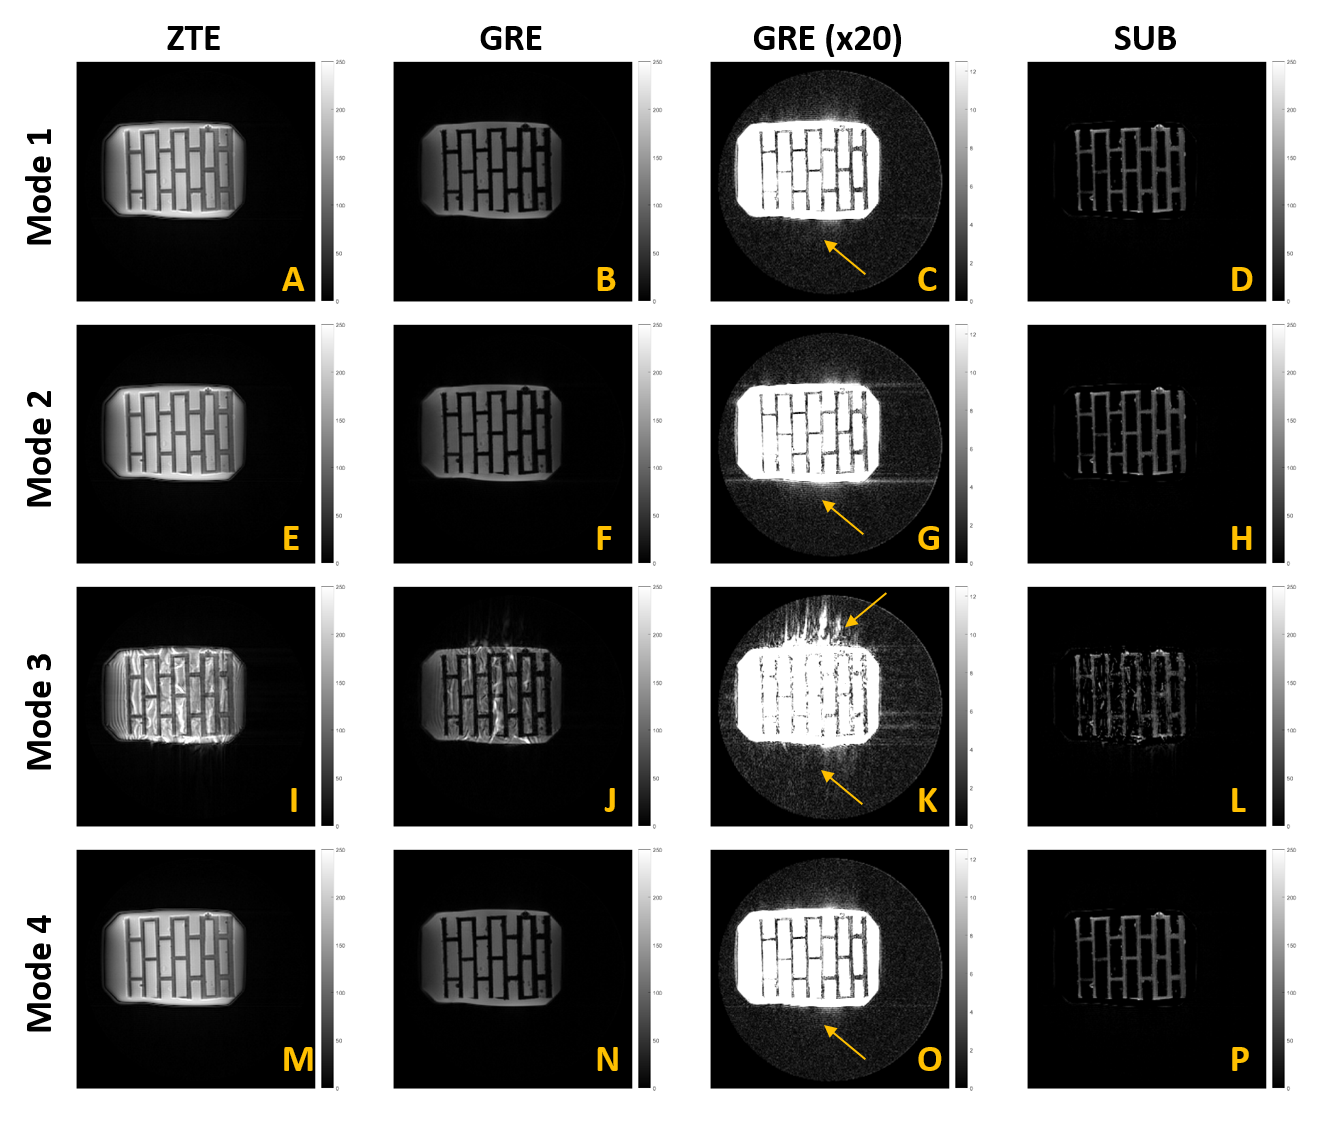
In mode 1, phase difference (Fig. 2) showed an exponential spike in the beginning, suggesting that eddy currents experienced by these projection pairs were not equal (Fig. 1). Further, significant artifact in GRE image (Fig. 4C) and signal distortion in SUB image (Fig 4D) were observed. These artifacts did not appear in the high resolution GRE and SUB images (Fig 5C and 5D), since much more (= 92160) projection pairs are acquired. Mode 2 shows oscillatory behavior in its measured phase difference (Fig. 2) due to mismatched gradient history throughout the entire projection pairs (Fig 1). However, the image quality was not affected significantly in low resolution scan (Fig 4E-H). In high-resolution, some artifacts were observed in GRE (Fig G) due to B0 drift contributing inhomogeneous phase offsets to projection pairs. Mode 3 suffered from stimulated echoes, leading to much distortions in the images (Fig 4I-L, 5I-L). To avoid stimulated echoes, TR should be prohibitively prolonged. Mode 4 had perfectly matched gradient history throughout all projection pairs (Fig 1), and the phase difference shows no oscillatory or exponential behavior. Moreover, both the low and high resolution images show remarkable image quality (Fig 4M-P, Fig 5M-P).
Acknowledgements
No acknowledgement found.References
[1] M Weiger, DO Brunner, NE Dietrich, CF Mueller, KP Pruessmann. 'ZTE Imaging in Human,' Magn Reson in Med. 70:328-332 (2013)
[2] M Weiger, KP Pruessmann, 'MRI with Zero Echo Time,' eMR, 2012, Vol 1: 311–322. DOI 10.1002/9780470034590.emrstm1292
[3] V Rasche, D Holz, R Proska. 'MR Fluoroscopy Using Projection ReconstructionMulti-Gradient-Echo (prMGE) MRI.' Magn Reson in Med. 42:324-334 (1999)
[4] C Barmet, ND Zanche, KP Pruessmann. 'Spatiotemporal Magnetic Field Monitoring for MR,' Magn Reson in Med. 60:187-197 (2008)
Figures
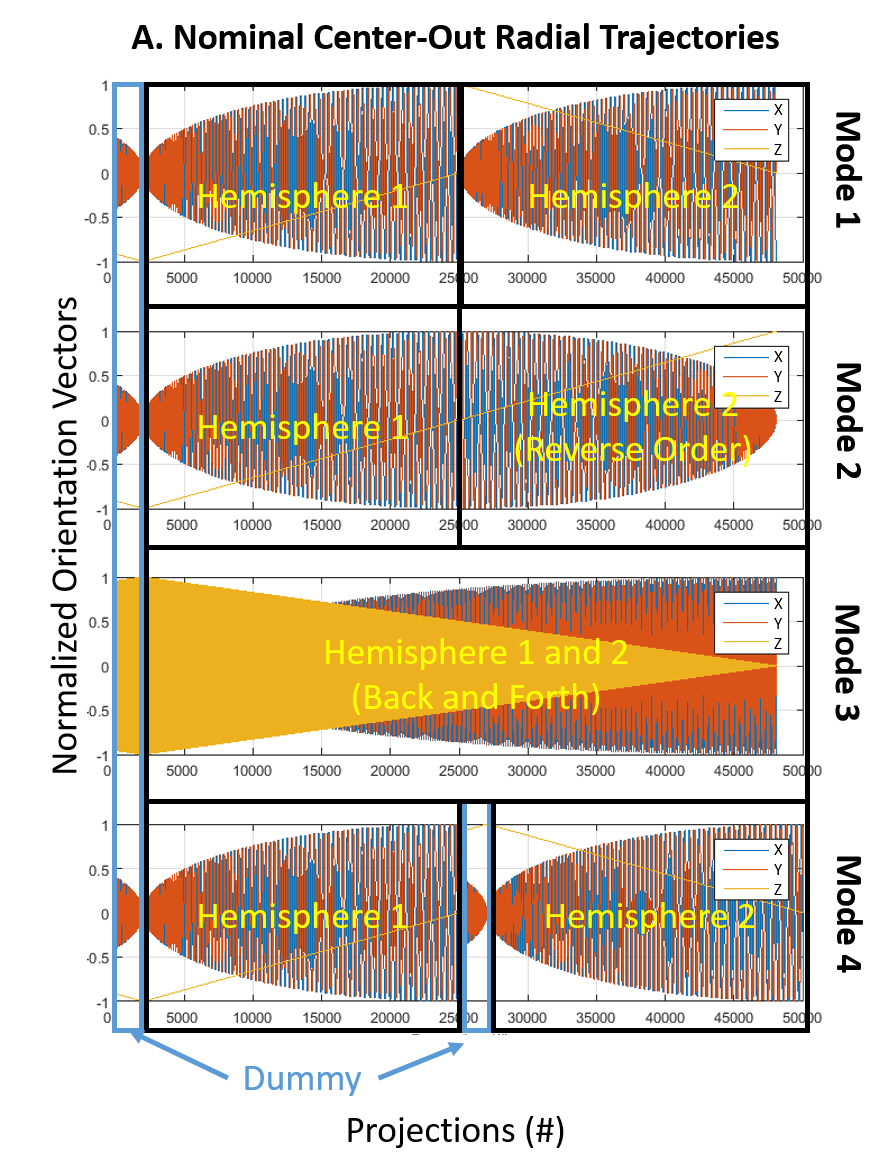
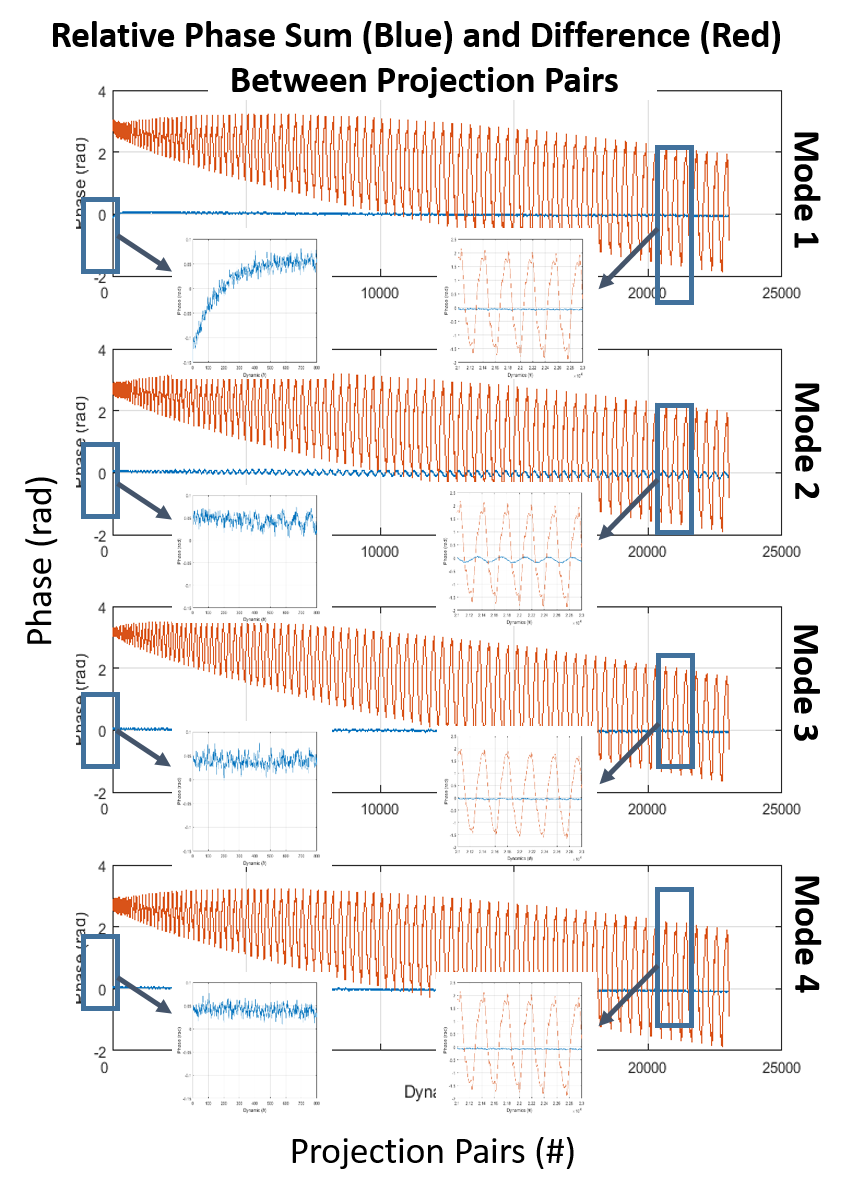
Fig 2. Phase sum and difference at TE between projection pairs given by field camera measurement. In ideal condition, phase sum yields phase offsets induced by off-resonance, which should remain constant throughout entire projection pairs, whereas the phase difference yields phase offsets induced by eddy currents in gradient coils, which should exhibit an oscillatory behavior across projection pairs. In mode 1, phase sum shows exponential behavior in the beginning projection pairs and remains constant throughout the rest. In mode 2, phase sum shows small oscillations with the same periodicity of oscillations shown in phase difference. In mode 3 and 4, phase sum remains constant throughout all projection pairs without any oscillatory or exponential behavior.