1036
Detecting in vivo urokinase Plasminogen Activator activity with a catalyCEST MRI contrast agent1Chemistry and Biochemistry, University of Arizona, Tucson, AZ, United States, 2Medical Imaging, University of Arizona, Tucson, AZ, United States, 3University of Arizona Cancer Center, University of Arizona, Tucson, AZ, United States
Synopsis
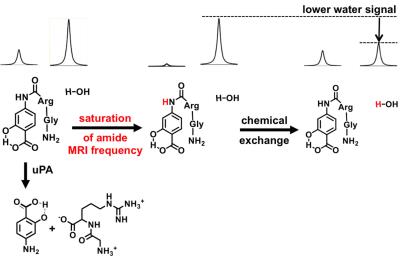
SYNOPSIS: We have designed a nonmetallic contrast agent, GR-4Am-SA, that can detect the activity of urokinase Plasminogen Activator with CEST MRI. uPA cleaves a peptide of the agent which causes CEST at 5.0 ppm to decrease, but CEST at 9.5 ppm is unchanged. The two CEST signals were used to determine a reaction coordinate, representing the extent of enzyme-catalyzed cleavage of the GR-4Am-SA agent. GR-4Am-SA detected uPA activity in solution, and in a flank xenograft model of Capan-2 pancreatic cancer.
PURPOSE:
Urokinase Plasminogen Activator (uPA) is a serine protease that contributes to cancer invasion and
metastasis.1 We proposed to
develop a diamagnetic CEST agent with enzyme responsive and unresponsive
signals that can detect uPA activity during in
vivo imaging studies.
METHODS:
The CEST agent, Gly-Arg-4-aminosalicylic acid (GR-4Am-SA), was synthesized in five steps. MRI studies were performed with a Biospec 7T MRI scanner with a 72 mm volume transceiver coil at 37.0°C. CEST-FISP MRI of 25 mM GR-4Am-SA at pH 7.3 was performed with the following parameters: TR: 3.196 ms; TE: 1.598 ms; excitation flip angle: 30°; matrix: 128×128; field of view: 8×8 cm; in-plane spatial resolution: 625×625 µm; slice thickness: 1 mm; number of slices: 1; number of averages: 1. Then 50 units of uPA enzyme and 9.7 pmol dithiothreitol were incubated in this solution, and the same catalyCEST MRI studies were performed. Lorentzian line shape fitting was used to measure CEST signals.3 The reaction coordinates were determined using Eq. [1].4
$$\begin{equation} RC = 1 - \cfrac{[\frac{CEST @ 5.0 ppm}{CEST @ 9.5 ppm}]_{after}}{[\frac{CEST @ 5.0 ppm}{CEST @9.5 ppm}]_{before}} \end{equation} $$ Eq. [1]
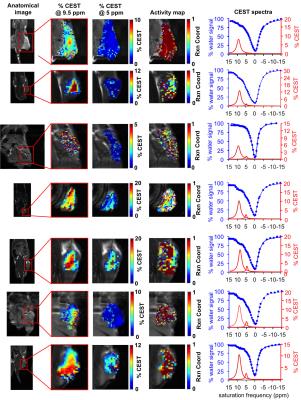
A mouse model of Capan-2 pancreatic cancer with a ~350 mm3 diameter flank tumor was injected with a 200 µL solution of 250 mM of GR-4Am-SA within 5 mm of the tumor. After 10 minutes to allow the agent to be cleaved by the enzyme, CEST-FISP MRI was performed using TR: 3.698 ms; TE: 1.649 ms; excitation flip angle: 15°; with radiofrequency spoiling; centric encoding during acquisition; matrix: 128 ×128; field of view: 6×4 cm; in-plane spatial resolution: 469×312 µm; slice thickness: 2 mm; number of slices: 1; number of averages: 1. Ten 600 ms continuous wave saturation pulses at a saturation power of 4 mT were used at each saturation frequency. We averaged images from ten CEST spectra and applied a Gaussian spatial filter.5 Lorentzian line shapes was fit to each CEST spectrum to measure the signal amplitudes. The parametric maps of the reaction coordinates were determined using Eq. [2] to provide estimates of the uPA enzyme activity.4
$$RC=1-\frac{[CEST @ 5.0 ppm]_{after}}{[CEST @ 9.5 ppm]_{before}}$$ Eq.[2]
RESULTS:
The contrast agent, GR-4Am-SA, was synthesized in an overall yield of 23%. Initial catalyCEST MRI studies detected CEST signals from GR-4Am-SA at 9.5 and 5.0 ppm. Adding uPA to GR-4Am-SA with DTT caused the CEST signal amplitude at 5.0 ppm to decrease by 69%, while the CEST signal amplitude at 9.5 ppm showed relative stability by increasing 12%, resulting in a reaction coordinate of 76.1% and demonstrating that GR-4Am-SA can detect uPA activity with catalyCEST MRI. The same reaction without DTT showed a reaction coordinate of 3.3%, and the agent with DTT and without enzyme showed a reaction coordinate of 7.1%, showing that both the enzyme and DTT were needed for enzyme catalysis. In vivo catalyCEST MRI studies demonstrated an average of 10.6% CEST signal at 9.5 ppm from GR-4Am-SA within the tumor region of seven mice, which indicated good uptake of the agent into the tumor. The CEST signal from GR-4Am-SA in tissues around the tumor was negligible, which indicated that the agent was not retained in these tissues during the time course of our MRI studies. The average CEST signal at 5.0 ppm from GR-4Am-SA for all mice was 2.2%, indicating that much of the aryl amide had been converted to an amine in vivo. The average reaction coordinate was (79.7 ± 7.5)%. The reaction coordinate was more dependent on the enzyme-responsive CEST signal at 5.0 ppm (R = 0.93) and had a relative weak dependence on the enzyme-unresponsive CEST signal at 9.5 ppm (R = 0.32), showing that the reaction coordinate is largely independent of the concentration of GR-4Am-SA that is tracked by the CEST signal amplitude at 9.5 ppm.DISCUSSION:
The ratio of CEST signals from the single GR-4AM-SA agent can assess uPA activity in a concentration-independent manner in biochemical solution and in vivo. However, proteases other than uPA may have cleaved the peptidyl ligand of GR-4Am-SA during in vivo studies of the Capan-2 tumor model. Therefore, future studies are warranted that detect other enzyme activities in the Capan-2 tumor model. CatalyCEST MRI is an excellent platform technology for detecting these other enzyme activities in vivo.Acknowledgements
No acknowledgement found.References
1. Andreasen PA, et al. Int J Cancer 1997;72:1-22.
2. Shah T, et al. Magn Reson Med 2011;65:432–437.
3. Hingorani DV, et al. J Am Chem Soc 2013;135:396-6398.
4. Sinharay S, et al. Magn Reson Med 2016; DOI:10.1002/mrm.26278.
5. Chen LQ, et al. Mol Imaging Biol 2015;17:488-496.
Figures


