1034
MR molecular imaging of extradomain-B fibronectin for characterizing prostate cancer aggressiveness1Department of Biomedical Engineering, Case Western Reserve University, Cleveland, OH, United States
Synopsis
Accurate risk stratification is critical to the clinical management of prostate cancer. The objective of our study is to investigate the effectiveness of MR molecular imaging of EDB-FN for non-invasive localization and characterization of prostate cancer aggressiveness. An EDB-FN targeting Gd-based contrast, ZD2-Gd(HP-DO3A), was designed and synthesized. Molecular MRI of EDB-FN with ZD2-Gd(HP-DO3A) can specifically improve contrast enhancement in high-risk prostate tumors, not low-risk tumors, enabling accurate characterization of prostate cancer aggressiveness. Molecular MRI with the contrast agent has great promise for detection of high-risk prostate cancer, and non-invasive differential diagnosis and risk stratification of human prostate cancer.
Purpose
Accurate risk stratification is critical to the clinical management of prostate cancer. The inability of current diagnostic methods, including prostate specific antigen (PSA) screening, to differentiate high-risk tumors from low-risk tumors, resulted in overdiagnosis and overtreatment1. The molecular change in tumor microenvironment is an important discriminator of prostate cancer aggressiveness2. One of the extracellular matrix molecule, extradomain-B Fibronectin (EDB-FN), is abundantly expressed in aggressive prostate cancer, but not in benign prostate diseases3. The objective of our study is to investigate the effectiveness of MR molecular imaging of EDB-FN for non-invasive localization and characterization of prostate cancer aggressiveness.Methods
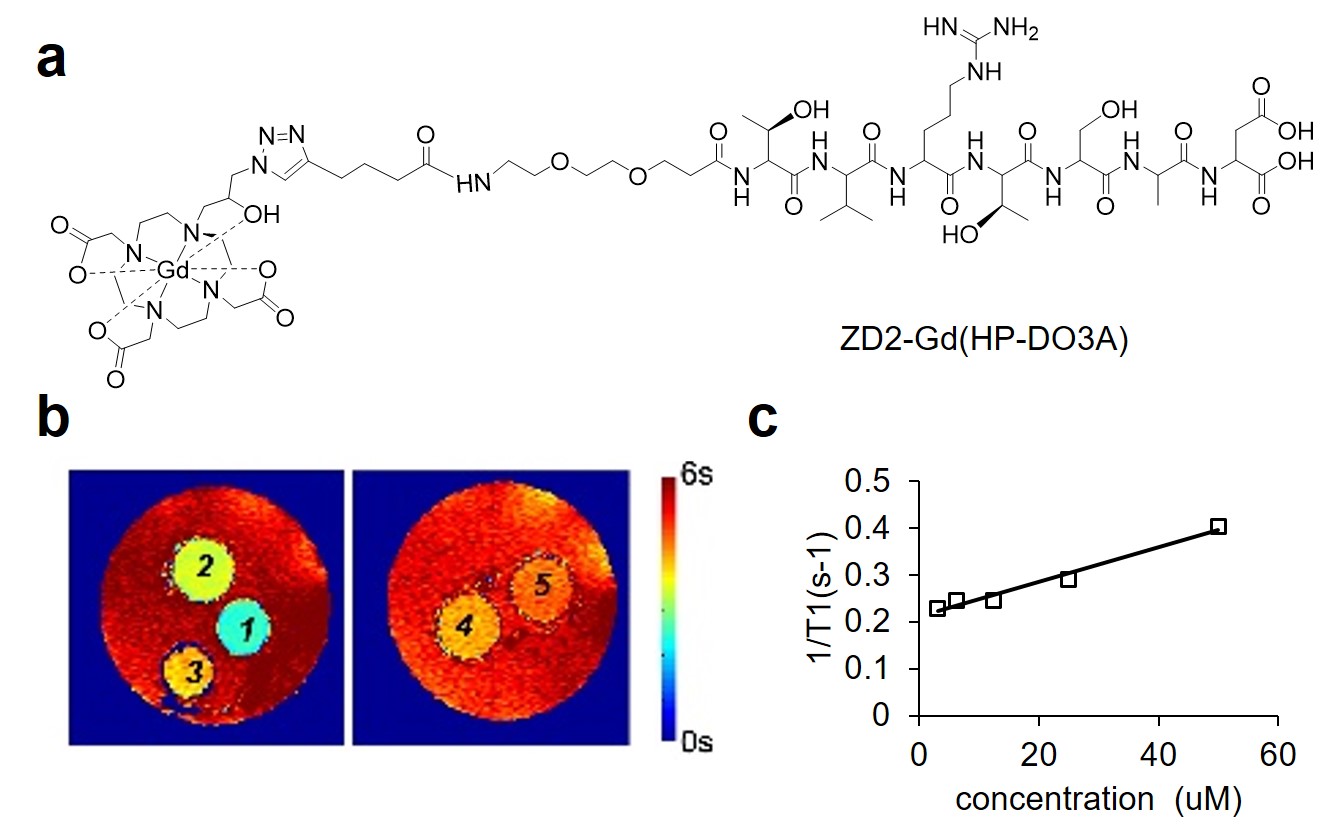
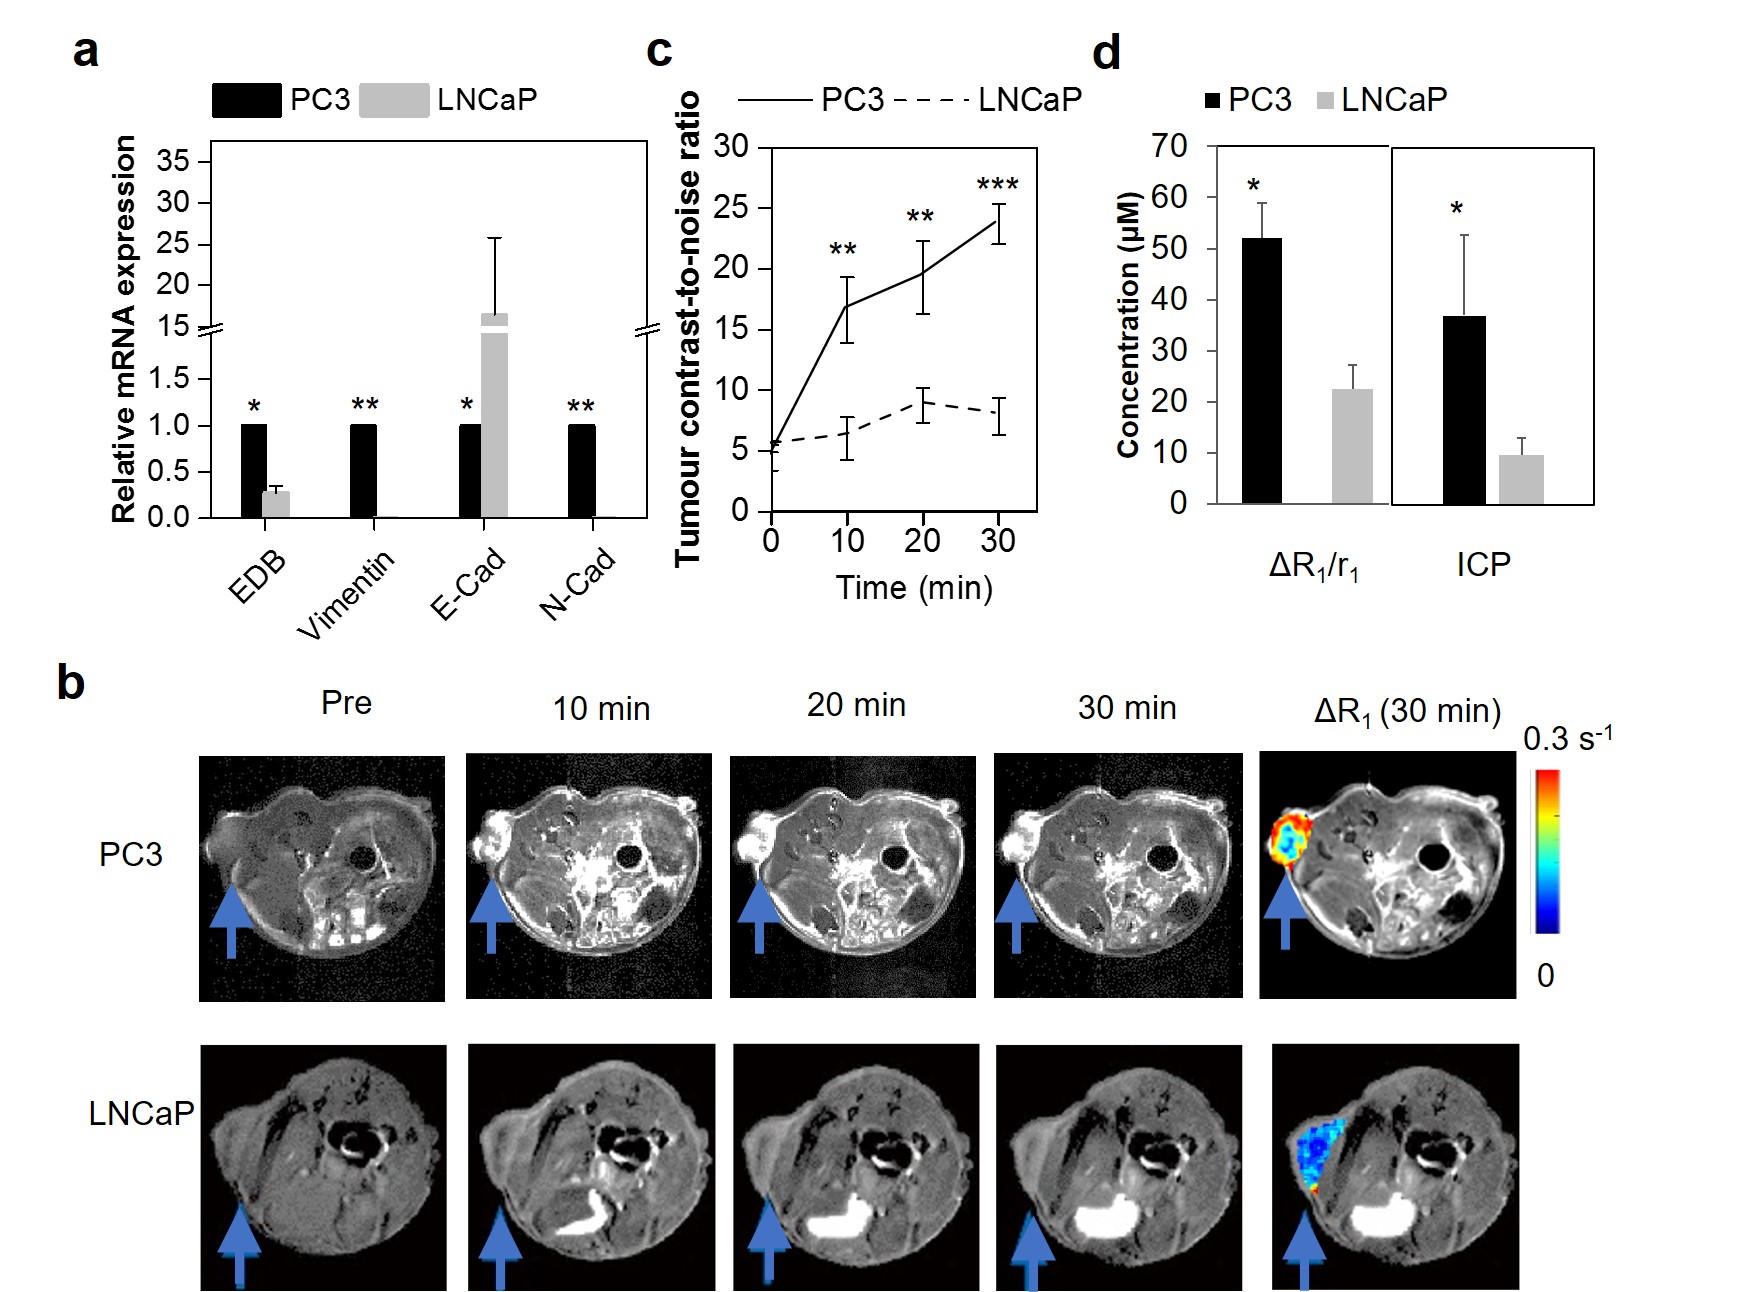
The EDB-FN-targeting peptide ZD2 (Thr-Val-Arg-Thr-Ser-Ala-Asp)4 was synthesized in solid phase using standard Fmoc peptide chemistry. ZD2 was further functionalized with 5-hexynoic acid and conjugated with azido-Gd(HP-DO3A) through click chemistry. This contrast agent was used for MR molecular imaging of EDB-FN and tested in PC3 and LNCaP tumor models, which represented metastatic and non-metastatic prostate cancer models, respectively. Expression of EDB-FN, vimentin, E-cadherin, and N-cadherin was assessed with real-time PCR (RT-PCR) analysis. MRI experiments were performed on a horizontal 7T Bruker scanner (Bruker Biospin Co., Billerica, MA). Imaging experiments were performed when the tumor size reached 5-8 mm in diameter. ZD2-Gd(HP-DO3A) was administered intravenously at the dose of 0.1 mmol/kg after acquiring pre-contrast images. Post-contrast images were obtained at 10, 20, and 30 min post-injection. The axial slices of mouse at the tumor location were acquired using T1-weighted spin echo sequence with the following parameters: field of view = 3 cm; slice thickness = 1.2 mm; interslice distance = 1.2 mm; TR = 500 ms, TE = 8.1 ms; flip angle = 90°; 2 averages; matrix size = 128 × 128. Contrast-to-noise ratio (CNR) was calculated by measuring the signal intensity between the tumor and muscle, scaled to image noise. The T1 maps of the tumors were acquired before and after contrast using a spiral multi-slice saturation recovery look locker sequence (MSRLL) adapted from a Cartesian MSRLL sequence reported previously5. The following parameters were used: flip angle = 10°; TE = 2.09 ms; slice thickness = 1 mm; 1 average; field of view = 3 × 3 cm2; matrix size = 128 × 128. For each slice, 50 images that covered 5 s of the saturation recovery curve were acquired within an interval of 100 ms. Proton density (M0) images were acquired with repetition time (TR) of 2 s. Cartesian MRSLL images were also acquired as a validation of spiral MRSLL method. Center 64 k-space lines were acquired in the Cartesian method as described previously. To compare the contrast agent accumulation in two tumor models, the change of 1/T1 before and after contrast and Gd concentration in tumor after contrast agent injection were measured.Results
The chemical structure of ZD2-Gd(HP-DO3A) is shown in Fig. 1a. T1 mapping images of the phantom and the plot of 1/T1 against concentration for T1 relaxivity calculation are shown in Fig. 1b and 1c. RT-PCR analysis indicated that PC3 cells exhibited post epithelial-to-mesenchymal transition (EMT) phenotypes, including loss of E-cadherin and upregulation of N-cadherin and vimentin (Fig. 2a)6. PC3 cells also had substantially higher EDB-FN expression than LNCaP cells (Fig. 2a), indicating EDB-FN as a molecular marker of high-risk prostate cancer7. In contrast-enhanced MRI, the targeted contrast agent produced an over 5-fold increase in contrast-to-noise ratio (CNR) in PC3 tumors at 30 min after injection (CNR = 23.7±1.68; n=5; SEM), whereas ZD2-Gd(HP-DO3A) only produced a CNR of 7.85±1.52 (n=5; SEM) in LNCaP tumors (Fig. 2b and 2c). A higher ΔR1 in tumor, originated from a dramatic decrease in T1 reduction because of contrast agent accumulation, was also seen in PC3 tumors (Fig. 2b and 2d). In contrast, a relatively lower ΔR1 and a lower Gd concentration were seen in LNCaP tumors. The targeted contrast agent produced much more significant signal enhancement in aggressive PC3 prostate tumor than non-metastatic LNCaP prostate tumor.Conclusions
Molecular MRI of EDB-FN with ZD2-Gd(HP-DO3A) can specifically improve contrast enhancement in high-risk prostate tumors, not low-risk tumors, enabling accurate characterization of prostate cancer aggressiveness. Molecular MRI with the contrast agent has great promise for detection of high-risk prostate cancer, and non-invasive differential diagnosis and risk stratification of human prostate cancer.Acknowledgements
Research reported in this abstract was supported by the National Institute of Biomedical Imaging and Bioengineering of the National Institutes of Health under Award Number R01EB000489. The content is solely the responsibility of the authors and does not necessarily represent the official view of the National Institute of Health.References
1. Roobol, M. Perspective: Enforce the clinical guidelines. Nature 2015, 528, (7582), S123.
2. Gao, D.; Vahdat, L. T.; Wong, S., et al. Microenvironmental regulation of epithelial-mesenchymal transitions in cancer. Cancer Res. 2012, 72, (19), 4883-9.
3. Kaspar, M.; Zardi, L.; Neri, D. Fibronectin as target for tumor therapy. Int J Cancer 2006, 118, (6), 1331-9.
4. Han, Z.; Zhou, Z.; Shi, X., et al. EDB Fibronectin Specific Peptide for Prostate Cancer Targeting. Bioconjugate Chem 2015, 26, (5), 830-838.
5. Jiang, K.; Li, W.; Li, W.; et al. Rapid multislice T1 mapping of mouse myocardium: Application to quantification of manganese uptake in alpha-Dystrobrevin knockout mice. Magn. Reson. Med. 2015, 74, (5), 1370-9.
6. Freire-de-Lima, L.; Gelfenbeyn, K.; Ding, Y., et aI. Involvement of O-glycosylation defining oncofetal fibronectin in epithelial-mesenchymal transition process. Proc Natl Acad Sci U S A 2011, 108, (43), 17690-5.
7. Albrecht, M.; Renneberg, H.; Wennemuth, G., et al. Fibronectin in human prostatic cells in vivo and in vitro: expression, distribution, and pathological significance. Histochem Cell Biol 1999, 112, (1), 51-61.
Figures