1031
Maternal and fetal glucose uptake followed by chemical exchange saturation transfer imaging (glucoCEST) on pregnant mice at 21.1T1Department of Chemical Physics, Weizmann Institute of Science, Rehovot, Israel, 2National High Magnetic Field Laboratory, Florida State University, Tallahassee, FL, United States, 3NeuroSpin Centre CEA Saclay, Gif-sur-Yvette, France, 4Department of Biological Regulation, Weizmann Institute of Science, Rehovot, Israel, 5Chemical & Biomedical Engineering Department, FAMU-FSU College of Engineering, Tallahassee, FL
Synopsis
GlucoCEST generates a contrast that is sensitive to glucose uptake and metabolism. While previously shown with tumor models, a distinct glucose metabolism is also characteristic of pregnancy. This study explores the potential of glucoCEST under this condition. Glucose was administered to pregnant mice by gavage in a manner akin to that used in human pregnancy-induced diabetes tests, and subsequently monitored in-vivo by glucoCEST at 21.1T. Distinct differences were apparent upon instituting glucose, with organ-specific glucoCEST contrast exceeding 50-70%. Notable imaging differences were noted between dame and fetuses upon glucose gavage, as well as between pregnant and non-pregnant animals.
Purpose
Glucose uptake is noticeably different in pregnant and non-pregnant females as a result of an insulin resistance developed to facilitate pregnancy-related activities and the nourishment of the fetus. In extreme cases, this resistance becomes associated with gestational diabetes, a condition that is normally tested by a glucose tolerance test—the oral admission of a concentrated glucose solution followed by the monitoring of glucose in blood levels. The measurement and real-time imaging of glucose uptake in healthy and diseased fetuses presents an opportunity to learn about the nature of these metabolic changes, and eventually help detect impaired gestational problems at an early stage. Glucose-based chemical-exchange saturation transfer (glucoCEST)1-5 provides a promising way of monitoring this process non-invasively with high spatial resolution and in real time. While challenging due to the small chemical shift separation between glucose and water NMR resonances, we show here that glucoCEST is greatly aided by its acquisition at ultrahigh fields. GlucoCEST at 21.1 T was exploited to image glucose uptake in maternal compartments and fetuses after gavage with typical glucose-tolerance test solutions. Large organ-specific magnetization transfer ratios (MTRs), often exceeding 50%, were observed. GlucoCEST MRI also revealed clear differences arising between maternal and fetal uptake as well as differential contrast among maternal organs. Further differences arose in comparisons made against non-pregnant animals.Methods
Sixteen white ICR (CD-1) (Envigo Corp, Tampa) mice were mated. At days 16 to 17 of gestation mice were anesthetized with 3% of isoflurane at 1 L/min of oxygen and gavaged with a D-glucose solution (Sigma-Aldrich, St. Louis) at a dose up to 8 mg/g of body weight. Similar experiments also were repeated with unmated females. All MRI experiments were performed with the 21.1-T ultra-wide bore NMR magnet at the US National High Magnetic Field Laboratory (NHMFL) in Tallahassee, FL. GlucoCEST measurements were carried out using RARE imaging with a FOV of 3.2x3.2 cm, TR of 2.5-4 s and TE of 23 ms. CEST profiles (Z-spectra) were recorded between +/-4 ppm off-resonance of the water signal with a step size of 0.2 ppm; additional off-resonance scans were measured at +/-6 and +/-20 ppm. Magnetization Transfer Ratio (MTR) images were calculated according to MTR(∆ω)=|(S(-∆ω)-S(+∆ω))/S0 |, with S0 set to an unsaturated reference image. MT saturation was achieved by a pulse train of 200 10-ms Gaussian pulses, which were calibrated using an on-resonance saturation to achieve complete water suppression. RF field ranged between 1.5-7 µT. In a separate study, repeated dynamic glucoCEST images (up to nine) were acquired at 1.2 and 2.4 ppm offsets for approximately 3 h following glucose gavage. All data were processed in Matlab.Results
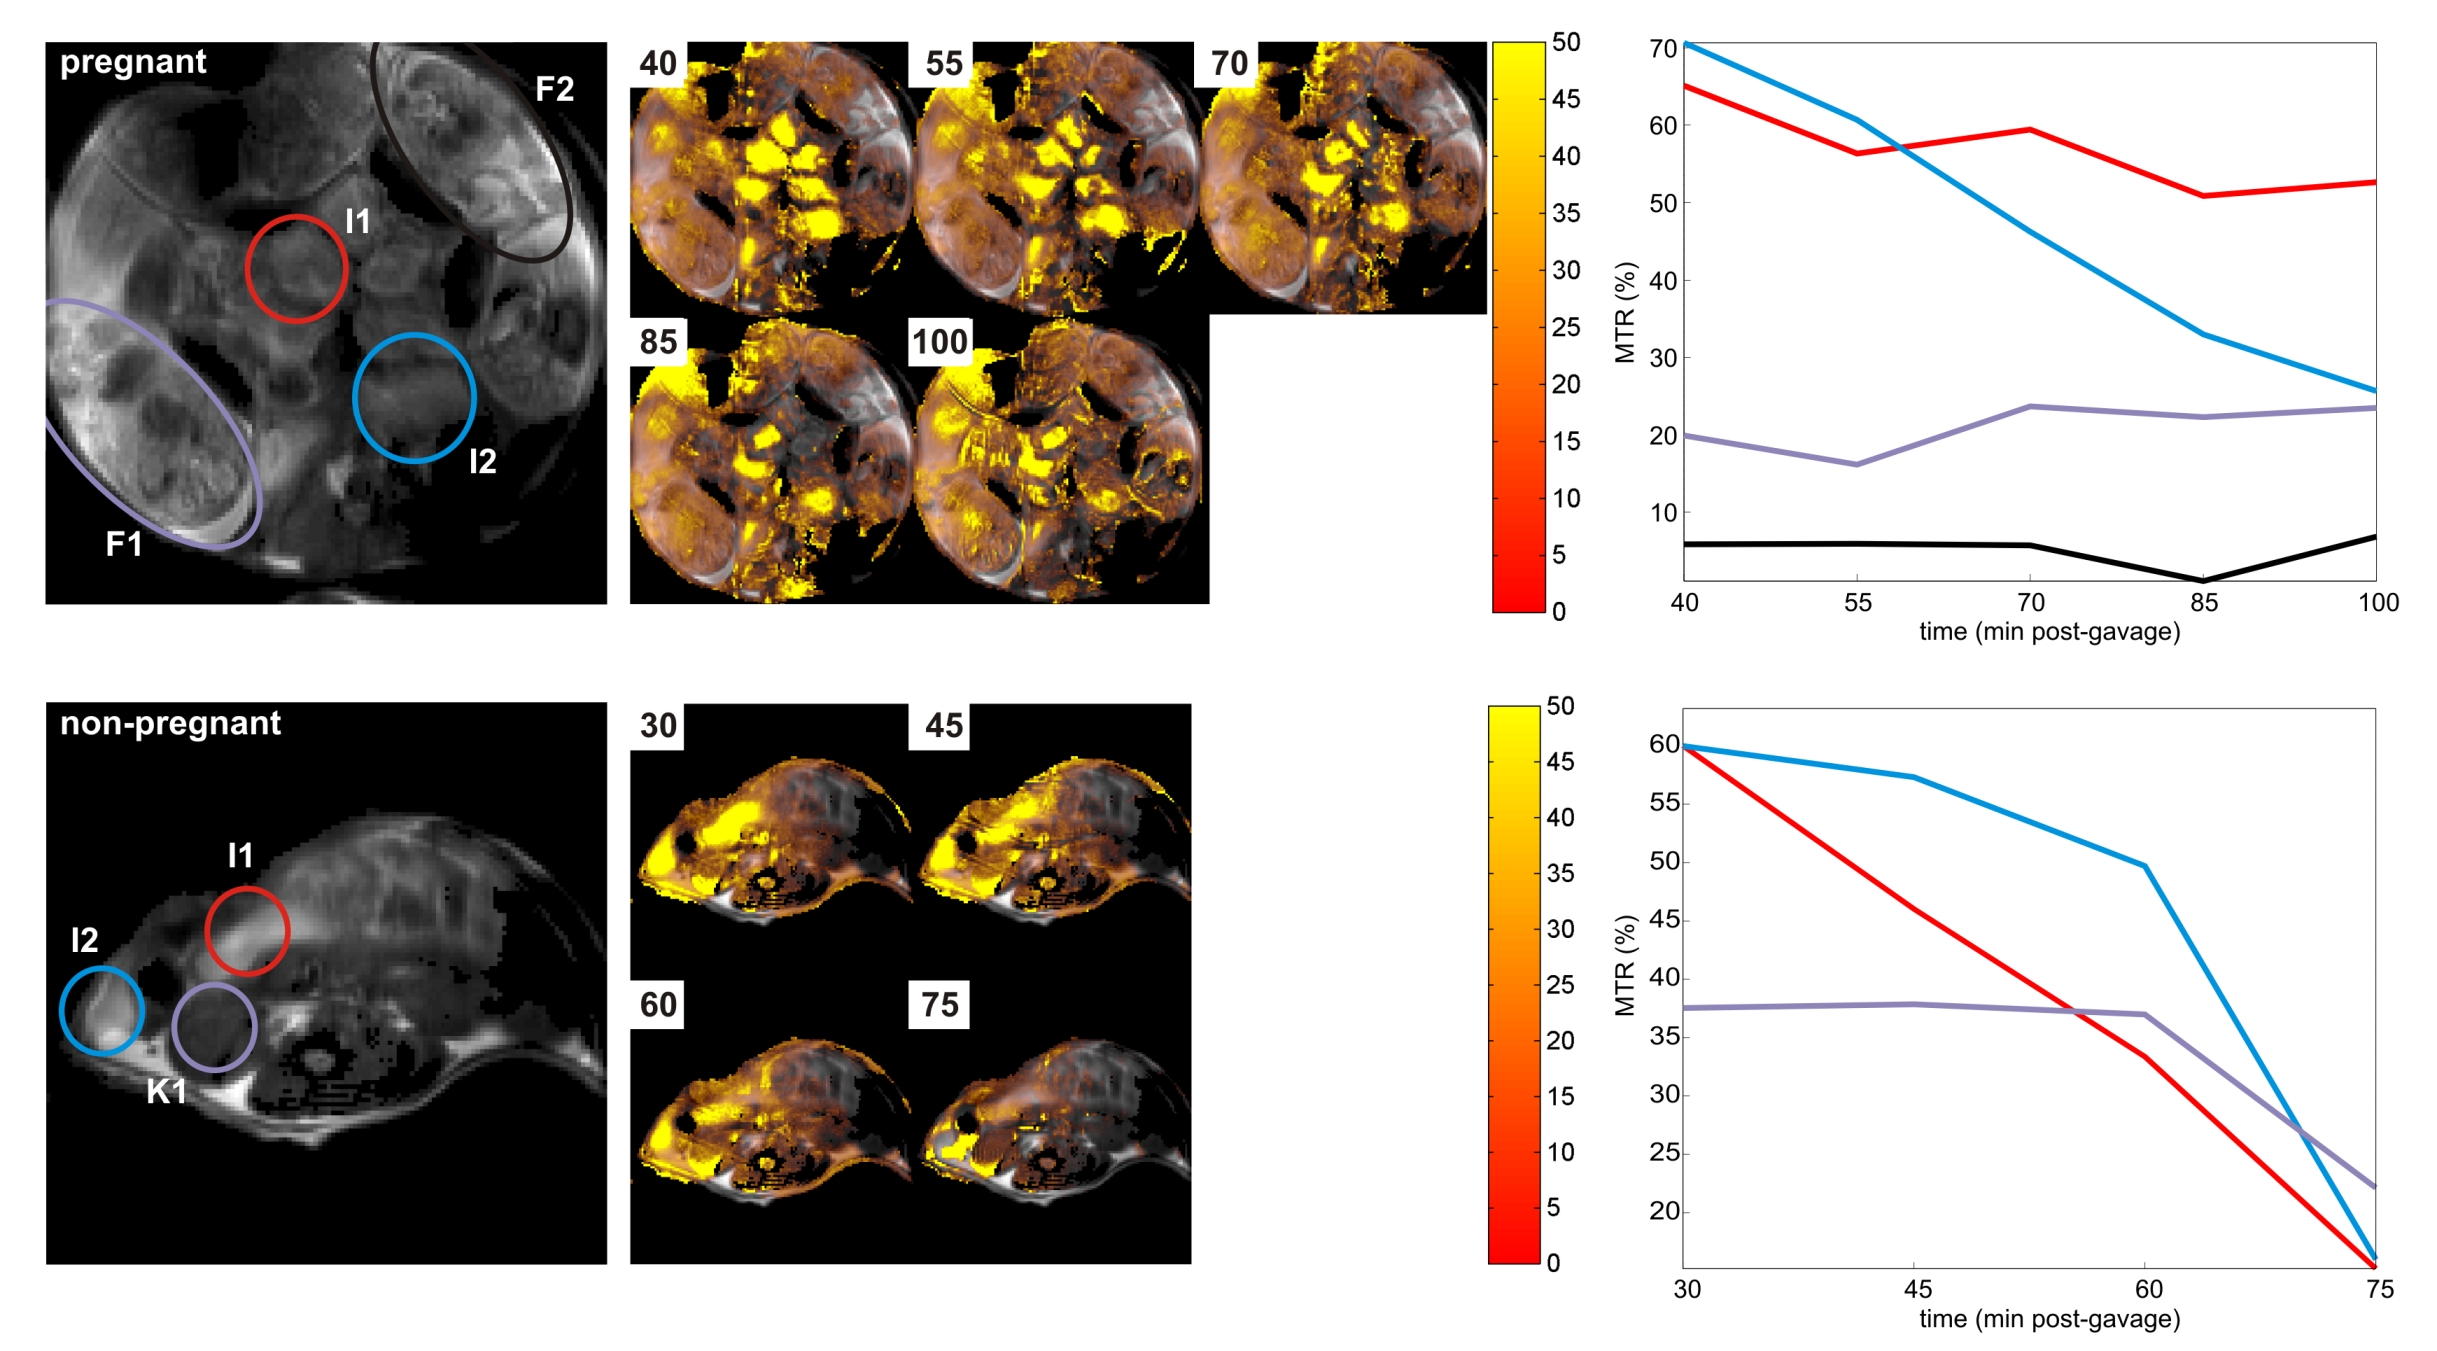
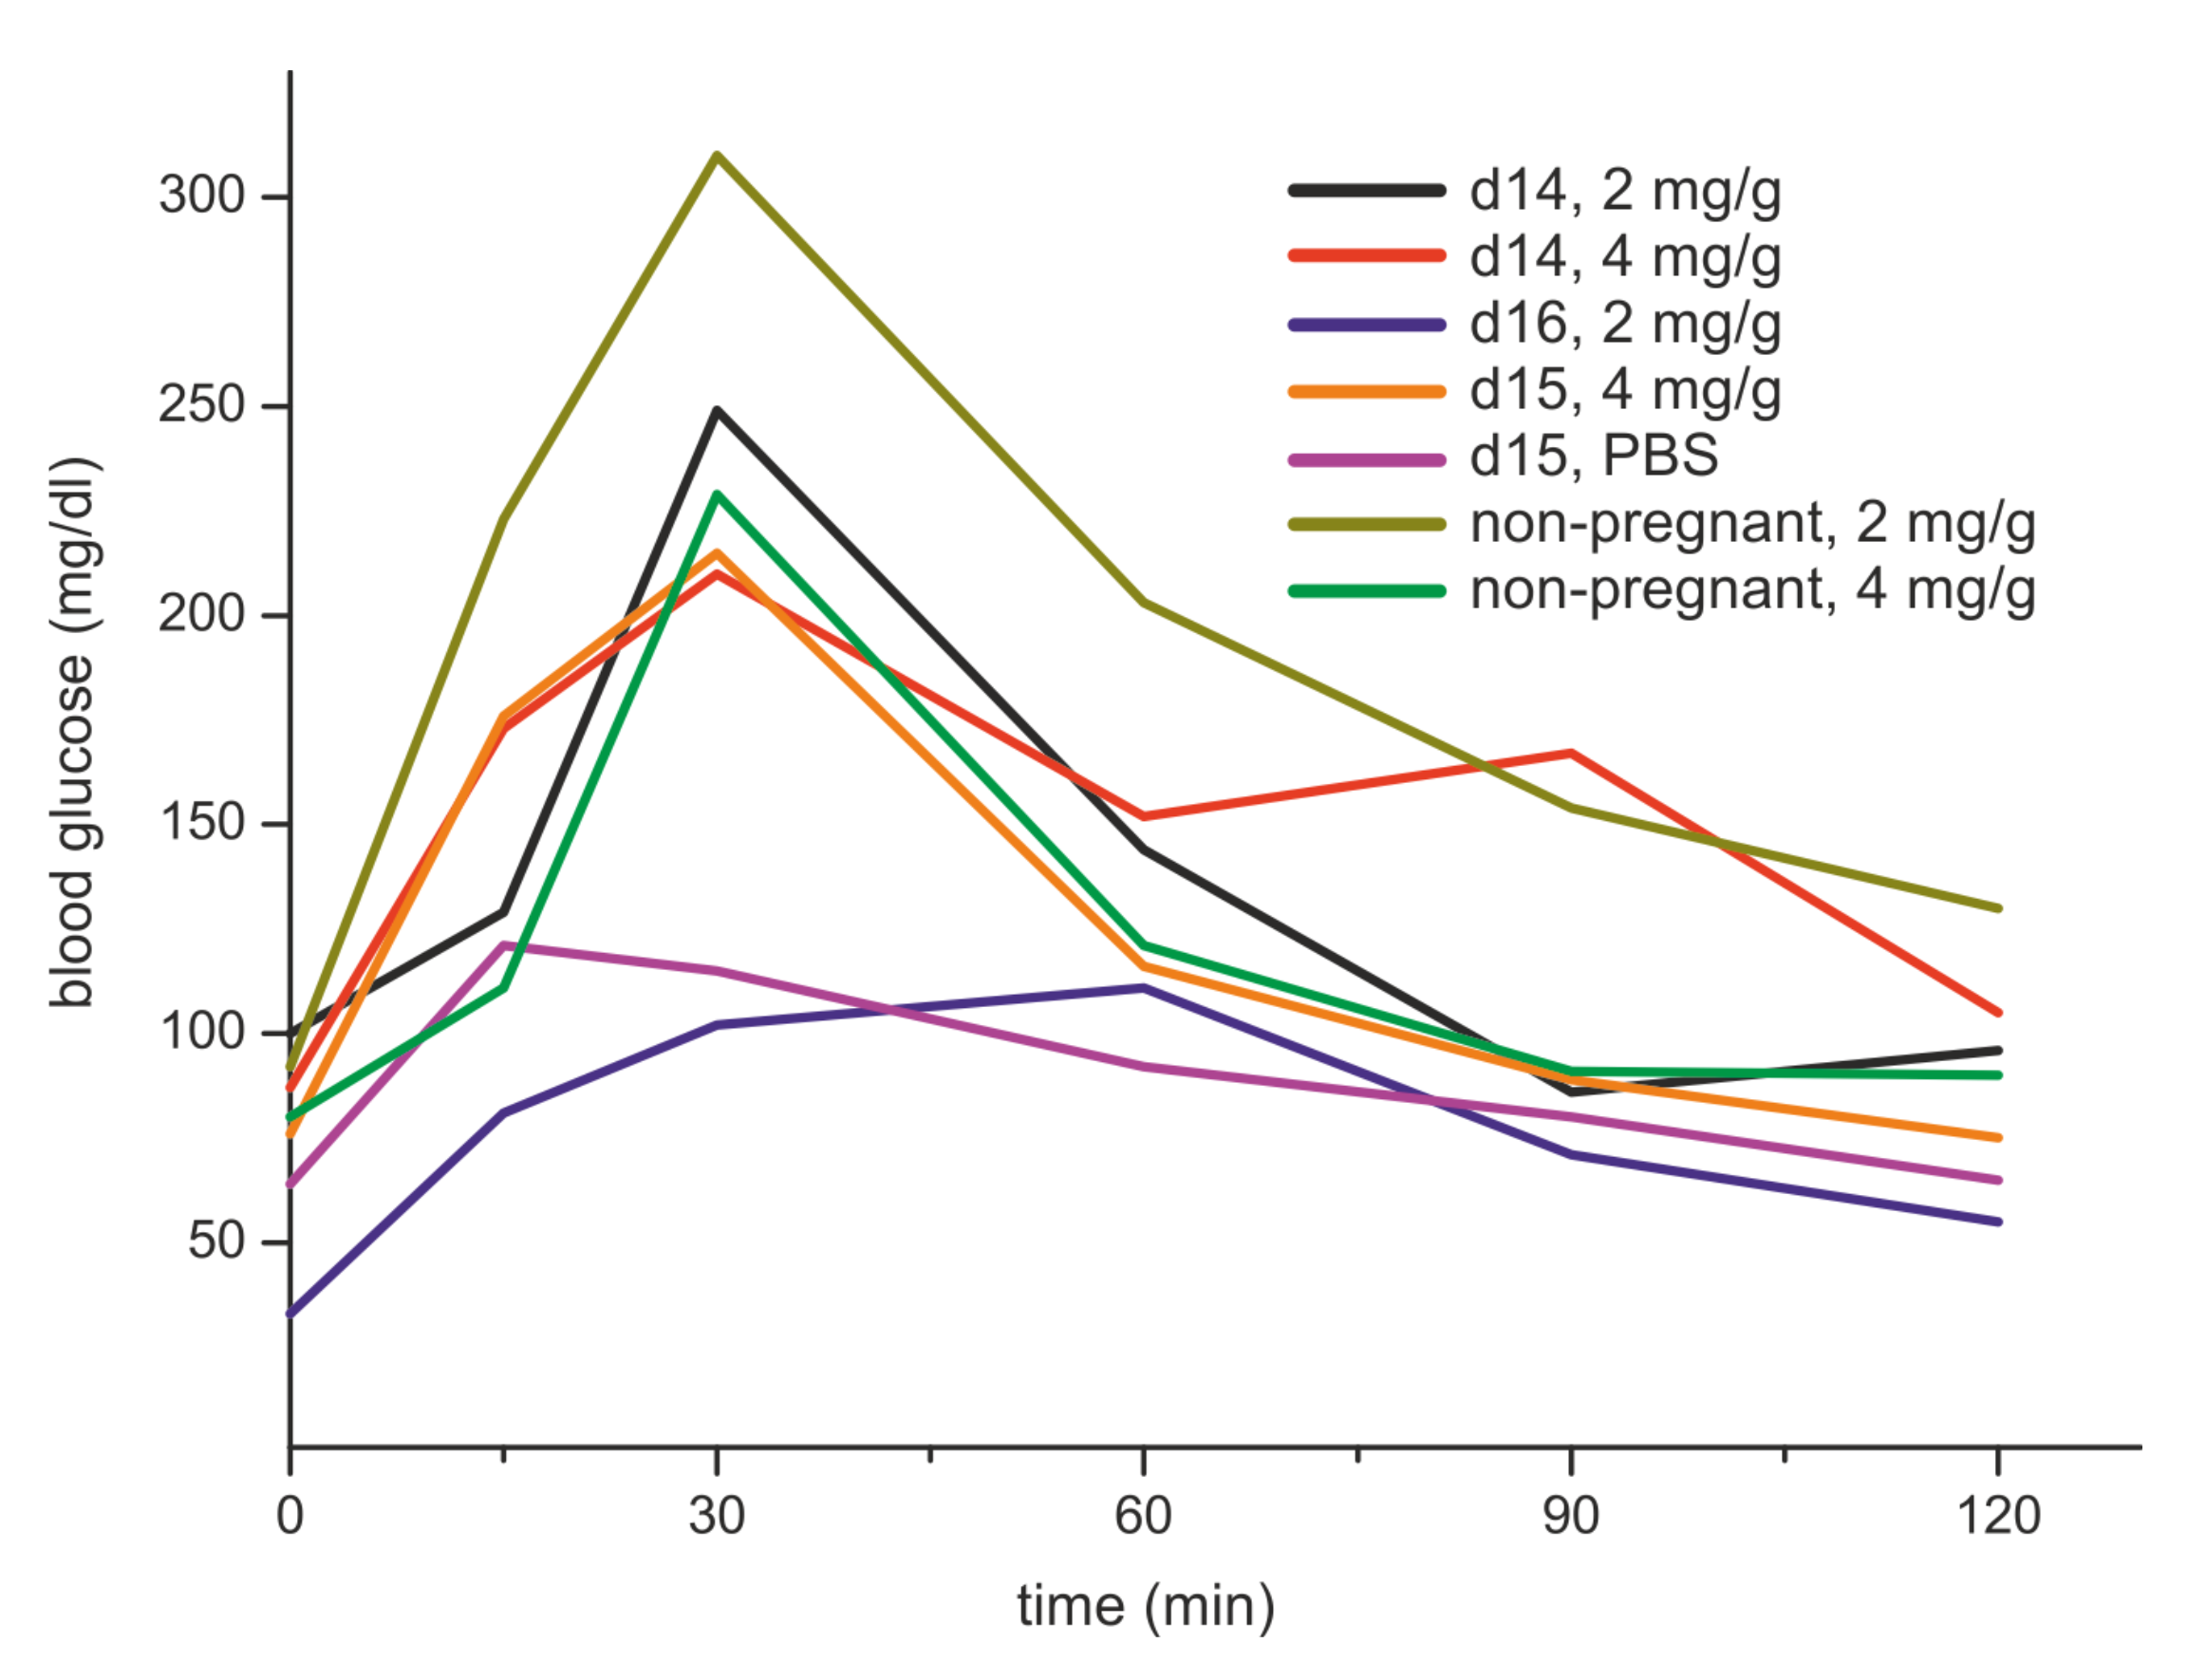
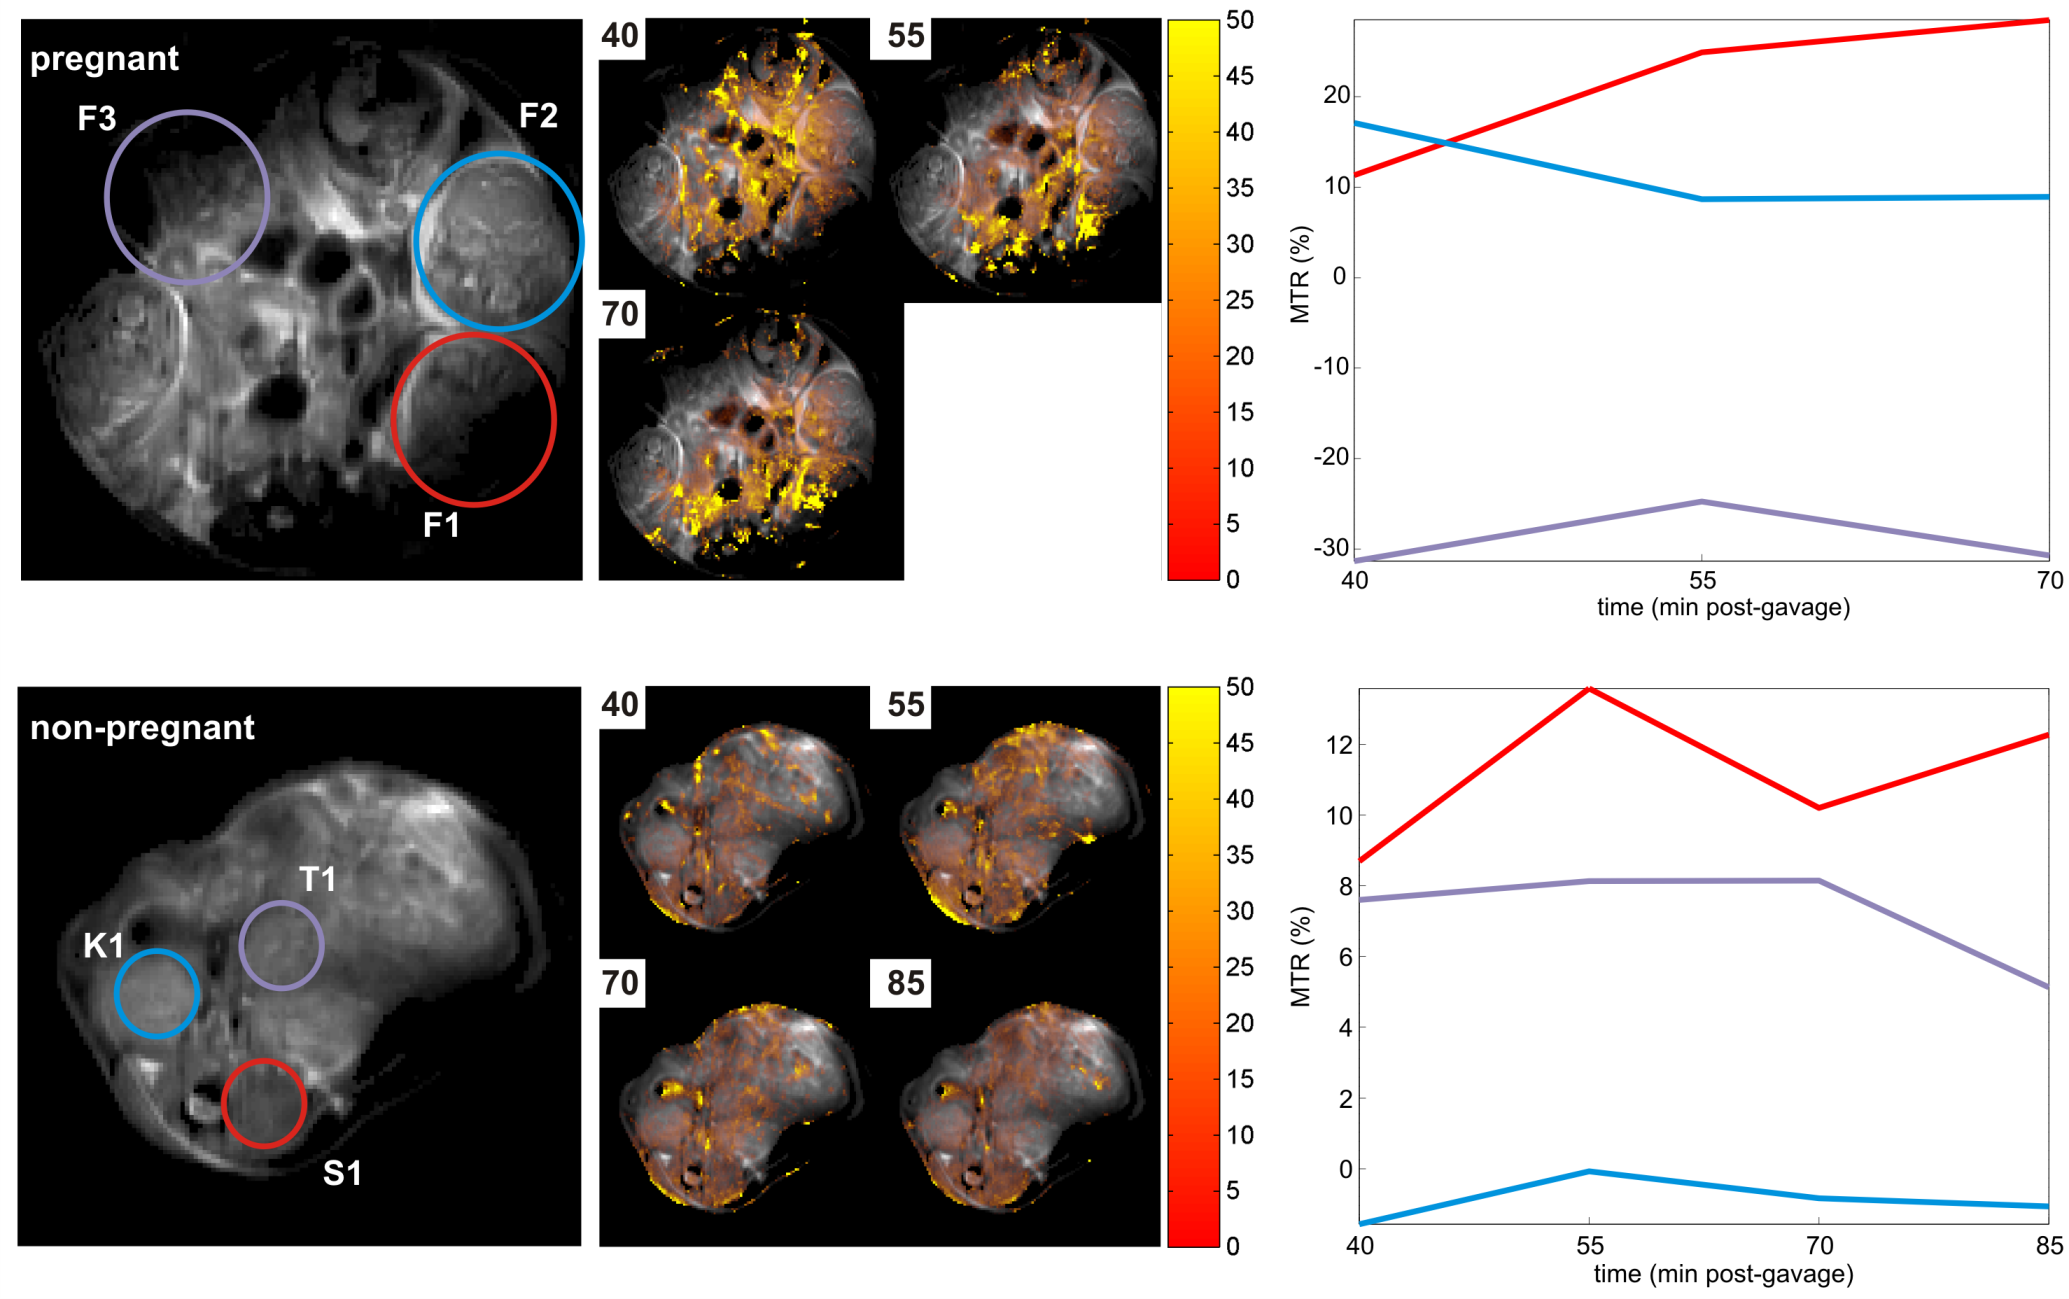
Proton RARE anatomical imaging enabled the identification of maternal/fetal compartments including the maternal kidneys, intestine, stomach and placentas; the fetuses, fetal livers and fetal hearts could also be distinguished. MTR images revealed two maxima for contrast in the fetuses: a broader peak for at a 1.2ppm offset and a narrower maximum at 2.4ppm. Consequently, glucoCEST time series with a focus on these two offsets were recorded for the duration of ≤ 3 h (Figure 1). MTRs in the maternal intestines rose upon gavage to ≥70%, with a gradual decay over time (Figure 1, top trace, blue and red regions). This behavior mimics the overall tendencies detected in a glucose measurement of blood samples extracted from the dames (Figure 2). By contrast, MTR images for fetuses remain steady with no decline in MTR, which achieved up to 25% enhancement (Figure 1, top trace, purple and black regions). In a control experiment without gavage, MTR images in fetuses were systematically smaller than in animals that underwent gavage (Figure 3). Control experiments performed in non-pregnant animals (Figure 1, bottom images) showed an even faster glucose uptake in the animal’s intestine and kidneys.Discussion & Conclusion
For the first time using MR, these measurements display the distinct, organ-specific metabolic behavior induced by pregnancy on glucose uptake. Results show strong maternal MTRs, and significantly different MTRs for maternal and fetal compartments. Thus, the methodology is suitable to study pregnant animals with placental conditions that have impaired perfusion of fetuses and/or under conditions leading to gestational diabetes. GlucoCEST might provide early detection of pregnancy-related dysfunction in a non-invasive manner–not only in rodents but also humans. Fast imaging measurements based on spatiotemporal encoding in nearly real-time at 21.1T, as well as lower fields, are underway to access kinetics at the fetal-maternal interface.Acknowledgements
This work was performed at the National High Magnetic Field Laboratory (NHMFL),which is supported by NSFDMR-1157490 and the State of Florida.This research was supported by the NHFML User Collaborations Grant Program (#5093 to SCG), Minerva Project 712277, NIH grant R01HD086323, the Kimmel Institute for Magnetic Resonance and the generosity of the Perlman Family Foundation. We thank Prof. Joel Garbow (Washington Univ) for valuable discussions.References
1. Chan KW, McMahon MT, Kato Y, Liu G, Bulte JW, Bhujwalla ZM, Artemov D, van Zijl PC.Natural D-glucose as a biodegradable MRI contrast agent for detecting cancer.MagnReson Med. 2012, 68, 1764-73.
2. Walker-Samuel S, Ramasawmy R, Torrealdea F, Rega M, Rajkumar V, Johnson SP, Richardson S, Gonçalves M, Parkes HG, Arstad E, Thomas DL, Pedley RB, Lythgoe MF, Golay X.In vivo imaging of glucose uptake and metabolism in tumors.Nat Med. 2013, 19, 1067-72.
3. Jin T, Mehrens H, Hendrich KS, Kim SG.Mapping brain glucose uptake with chemical exchange-sensitive spin-lock magnetic resonance imaging. J Cereb Blood Flow Metab.2014, 34, 1402-10.
4. Wang J, Weygand J, Hwang KP, Mohamed AS, Ding Y, Fuller CD, Lai SY, Frank SJ, Zhou J.Magnetic Resonance Imaging of Glucose Uptake and Metabolism in Patients with Head and Neck Cancer.Sci Rep. 2016, 6, 30618.
5. Schuenke P, Koehler C, Korzowski A, Windschuh J, Bachert P, Ladd ME, Mundiyanapurath S, Paech D, Bickelhaupt S, Bonekamp D, Schlemmer HP, Radbruch A, Zaiss M.Adiabatically prepared spin-lock approach for T1ρ-based dynamic glucose enhanced MRI at ultrahigh fields.MagnReson Med. 2016 Aug 13.
Figures