1029
Brain-wide Interaction of Low Frequency Hippocampal Activity with Layer-specific Cortical and Subcortical Regions: An Optogenetic Manganese-enhanced MRI Study1Laboratory of Biomedical Imaging and Signal Processing, The University of Hong Kong, Hong Kong, SAR, People's Republic of China, 2Department of Electrical and Electronic Engineering, The University of Hong Kong, Hong Kong, SAR, People's Republic of China
Synopsis
The hippocampus, including the dentate gyrus (DG), and the sensory cortices, which consist of six distinct layers, have reciprocal connections with the entorhinal cortex (EC). However, the low frequency hippocampal-cortical interactions and layer-specific cortical responses remains largely unknown. Combining the optogenetic stimulation and manganese-enhanced MRI, the present study revealed layer-specific responses of sensory cortices and EC involvement in hippocampal-cortical interactions during low frequency stimulation, but not high frequency, at dorsal DG. In summary, we demonstrated an effective combination of optogenetic stimulation and manganese-enhanced MRI to uncover the frequency-dependent and cortical layer-specific responses involved in brain-wide interactions.
Purpose
The hippocampus (HP), including dentate gyrus (DG), can exert large-scale influences on neocortical activities via hippocampal-cortical connections1. Our recent preliminary studies combining optogenetics and fMRI indicated that low frequency optogenetic stimulation of dorsal DG (dDG) excitatory neurons evoked long-range cortical and subcortical responses2, and enhanced rsfMRI connectivity in the bilateral hippocampal network and the sensory cortical networks3. The sensory cortices consist of six distinct layers4-10. The delineation of the layer-specific cortical responses evoked by low frequency hippocampal optogenetic stimulation could provide further insights into the hippocampal-cortical networks. Meanwhile, the HP and neocortex are connected via the entorhinal cortex (EC)4, yet, low frequency hippocampal-cortical signal propagation involving EC remains unknown. Manganese-enhanced MRI (MEMRI) is a technique for neuronal connections tracing with a high spatial fidelity11,12. In this study, we investigate whether an approach combining optogenetic stimulation and MEMRI could help uncover the hippocampal-cortical interactions and the layer-specific cortical responses that are evoked by low frequency hippocampal optogenetic excitation.Methods
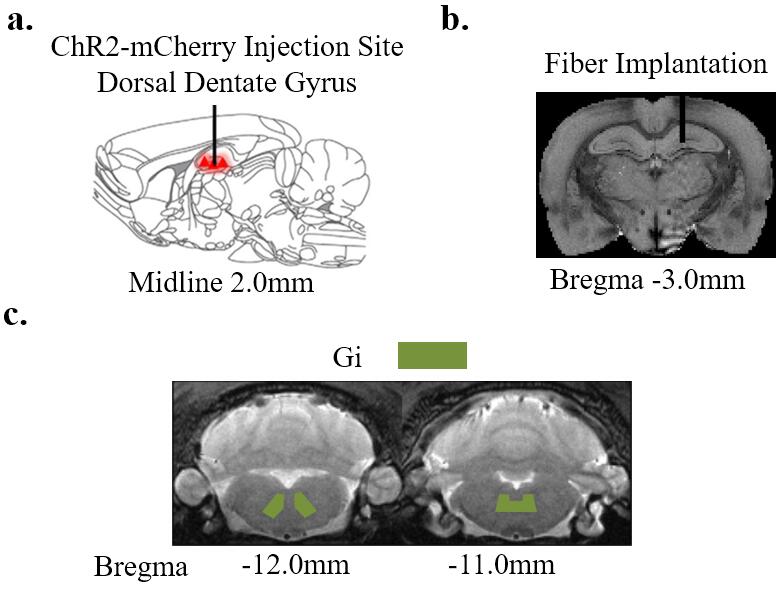
Animal Preparation and Optogenetic Stimulation: Sprague-Dawley (SD) adult male rats (N=13 200-250 g) were divided into two groups. Six rats were injected AAV5-CaMKIIa::ChR2(H134R)-mCherry to right dDG. Four weeks after injection, an optic fiber was implanted (diameter=450 μm) at the injection site (Figure 1a-b). Animals were rest for one week before they were injected intraperitoneally with 100mM solution of MnCl2 (60 mg/kg). Four hours of 1 Hz (N=4) blue light (473 nm, 10% duty cycle, 40 mW/mm2) optogenetic stimulation was presented in block-designed manner (10 mins on, 10 mins off). Similarly, 40 Hz (N=2) optogenetic stimulation was presented such that the number of pulses delivered in a block is the same with 1 Hz optogenetic stimulation. Remaining 7 rats served as control animals which were only intraperitoneally injected MnCl2 without optogenetic preparation.
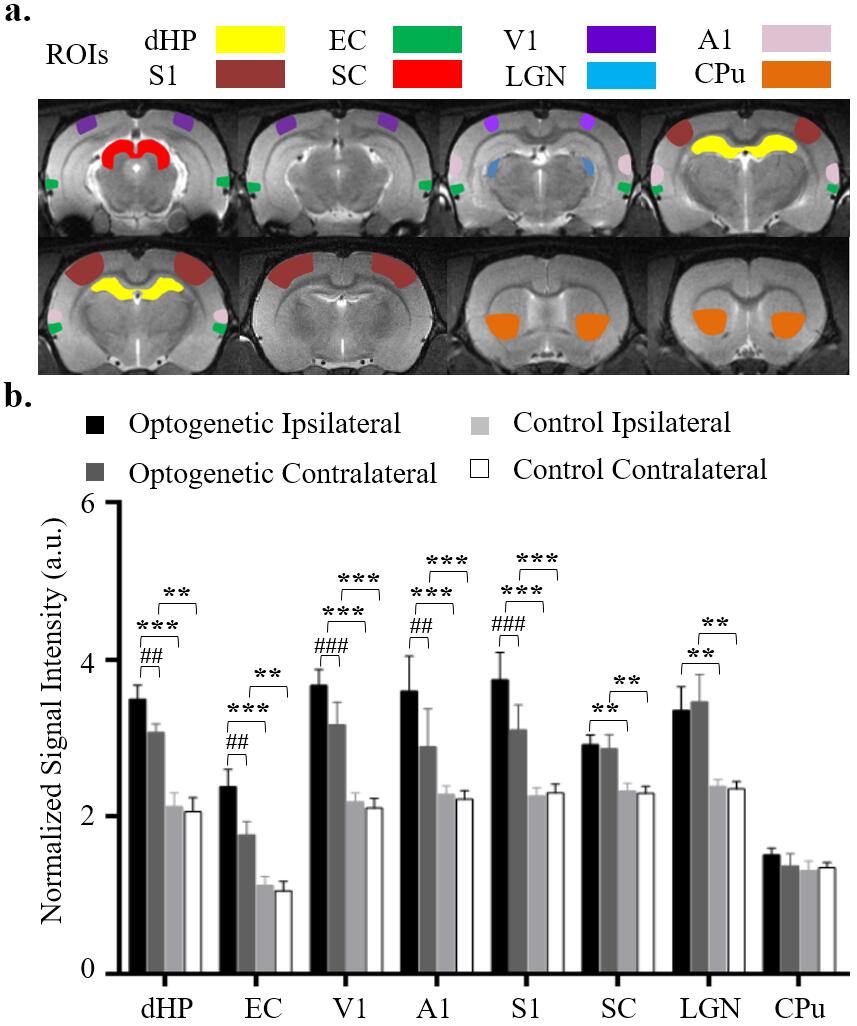
MEMRI Protocol and Data Analysis: Twelve hours after MnCl2 injection, modified driven equilibrium Fourier transform (MDEFT) images (TR/TE=4000/4.2 ms, Flip Angle=10°, FOV=3.2x3.2 cm2, matrix=256x256, sixteen 1 mm slices without slice gap) were acquired at 7T Bruker scanner. Regions of interest (ROI) were defined based on the rat brain atlas (Figure 3a). Signal intensities extracted from the ROIs were normalized to gigantocellular reticular nucleus (Gi) which had relatively less uptake than other regions in the brain.
Results
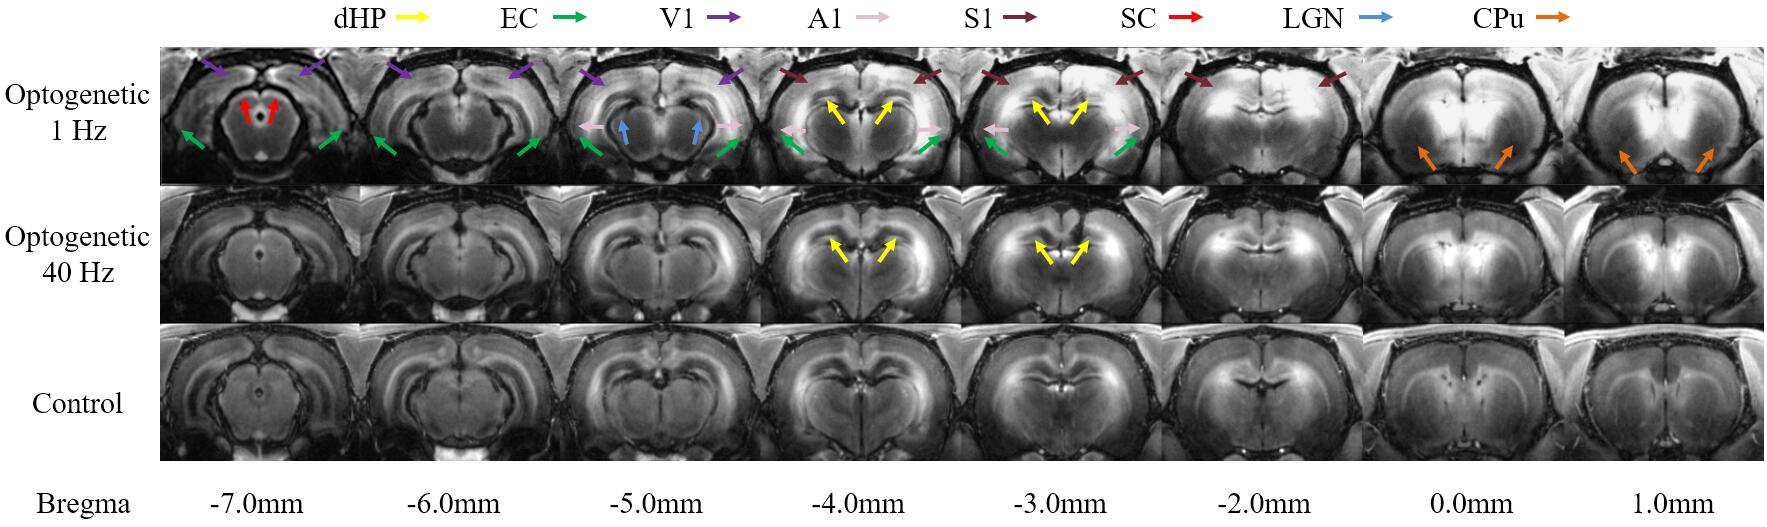
Figure 2 showed the representative MDEFT images 12 hours post MnCl2 injection upon 1Hz and 40Hz optogenetic stimulation as well as control. Mn-enhancement was found in dorsal hippocampus (dHP), EC, primary visual cortex (V1), primary auditory cortex (A1), primary somatosensory cortex (S1), superior colliculus (SC) and lateral geniculate nucleus (LGN) upon 1Hz optogenetic stimulation, whereas Mn-enhancement was mainly observed in dHP for 40Hz optogenetic stimulation.
Figure 3 showed 1 Hz optogenetic stimulation induced higher Mn-enhancement in the ipsilateral dHP and primary sensory cortex than the contralateral side, while SC and LGN did not show significant bilateral difference.
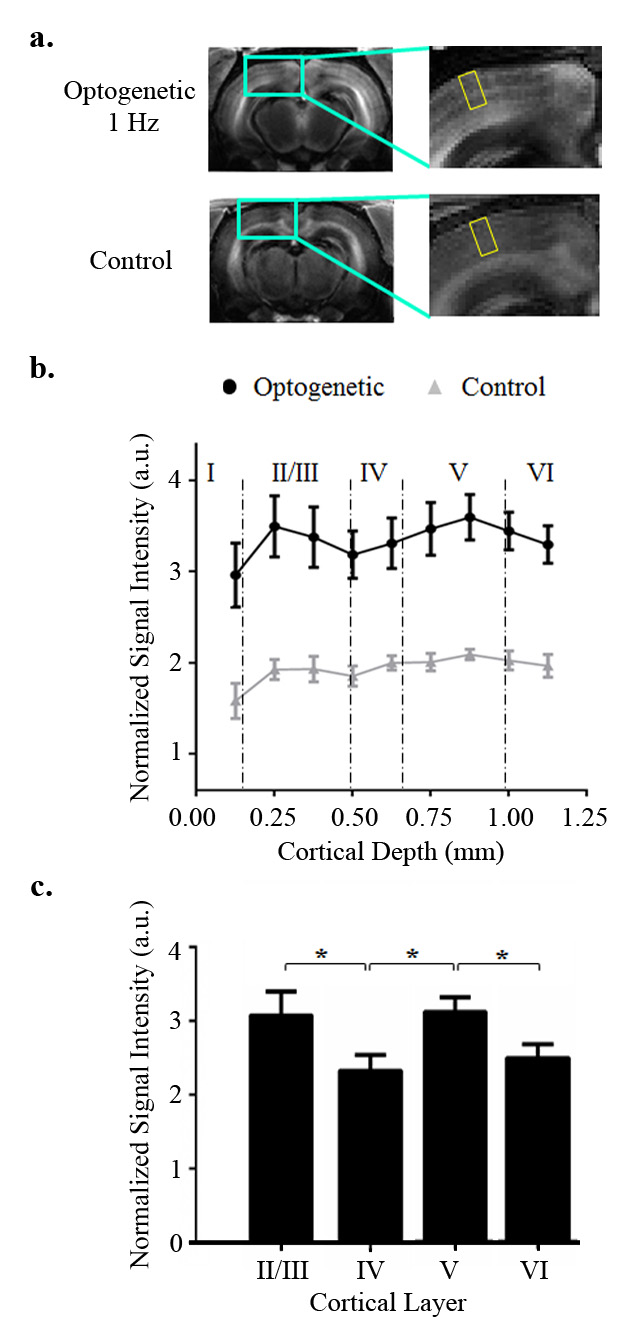
Figure 4 presented the distinct cortical layer-specific enhancement in optogenetic rats upon 1 Hz optogenetic stimulation. The signal profile in V1 revealed that Mn-enhancement peaked at layers 2/3 and 5 compared to layer 4.
Discussion and Conclusion
The present study mapped the frequency-dependent and cortical layer-specific Mn-enhancement in the brain upon optogenetic stimulation of the dDG excitory neurons. For both low and high frequency optogenetic stimulation in the ipsilateral DG, evoked hippocampal responses can propagate to the contralateral hippocampus via hippocampal commissure. Mn-enhancement was induced in the bilateral dHP by both frequencies of optogenetic excitation, echoed by the functional relevance of manganese being a calcium analogue. In particular, the present study revealed that manganese uptake in bilateral EC, and the sensory cortices including V1, A1 and S1 was higher after low frequency stimulation. These results might reflect the initiated low frequency hippocampal responses propagation towards the neocortex via the EC, but not the high frequency responses. While the results are in line with our previous preliminary studies by BOLD fMRI and local field potential (LFP)2,3, the Mn-enhancement also demonstrated the involvement of EC in low frequency hippocampal-cortical signaling. Additionally, layer-specific Mn-enhancement demonstrated that layers 2/3 and 5 might be actively involved in such low frequency hippocampal-cortical signaling. The layer-specific Mn-enhancement in the neocortex, LGN and SC might reflect intracortical sensory processing5 and downstream sensory propagation. Taken together, our work demonstrated that the combination of optogenetic stimulation and MEMRI is a viable approach to revealing the frequency-dependent and cortical layer-specific responses involved in hippocampal-cortical interactions.Acknowledgements
No acknowledgement found.References
1 Ji, D. & Wilson, M. A. Coordinated memory replay in the visual cortex and hippocampus during sleep. Nature neuroscience 10, 100-107 (2007).
2 Chan, R. W. et al. Intrahippocampal and Hippocampal-Cortical Interactions Driven by Frequency Specific Optogenetic Stimulation. ISMRM, 0133 (2015).
3 Chan, R. W. et al. Low Frequency Optogenetic Stimulation of Dentate Gyrus Enhances Brain Functional Connectivity Revealed by Resting-State fMRI. ISMRM, 0311 (2016).
4 Buzsáki, G. The hippocampo-neocortical dialogue. Cerebral cortex 6, 81-92 (1996).
5 Sun, W. & Dan, Y. Layer-specific network oscillation and spatiotemporal receptive field in the visual cortex. Proceedings of the National Academy of Sciences of the United States of America 106, 17986-17991, doi:10.1073/pnas.0903962106 (2009).
6 Silva, L. R., Amitai, Y. & Connors, B. W. Intrinsic oscillations of neocortex generated by layer 5 pyramidal neurons. Science 251, 432-435 (1991).
7 Thomson, A. M. & Bannister, A. P. Interlaminar connections in the neocortex. Cereb Cortex 13, 5-14 (2003).
8 Douglas, R. J. & Martin, K. A. Neuronal circuits of the neocortex. Annu Rev Neurosci 27, 419-451, doi:10.1146/annurev.neuro.27.070203.144152 (2004).
9 Thomson, A. M. Neocortical layer 6, a review. Frontiers in neuroanatomy 4, 13, doi:10.3389/fnana.2010.00013 (2010).
10 Canto, C. B., Wouterlood, F. G. & Witter, M. P. What does the anatomical organization of the entorhinal cortex tell us? Neural plasticity 2008, 381243, doi:10.1155/2008/381243 (2008).
11 Silva, A. C., Lee, J. H., Aoki, I. & Koretsky, A. P. Manganese-enhanced magnetic resonance imaging (MEMRI): methodological and practical considerations. NMR in biomedicine 17, 532-543, doi:10.1002/nbm.945 (2004).
12 Chan, K. C. et al. In vivo visuotopic brain mapping with manganese-enhanced MRI and resting-state functional connectivity MRI. Neuroimage 90, 235-245, doi:10.1016/j.neuroimage.2013.12.056 (2014).
Figures