1028
A gene reporter detected using MRI measurements of reporter-mediated increases in transmembrane water exchange1Cancer Research UK Cambridge Institute, University of Cambridge, Cambridge, United Kingdom, 2Wellcome Trust-Medical Research Council Stem Cell Institute and Department of Clinical Neurosciences, University of Cambridge
Synopsis
Non-invasive imaging of gene expression can be used to track cells in vivo but often requires the addition of an exogenous contrast agent that may have limited tissue access. We show that the urea transporter (UT-B) can be used as a gene reporter, where reporter expression was detected using 1H MRI measurements of UT-B-mediated increases in plasma membrane water exchange. AXR values measured in UT-B-expressing HEK cell xenografts, were significantly higher compared with non-expressing controls. Transduction of rat brain cells with a lentiviral vector expressing UT-B resulted in a ≈ 2-fold increase in AXR at the site of virus injection.
Purpose
Most imaging gene reporters are receptors, enzymes, or membrane transporters that generate image contrast by interaction with an exogenous imaging agent1. Imaging reporter expression in vivo could be used in the clinic to monitor delivery of gene therapy vectors or for cell tracking in regenerative medicine and in immunotherapy2-4. Compared with direct labelling approaches that preload cells with contrast agents, gene reporters have the advantage that first, their signal enhancements arise from functional proteins that are indirectly reporting on cell viability and second, the signal is not diluted after cell division. Here, we show that expression of the urea transporter UT-B is detectable by MRI measurements of water exchange across the plasma membrane, thus allowing imaging of gene expression.Methods
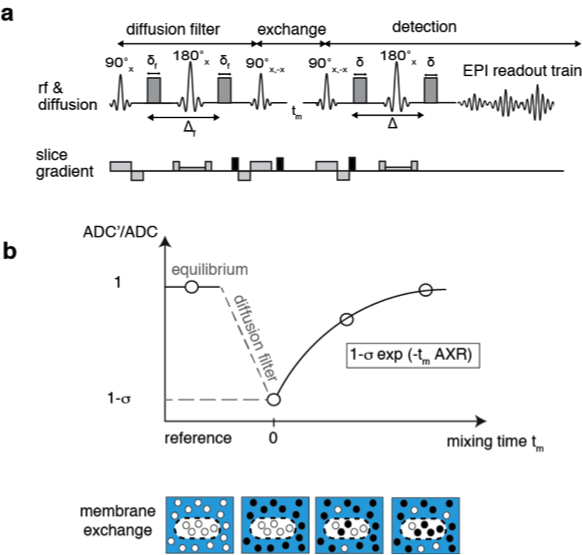
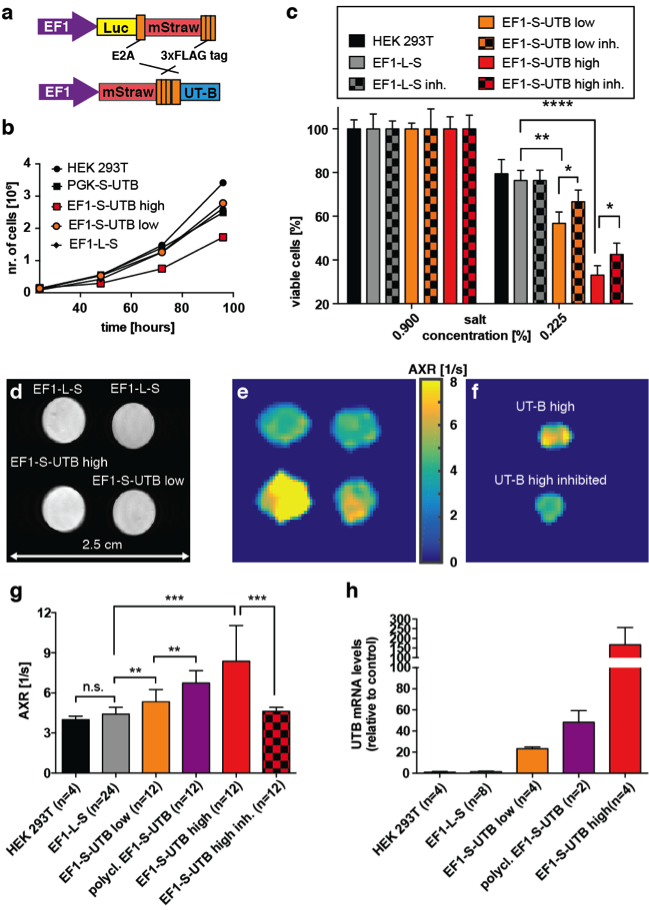
An exchange-sensitive filter-exchange imaging (FEXI)5 sequence (Fig.1) was optimized on a 9.4 T horizontal bore small animal MRI scanner (Agilent) using a transmit-receive Millipede™ coil. HEK 293T cells were transduced with a vector co-expressing luciferase and the red fluorescent protein, mStrawberry, or mStrawberry and UT-B. We used these cells to derive six different cell lines, five of which expressed different amounts of UT-B. Lines included a monoclonal control cell line expressing Luciferase and mStrawberry (EF1-L-S), a polyclonal line expressing mStrawberry and UT-B (polyclonal EF1-S-UTB), and monoclonal populations isolated using single-cell-sorting for low and high mStrawberry expression, co-expressing low and high levels of UT-B (EF1-S-UTB low, and EF1-S-UTB high) respectively. We also used the previously described PGK-S-UTB cell line6. We confirmed UT-B expression by qPCR and UT-B function using a functional cell-swelling assay and in vitro MRI. Xenograft bearing animals were imaged using FEXI, IR-TFLASH for T1 mapping, and DWI-EPI for ADC measurements with respiratory gating. Fluorescence and bioluminescence imaging was performed 2–3 weeks post cell implantation and immediately before the MRI measurements using an IVIS-200 camera. Rat brain cells were transduced in vivo by direct intracranial injection of lentiviruses. MRI of rat brains was performed with the same protocol as described above but on a 7 T horizontal bore scanner using a 72 mm transmit coil with a rat head quadrature receive coil using a FOV of 4cm x 4cm. In vivo FEXI parameters were: diffusion filter b-values (bf=(0;700)s/mm2; detection b-values b=(36;517)s/mm2; mixing times (acquired interleaved) tmix=(0.01;0.1;0.2;0.3)s; Δ=0.012 ms; δ=0.08 ms; total acquisition time was ca. 15 min.Results and Discussion
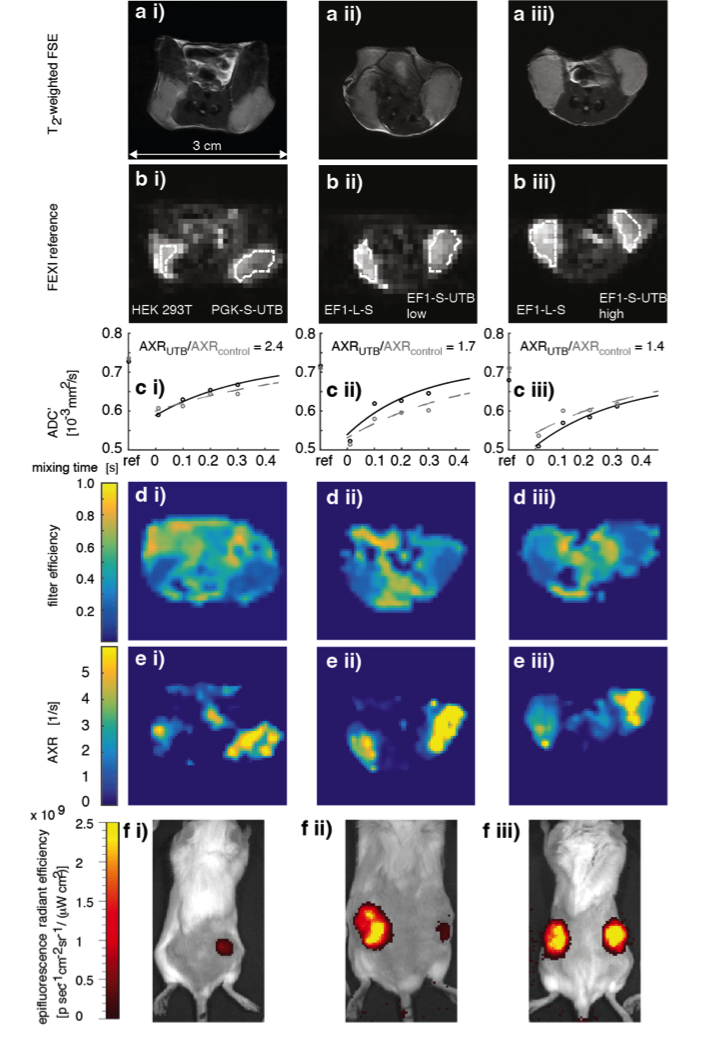
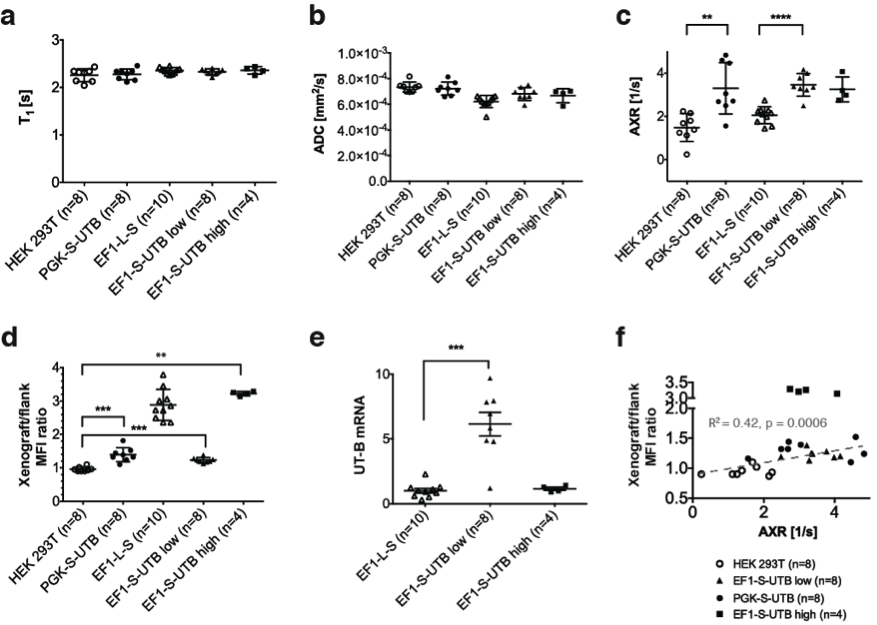
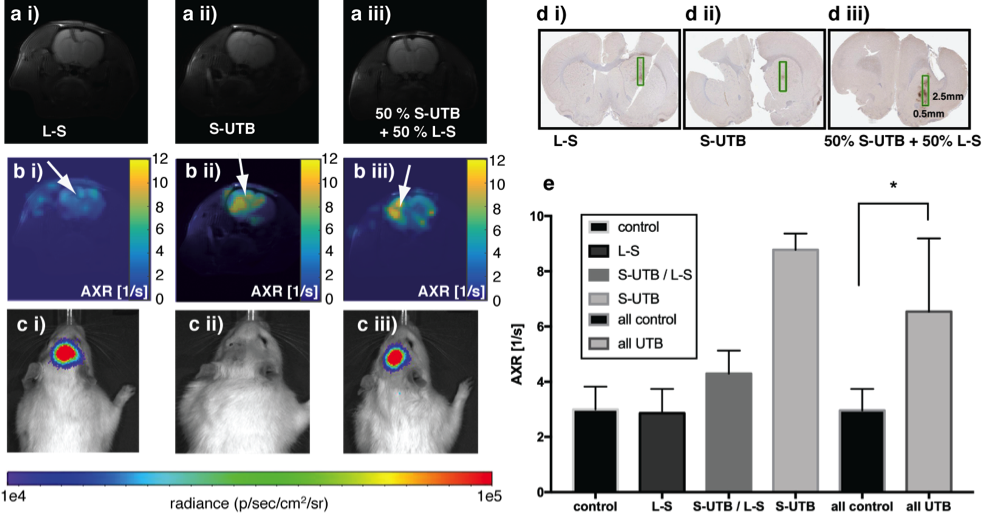
In vitro MRI experiments of transfected HEK cells expressing UT-B in different amounts show an increase in the apparent water exchange rate (AXR) that correlates with the levels of UT-B mRNA as detected by real-time PCR and UT-B mediated cell swelling in a functional cell assay (Fig.2). Three representative in vivo animal datasets including the respective AXR and filter efficiency (FE) maps are presented in Fig.3. Mean AXR values in the UT-B-expressing xenografts were significantly higher (p<0.005, unpaired Mann-Whitney-Wilcoxon test) compared to controls. Fluorescence imaging confirmed expression of the UT-B transgene, which was co-expressed with the mStrawberry transgene. T1 and ADC values did not show significant differences between UT-B expressing and control xenografts (Fig.4a,b), whereas AXR and fluorescence measurements consistently detected transgene expression (Fig.4c,d). Remarkably, MRI measurements of AXR had a similar sensitivity to the fluorescence measurements for detecting transgene expression, with the caveat that red fluorescence is typically detected from penetration depths up to a few millimetres, whereas the MRI measurements were collected from a 3 mm thick slice. After injection of lentiviruses encoding mStrawberry and UT-B, there was a ≈ 2-fold increase in AXR at the site of injection of lentivirus encoding S-UTB when compared with controls that received only the L-S virus (n = 6 animals, n = 2 per injection, Fig.5a,b). Viral transduction was confirmed in the animals that received the L-S virus by bioluminescence imaging of luciferase expression (Fig.5c) and by histological staining for mStrawberry in all rats (Fig.5d). ROI analysis of the needle track, observed in the T2-weighted images (Fig.5a), and an ROI on the contralateral side of the brain confirmed an increase in AXR in brain regions injected with virus encoding for UT-B (Fig.5e).Conclusion
In summary, we report that UT-B can be used as a contrast agent-free, gene reporter for MRI that relies on endogenously generated contrast, and whose expression is detected by increases in transmembrane water exchange. The UT-B reporter could be applied to track cells non-invasively, to analyse cellular differentiation states in vivo or to monitor the delivery and expression of gene therapy vectors.Acknowledgements
This work was supported by a Cancer Research UK Programme grant to KMB (17242) and by the CRUK-EPSRC Imaging Centre in Cambridge and Manchester (16465). FS is in receipt of funding from the Alexander von Humboldt Foundation in the form of a Feodor Lynen Research Fellowship. We thank Stephen Patrick for the PGK-S-UTB cell line and his help with the UT-B functional assay and Davina Honess and Dominick McIntyre for helpful suggestions and support with the MRI experiments. We thank Mateusz Strzelecki for cell sorting (Flow Cytometry Facility, Cancer Research UK CI), and the Histopathology Facility and the BRU unit (Cancer Research UK CI) for their help.References
1. Weissleder R, Moore A, Mahmood U, et al. In vivo magnetic resonance imaging of transgene expression. Nat Med. 2000;6(3):351-355.
2. Kircher MF, Gambhir SS and Grimm J. Noninvasive cell-tracking methods. Nat Rev Clin Oncol. 2011;8(11):677-688.
3. Ahrens, ET and Bulte JW. Tracking immune cells in vivo using magnetic resonance imaging. Nat Rev Immunol. 2013;13(10):755-763.
4. Lyons SK, Patrick PS and Brindle KM. Imaging mouse cancer models in vivo using reporter transgenes. Cold Spring Harb Protoc. 2013;8:685-699.
5. Nilsson M, Latt J, van Westen D et al. Noninvasive mapping of water diffusional exchange in the human brain using filter-exchange imaging. Magn Reson Med 2013;69(6):1573-1581.
6. Patrick PS, Kettunen MI, Tee SS et al. Detection of transgene expression using hyperpolarized 13C urea and diffusion-weighted magnetic resonance spectroscopy. Magn Reson Med. 2015;73(4):1401-1406.
Figures