1027
Quantitative four-dimensional motility tracking of individual immune cells in living mouse brain1Biofunctional Imaging, WPI Immunology Frontier Research Center, Osaka University, Suita, Osaka, Japan, 2Center for Information and Neural Networks, National Institute of Information and Communications Technology and Osaka University, 3Graduate School of Engineering, University of Hyogo, 4Graduate School of Simulation Studies, University of Hyogo
Synopsis
Improved imaging techniques are being used to broaden the scope and better understanding of the complex cell behaviours in the body. Nonetheless, the migratory behavior of immune cells after CNS injury is still poorly understood. In this study, we employed four-dimensional (4D) MRI to monitor the dynamic migration of infiltrating monocytes/macrophages in the living mouse brain. Our results demonstrate the possibility of non-invasive long-term monitoring of individual live cells. Moreover, this innovative technique furthers our understanding of the cellular mechanisms occurring in the normal and injured brain tissues.
Significance
For decades, any involvement of circulating immune cells in CNS had been completely denied. Only recently has their important role in CNS homeostasis received appreciation. For the first time, here we show that with 4D MRI we can monitor the dynamic migration of infiltrating monocytes/macrophages in the living mouse brain. Our results raise the possibility of non-invasive long-term monitoring of individual live cells. Moreover, this new technique broadens our knowledge of the cellular mechanisms in the normal and injured brain tissues.Background
Cellular tracking is mostly achieved by optical microscopy using fluorescent markers.1 However, it is impossible to obtain images at tissue depths exceeding ~0.5 mm, particularly in the in-vivo brain. MRI offers advantages over other modalities in its ability to provide three-dimensional (3D) images at a high spatial resolution, as well as longitudinal information without any surgical invasions. This has led to a growing interest in MRI as a technique to detect and track live cells in the body, particularly in the brain. Previously, we reported that by combining MRI with superparamagnetic iron oxide particles (SPIO) we were able to track individual monocytes/macrophages in the living mouse brain.2,3 Here, we performed high spatial resolution 3D and time-resolved (four-dimensional, 4D) MRI to monitor intrinsic individual monocytes/macrophages non-invasively. Additionally, we ran a 4D quantitative analysis to delineate their recruitment and migration patterns in a mouse brain with or without ischemic damage.Methods
To label the intrinsic monocytes/macrophages,4 we injected SPIO (Resovist, 0.25 mmol Fe/kg body weight) into the tail vein of six adult male C57BL/6 mice. Six hours after SPIO administration, we induced a permanent middle cerebral artery occlusion (pMCAO).5 After 24 hours of SPIO injection (18 hours after pMCAO), a conventional T2-weighted (T2W) RARE image was taken to estimate the ischemic infarction. The mice in which there were no abnormalities in T2W after pMCAO were excluded from further experiments. To make the time-lapse cellular-tracking movie, we repeated a T2*W scan every 6 minutes for 10 hours (100 frames) for each mouse brain. Image resolution was 59×59×300 μm3 for T2W and 59×59×100 μm3 for T2*W. Automated 3D registration and brain extraction were done with VivoQuant (InviCRO, USA). All images were inverted black and white values using ImageJ (NIH, USA). 3D/4D visualization and quantitative analysis were performed with IMARIS (Bitplane, Switzerland), and the trajectories of each cell were calculated from the obtained position coordinates using MATLAB (Mathworks, USA). All animals were anesthetized with isoflurane during each MRI session and their heads placed in a custom 15-mm inner diameter transmit/receive volume RF coil (Takashima Seisakusho, Japan). MRI was run on an 11.7T AVANCE II vertical bore system (Bruker, Germany).Results and Discussion
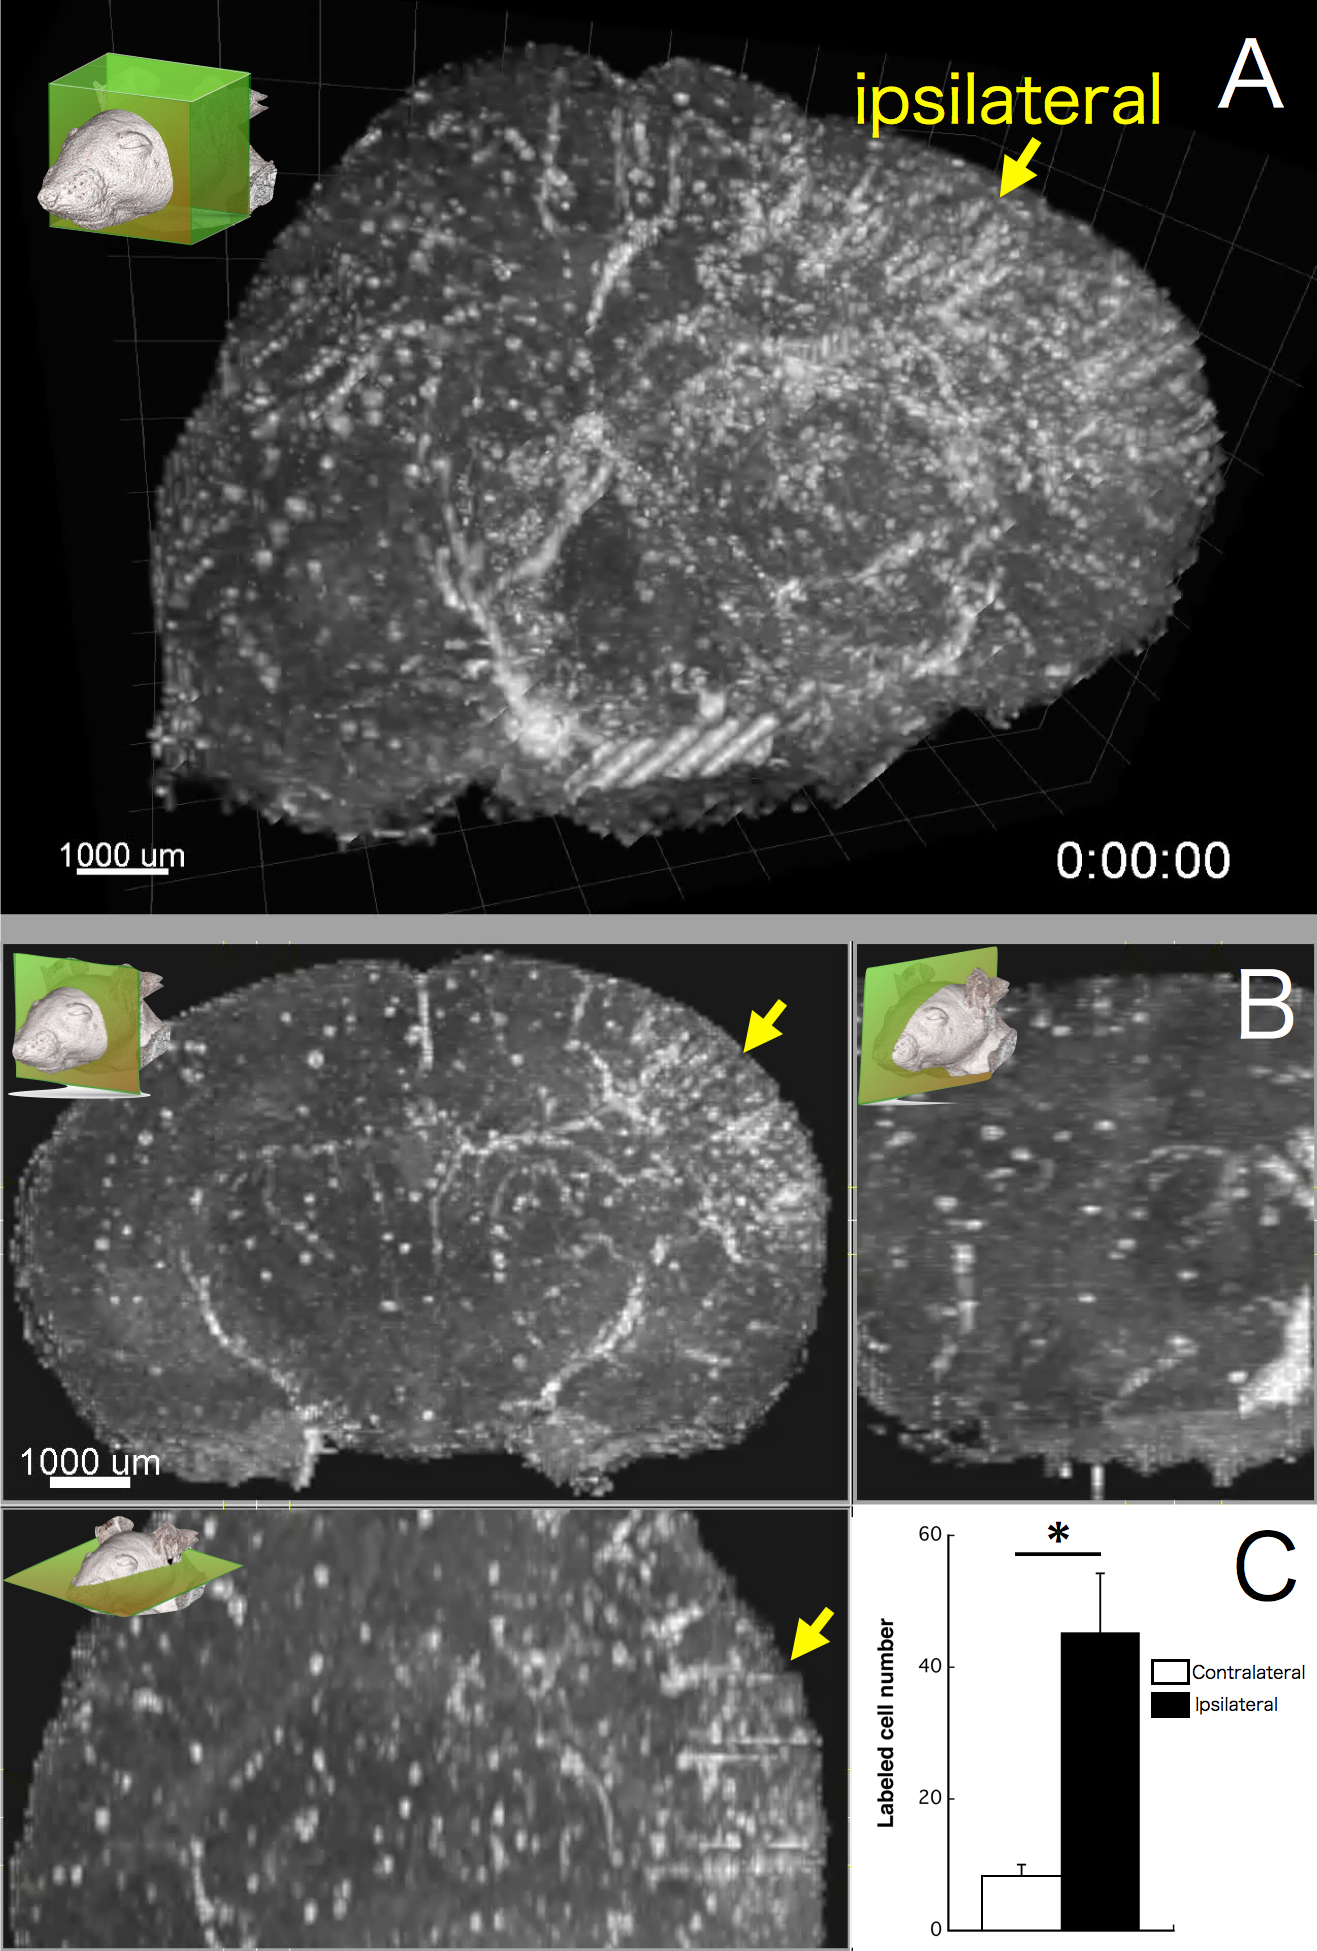
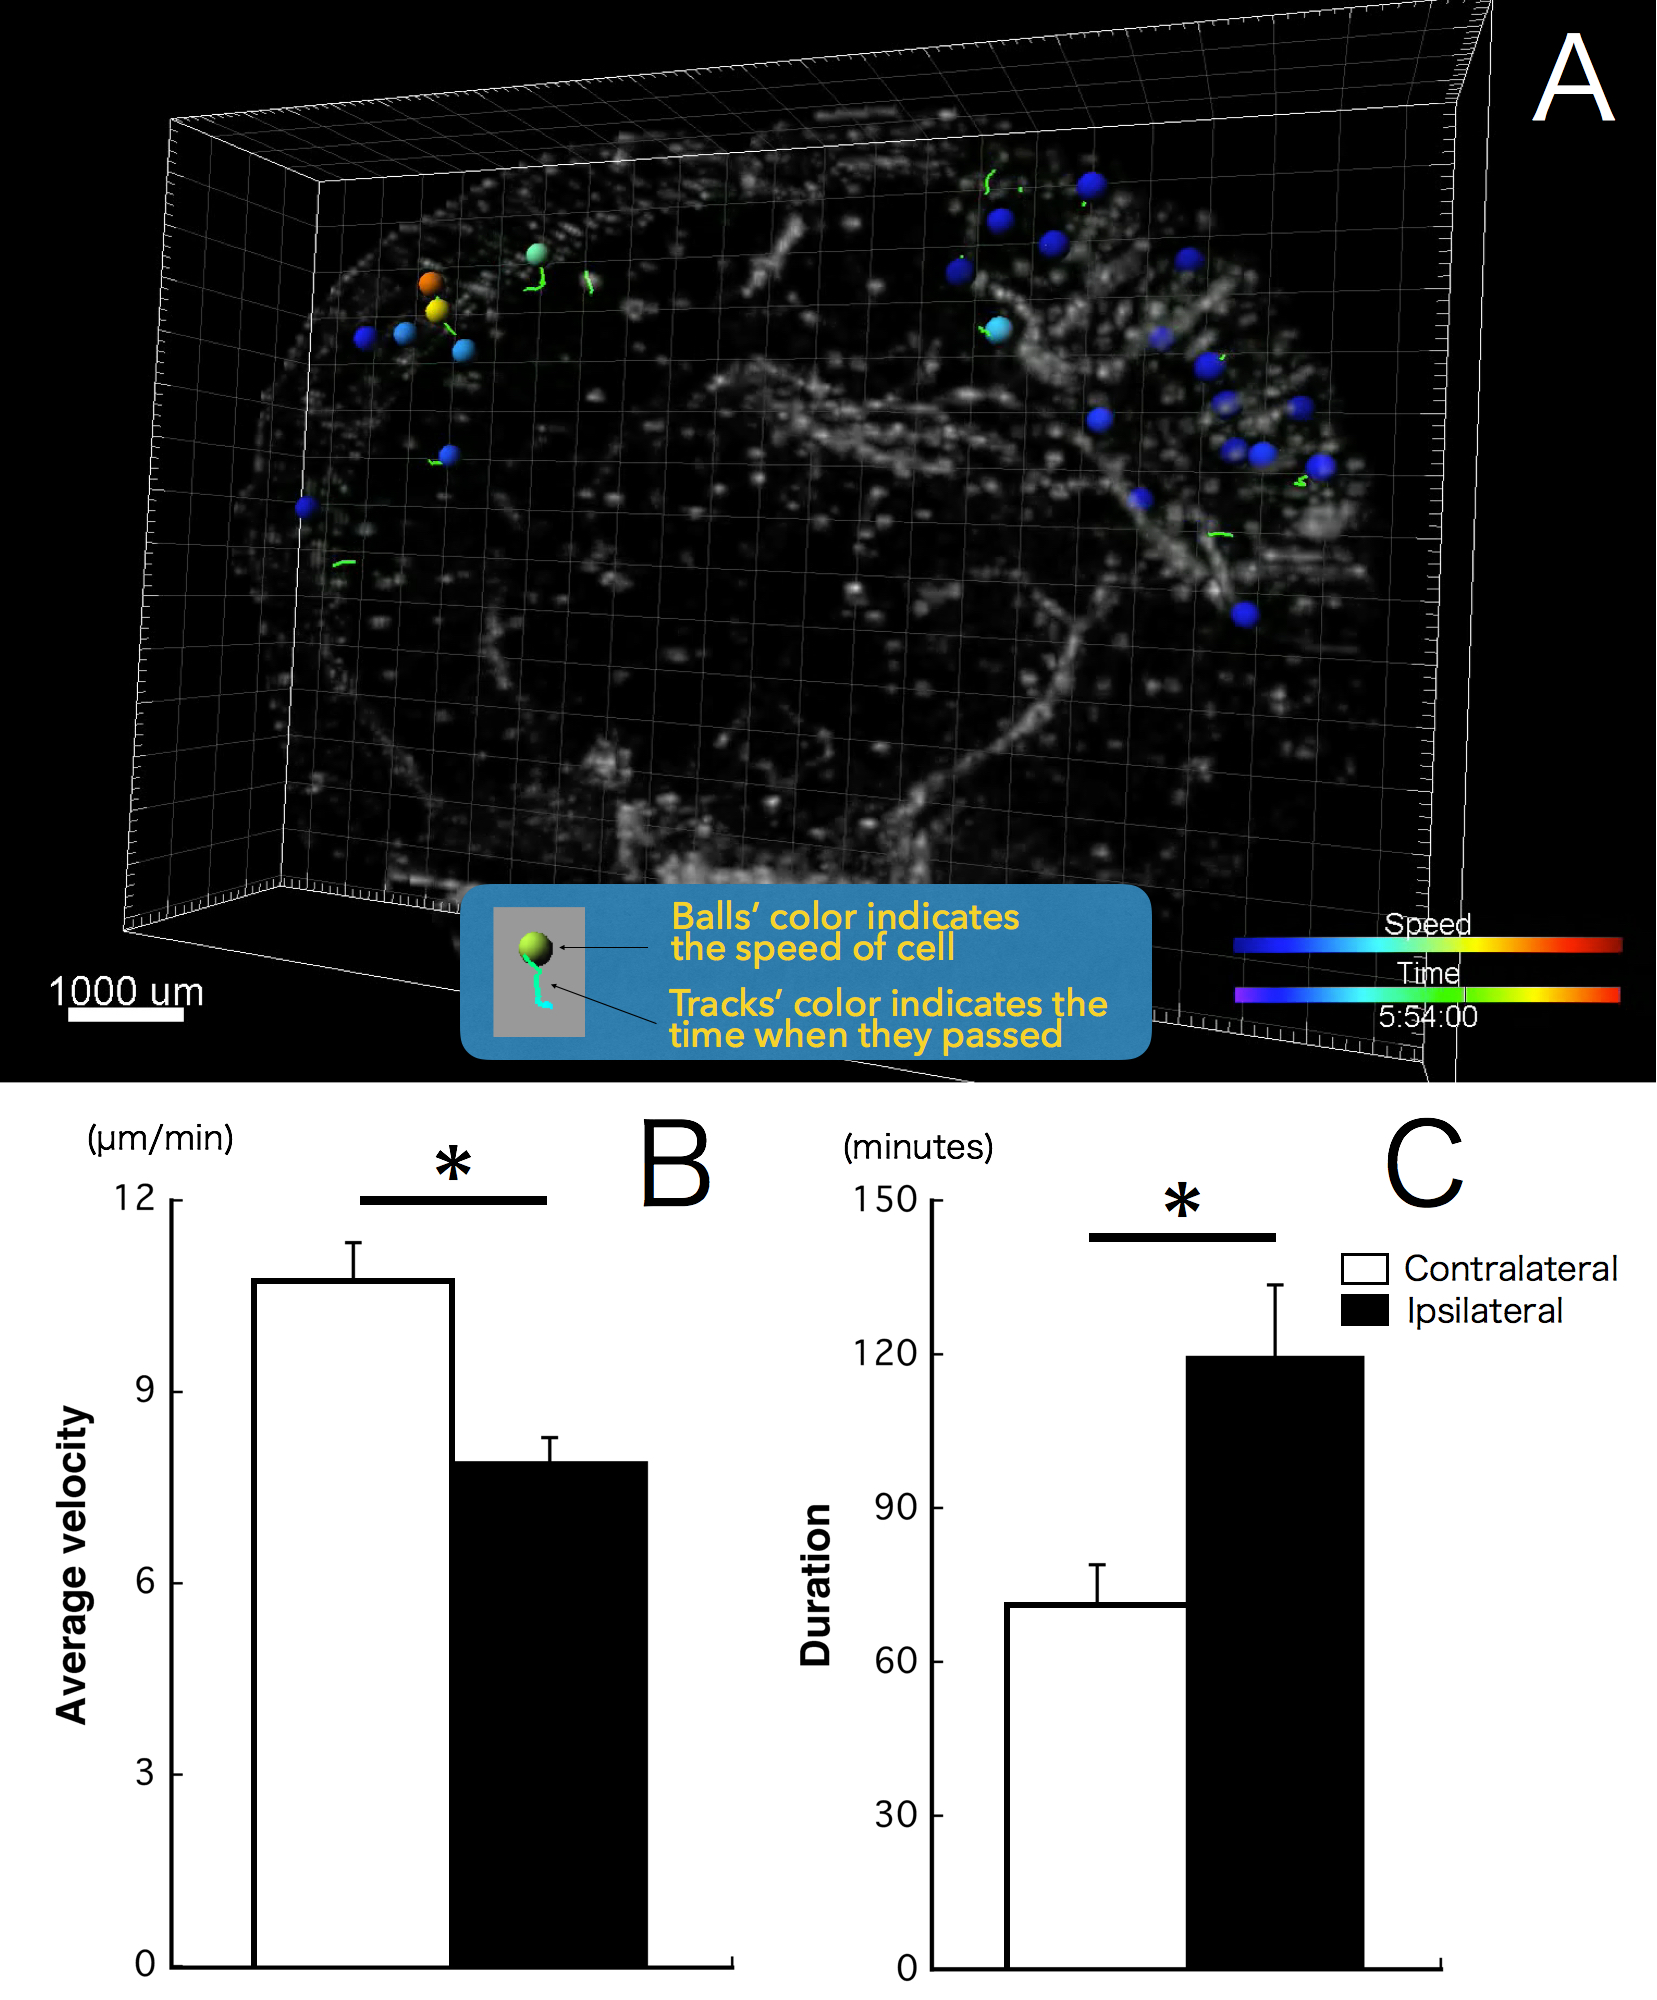
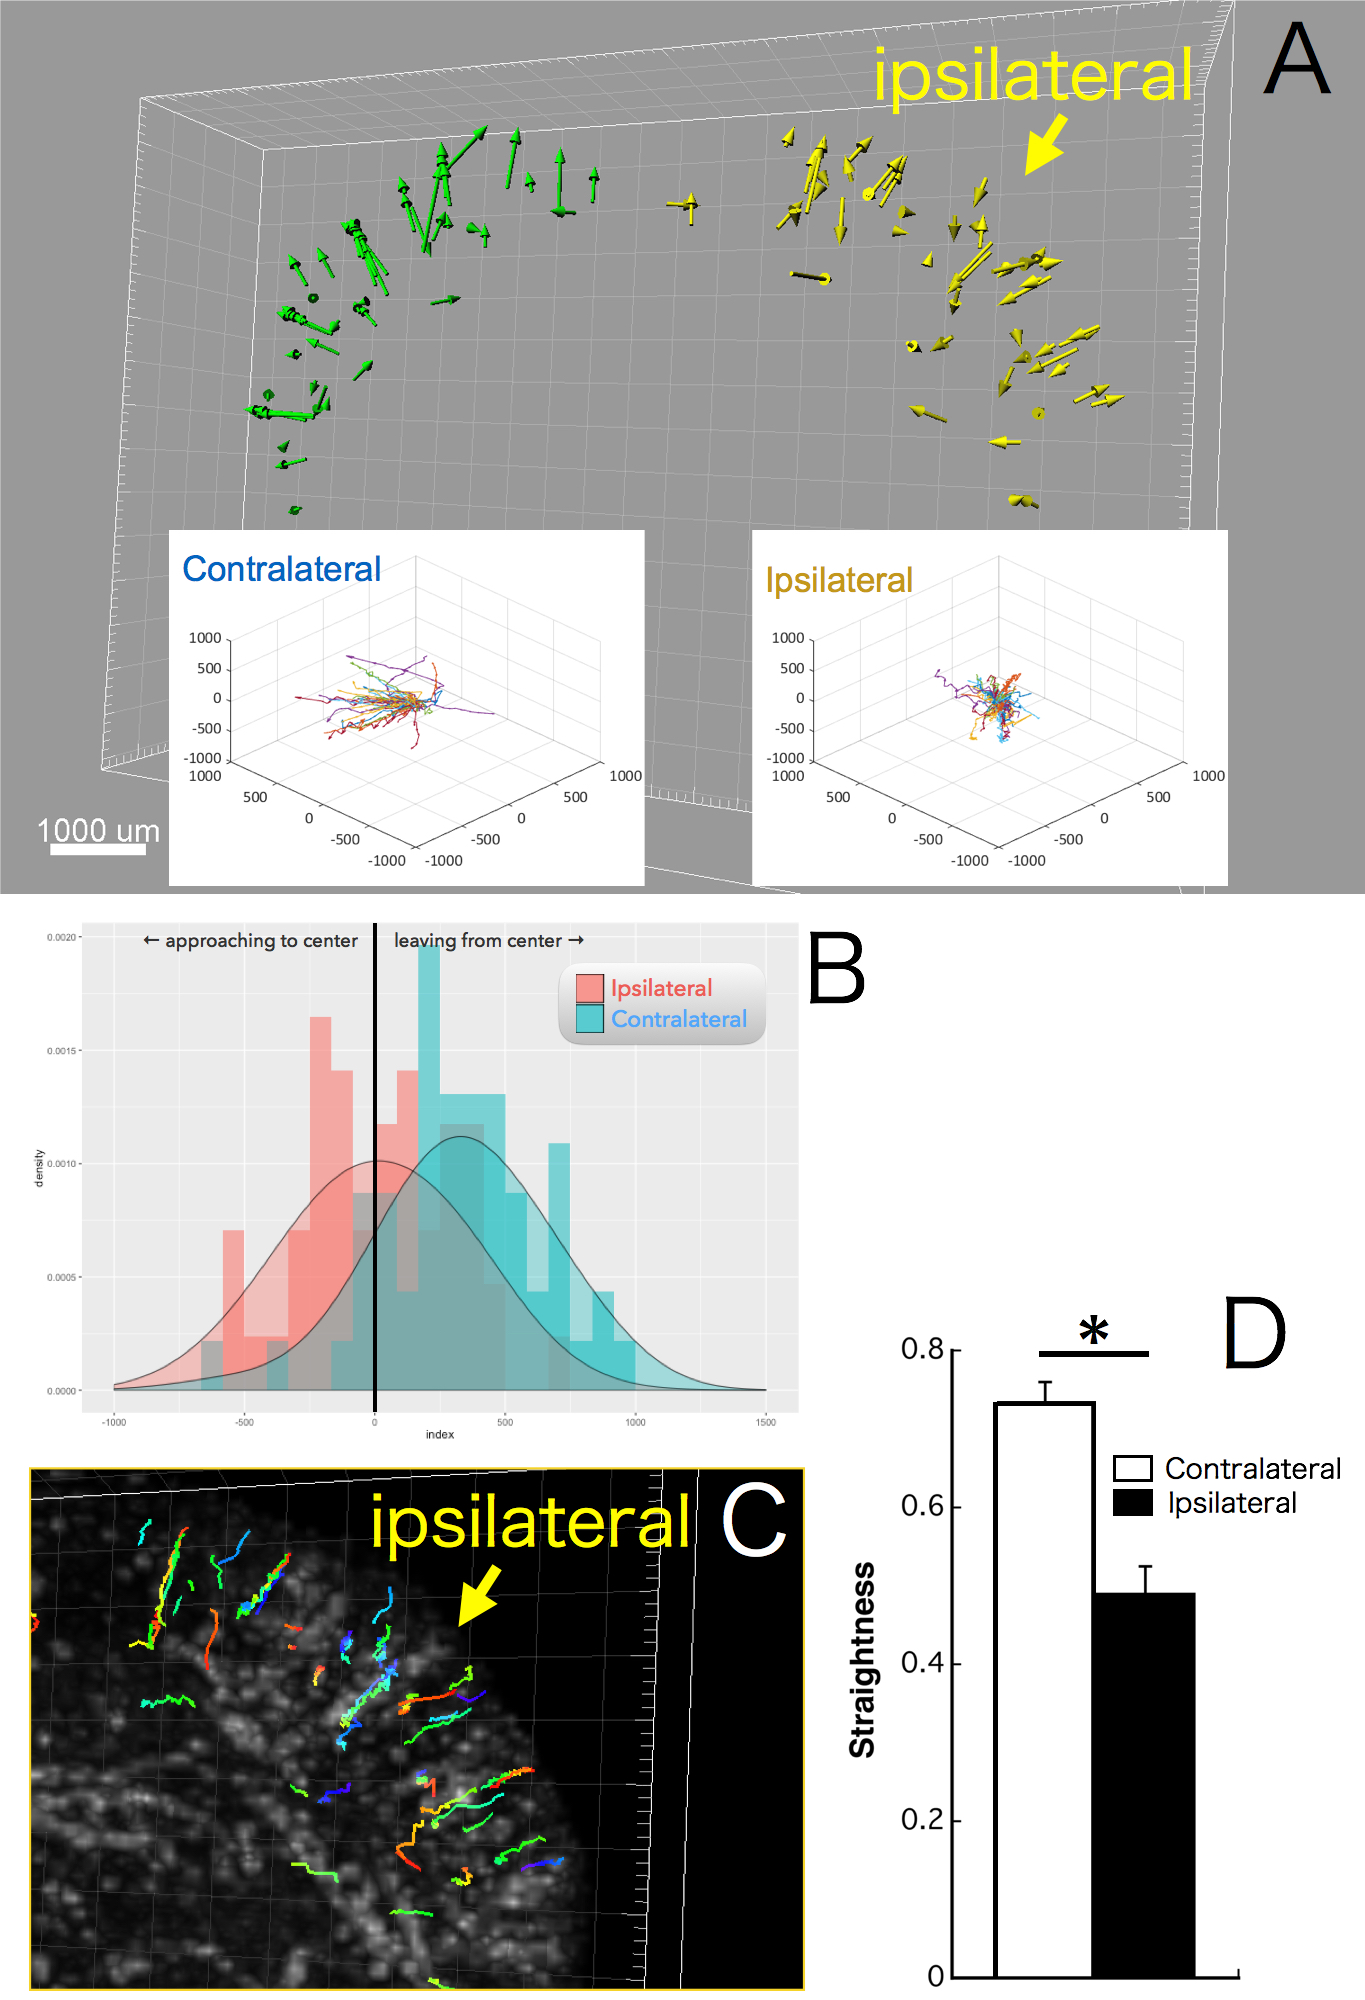
One day after SPIO administration and pMCAO, SPIO-labeled monocytes/macrophages were visible in all mice’s brains. The MRI scan allowed visualization of the 3D distribution of individual cells (Fig.1A) and assembling a time-lapse movie in multiple planar reconstructions (MPR; Fig.1B). Conventional evaluation of cell numbers in the ischemic lesion was determined one day after SPIO injection. We detected higher cell density on the side of the ischemic lesion (45.3 cells/mm3) than in the contralateral side (8.4 cells/mm3; Fig.1C). A 4D quantitative analysis yielded different migration patterns between ipsilateral and contralateral hemispheres (Fig.2A). Average velocity was significantly slower in the ischemic lesion (7.9 μm/min) than in the contralateral side (10.8 μm/min; Fig.2B). We also found that monocytes/macrophages in the ipsilateral hemisphere stayed much longer than ones in the contralateral hemisphere (119.7 min vs 71.0 min; Fig.2C). The displacement vector of each cell showed the shortest distance traveled from the initial to the final detectable position of cells (Fig.3A). In the contralateral hemisphere nearly all labeled cells moved outward and seemed to run along the venous streams, while in the ischemic lesion half of the cells moved inward from brain surface (Fig.3B). In this same region, several cells migrated orthogonally oriented to the blood vessel, abandoning straight paths (Fig.3C,D). The cells flowing inward from the brain surface appears associated with the perivascular glymphatic pathway,6 which may be used due to the artery occlusion. We speculate that cell motility in the ischemic lesion might reflect the kinetics of monocyte/macrophage recruitment along the perivascular pathway.Conclusion
MRI allows the 4D analysis of cellular dynamics in whole tissue or body in vivo, overcoming previous technical difficulties. Non-invasive monitoring of immune cells may lead to a greater understanding of how immune cells act in/around a lesion and before/after disease conditions. Our novel visual and quantitative MRI technique offers a new approach to study the behavior of immune cells in the living animal brain.Acknowledgements
This study was supported by JSPS KAKENHI Grant Number JP26860996 and JP16H01849 from the Japan Society for the Promotion of Science.References
1. Thevenot P, Nair A, Dey J, Yang J, Tang L. Method to analyze three-dimensional cell distribution and infiltration in degradable scaffolds. Tissue Engineer. 2008;14:319–331.
2. Mori Y, Chen T, Fujisawa T, et al. From cartoon to real time MRI: In vivo monitoring of phagocyte migration in mouse brain. Sci. Rep. 2014;4:6997.
3. Mori Y, Chen T, Yoshioka Y. In vivo monitoring of immune cell kinetics with time-lapse MRI in the ischemic lesion of mouse brain. ISMRM 23rd Annual Meeting 2015;691.
4. Ahrens ET, Bulte JWM. Tracking immune cells in vivo using magnetic resonance imaging. Nat. Rev. Immunol. 2013;13:755–763.
5. Welsh FA, Marcy VR, Sims RE. NADH fluorescence and regional energy metabolites during focal ischemia and reperfusion of rat brain. J. Cereb. Blood Flow Metab. 1991;11:459–465.
6. Nedergaard M. Garbage truck of the brain. Science 2013;340:1529–1530.
Figures