1026
Respiratory Motion Compensation in the Liver using Fat-Only Self Gated Signal1Biomedical Physics, University of California, Los Angeles, Los Angeles, CA, United States, 2Radiological Sciences, University of California, Los Angeles, Los Angeles, CA, United States
Synopsis
A multi-echo 3D golden angle radial gradient echo (GRE) sequence for fat-only respiratory motion extraction is a promising technique for liver dynamic contrast enhancement MRI (DCE-MRI), because it has inherent motion robustness, while providing other advantages, such as water-only images and R2* mapping. In this work we demonstrate that respiratory motion correction in the liver can be achieved using a fat-only self-navigated signal with minimal error in the fat-water separation (< 5%). Using this technique has implications of a more robust motion correction for liver DCE-MRI due to its inherent separation between respiratory motion signal and contrast uptake.
Introduction
A multi-echo 3D golden angle radial gradient echo (GRE) sequence for fat-only respiratory motion extraction is a promising technique for liver dynamic contrast enhancement MRI (DCE-MRI), because it has inherent motion robustness, while providing other advantages, such as water-only images1 and R2* mapping2. For further respiratory motion compensation, the self gated signal (SGS), extracted from the center of k-space every TR3,4, can be used, but separating the respiratory motion signal from the contrast uptake in liver DCE-MRI is not trivial. The fat-only SGS (SGSF) was recently proposed to overcome this issue using a simple two-point Dixon separation3, and in this work we will further evaluate the accuracy of SGSF, dependent on the additional phase accrual between the in-phase (IP) and out-of-phase (OP) due to B0 inhomogeneities, and show the feasibility of using SGSF for respiratory motion compensation in the normal liver at 3T.Theory & Methods
The SGS is determined by taking center of the k-space along the z-direction. At the center of k-space there is no gradient encoding phase accrual. The SGS for IP and OP echoes can then be written as
$$
SGS_{OP}(TE_1)=\int[W(\vec{r})-F(\vec{r})]e^{i\phi_0(\vec{r},TE_1)}e^{i\phi_1
(\vec{r})}\vec{dr}$$
$$SGS_{IP}(TE_2)=\int[W(\vec{r})+F(\vec{r})]e^{i\phi_0(\vec{r},TE_2)}e^{i\phi_1 (\vec{r})}\vec{dr}$$
Where φ0 is the phase accrual due to inhomogeneities, φ1 is the phase shift due to other system errors, is the magnitude water signal and . The SGSF is then determined by subtracting equation [1] and [2] and is written as
$$SGS_F(t)=\frac{SGS_(IP)-SGS_(OP)}{2}$$.
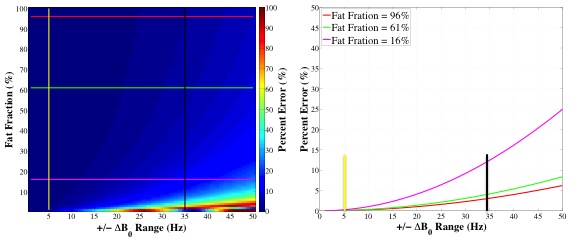
Due to B0 inhomogenities the fat and water cannot be easily separated. A numerical simulation was performed to assess the potential percentage error (PE) between the true SGSF (SGSF_true) with no phase accrual and the estimated SGSF with varying ΔB0 (±0-100Hz) separation with varying phase accrual. The PE was calculated using
$$ PE = \frac{\left|SGS_{F_{True}}-\left|SGS_F\right|\right |}{SGS_{F_{True}}}$$
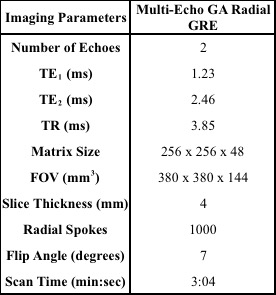
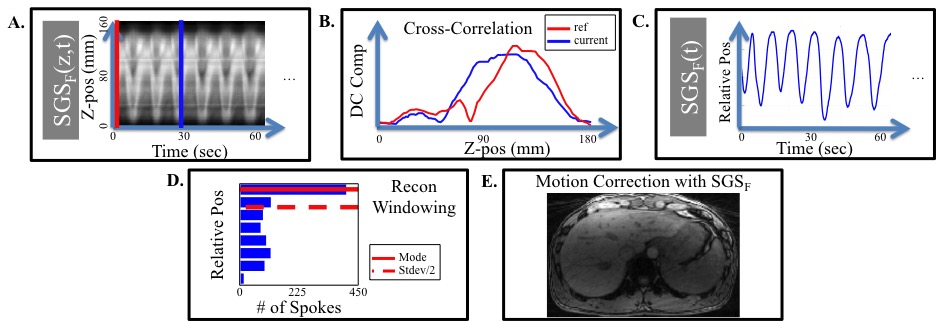
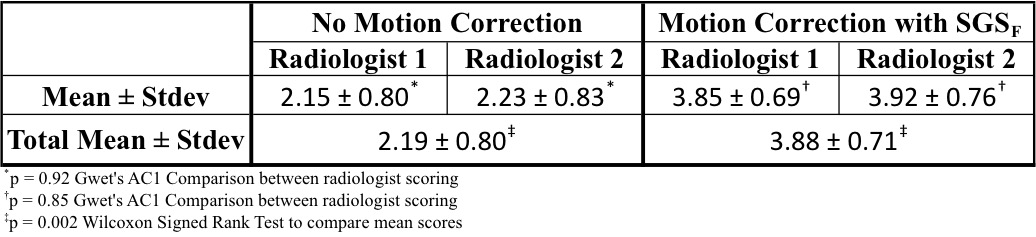
To assess if the SGSF could be used for motion correction 6 healthy volunteers were scanned using a 3D multi-echo Golden Angle (GA) Radial GRE sequence on a 3T scanner (Prisma, Siemens Healthcare, Erlangen, Germany). See table 1 for imaging protocols. Figure 1 shows how the SGSF(t) was generated after using equation [3] to get fat-only signal, and how it was used for motion correction. Images with no motion correction used all of the spokes acquired during the scan. The reconstruction was performed offline using gridding. Two experienced radiologists scored the images from 1 to 5 based on the motion artifacts (1 = severe motion artifacts, and 5 = no detectable motion artifacts). A Gwet’s AC1 test for comparison of radiologist scoring and Wilcoxon signed rank test for compare the means between motion correction and no motion correction scores were performed.
Results
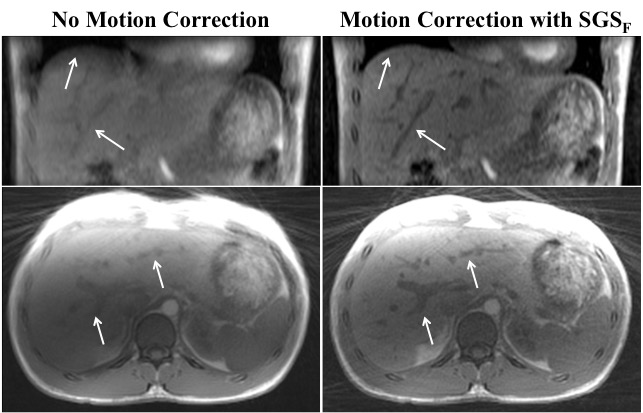
The numerical simulations (Figure 2) shows that for a healthy subject ΔB0 ~ ± 5Hz (yellow line) and a patient with moderate iron overload ΔB0 ~ ± 34Hz (black line)3. For subjects with low iron concentration or small ΔB0 the PE is less than 1% for fat fractions >1% (Figure 2). Figure 3 shows that using the SGSF for motion correction (right) greatly reduces the motion artifacts at the diaphragm as well as the blood vessels, marked by the arrows, compared to no motion correction (left). Table 2 gives the radiologist scores for each subject. The AC1 test states that the radiologists scoring are in excellent agreement. The motion corrected image scores were statistically significantly higher compared to using no motion correction (p=0.002).Discussion
This study shows that there is minimal error (less than 5%) using two-point Dixon method to extract SGSF for most imaging cases, and that the SGSF can be used for proper motion correction. It is possible to reduce the error further by proper shimming before the scan, or using other methods to separate the fat and water, like 3-point Dixon. Even with the subjects deep breathing where large motion artifacts were noticed the motion correction improved the radiologist scoring and rendered the previously motion corrupted images more clinically viable. Using SGSF can be advantageous in liver DCE-MRI due to its inherent separation between respiratory motion and contrast uptake in fat. The reconstructions were performed for only static images, however compressed sensing could be applied to create dynamic imaging for DCE-MRI studies. Future studies will include implementing advance dynamic reconstruction to evaluated SGSF viability DCE-MRI.Conclusion
We have demonstrated that the respiratory motion correction in the liver can be achieved using fat-only self-navigated signal with minimal error in the fat-water separation (< 5%). Using this technique has implications of a more robust motion correction for liver DCE-MRI due to its inherent separation between respiratory motion signal and contrast uptake.Acknowledgements
Funding for project is provided by NIH U01-HD087221.References
1. Jingfei Ma, JMRI 2008
2. Hernando et al., MRM 2013
3. Martin et al. #4262, ISMRM 2016
4. Grimm et al. #3814, ISMRM 2012
Figures