1024
Quantification, Analysis, and Correction of Nonrigid Motion in Free-Breathing, Non-Contrast-Enhanced Renal Angiography using 3D Image-Based Navigators1Electrical Engineering, Stanford University, Stanford, CA, United States
Synopsis
We present a method that leverages 3D image-based navigators (iNAVs) for nonrigid motion correction in free-breathing, non-contrast-enhanced renal angiography scans. We begin by performing an ROI-based analysis of 3D iNAV motion, with ROI selection based on published biomechanical simulations of the renal arteries during respiration. Then, we demonstrate that localized motion estimates derived from different ROIs agree with the findings of the simulations. Finally, we combine the extracted motion information with an autofocusing technique for respiratory motion compensation. Across all patient studies, the proposed method significantly improves the depiction of the renal arteries as compared to 3D translational motion correction.
Purpose
Free-breathing, non-respiratory-gated methods for non-contrast-enhanced, renal magnetic resonance angiography (rMRA) are appealing because of their (1) higher scan efficiency, (2) improved comfort, and (3) applicability to subjects incapable of consistent, repeated breath-holds. Respiratory motion, however, degrades the image quality of free-breathing rMRA scans1,2,3. Motion correction based on global motion estimates of the target imaging slab is suboptimal, as different regions of the renal arteries (RAs) undergo highly dissimilar displacements2,3. In this work, we present a nonrigid motion compensation technique tailored for free-breathing rMRA using 3D image-based navigators (iNAVs) to measure and correct for localized displacements of RAs.Methods
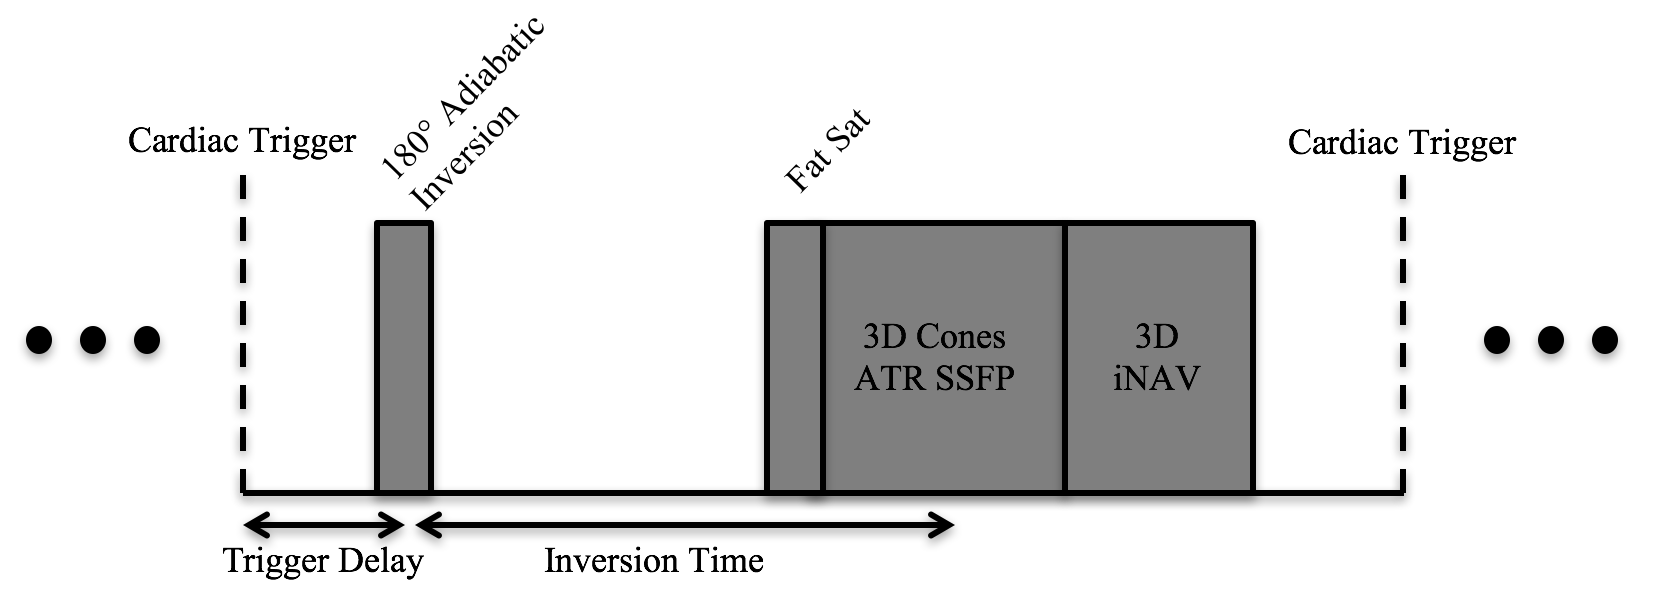
Free-breathing, 3D rMRA data are acquired using a cardiac-triggered, inversion-prepared cones sequence (Figure 1)4,5. For the measurement of superior-inferior (SI), anterior-posterior (AP), and right-left (RL) motion of the RAs, 3D iNAVs are acquired after the cones data acquisition every sequence cycle4,5,6,7.
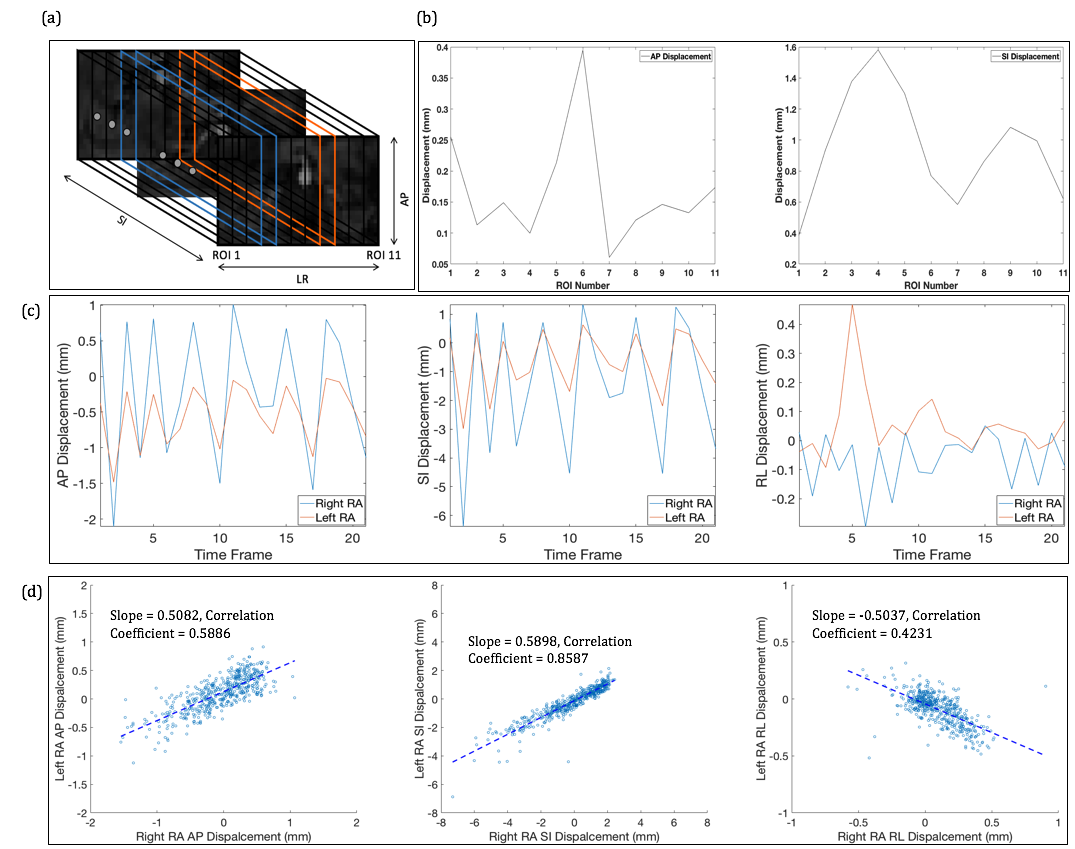
We perform an ROI-based analysis of 3D iNAV motion, with ROI selection based on biomechanical simulation studies that have found: (1) right RAs exhibit larger SI and AP motion than the left RAs and (2) distal and proximal renal branches experience differing types of SI and AP motion2,3,8. To capture these region-specific motion behaviors, SI, AP, and RL displacements are obtained from multiple volumetric rectangular ROIs (rectangular “strips”) spanning the RAs (Figure 2(a)). More specifically, five strips are used for the left as well as the right RAs, and one strip is used for the descending aorta. This enables effective monitoring of the movement of different regions of the RAs every sequence cycle.
Comparison of motion estimates derived from different strips indicates sensitivity to the varying motion patterns between not only the left and right RAs, but also the proximal and distal RAs (Figure 2(b-d)). For example, as reported in the aforementioned biomechanical studies, the right RAs have notably larger SI and AP motion components than the left RAs. Similarly, we find that the average AP as well as average SI motion does not stay constant between the proximal and distal RAs. It is interesting to note that RL motion estimates from the left and right RAs are negatively correlated. This contrastive nature of RL displacement, along with the variation of SI and AP displacement across the RAs, cannot be captured by a single, average “global” motion trajectory often acquired in rMRA scans via abdominal bellows and diaphragm navigators.
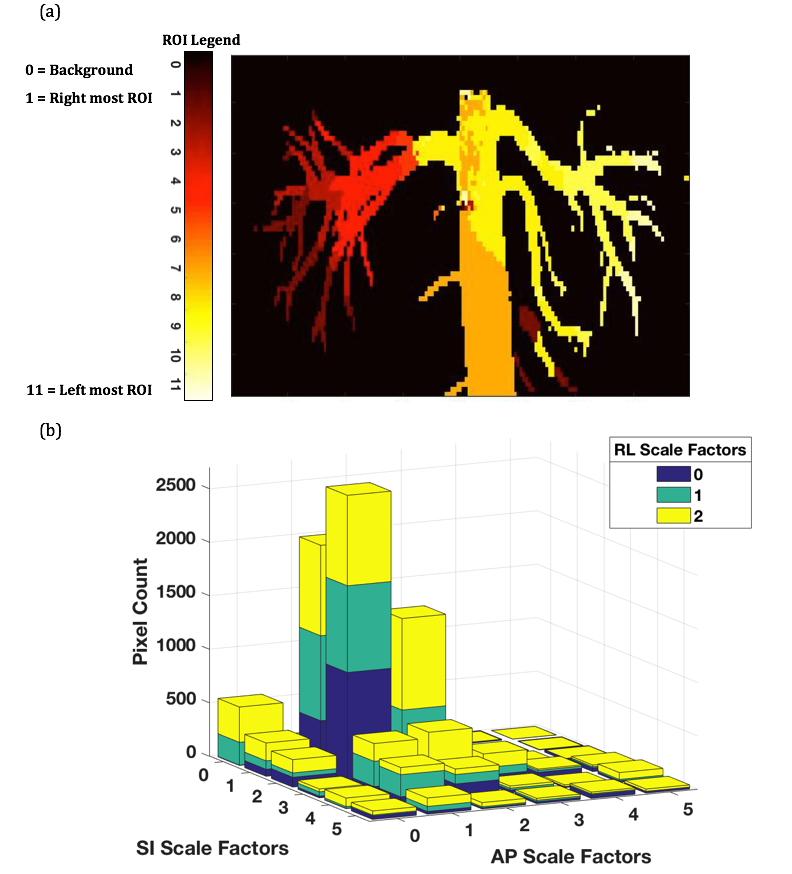
Motion models of the abdomen suggest substantial changes in curvature and branching angles of the RAs during respiration3. The motion trajectories acquired from ROIs covering different renal segments are averages of deformations that each renal branch individually experiences in that segment during the scan. To capture the more complex displacements, a nonrigid autofocus algorithm is leveraged. Six SI and AP scale factors, uniformly spanning from 0 to 5, along with three RL scale factors, uniformly spanning from 0 and 2, are applied to motion candidates from each ROI. The product space of the scale factors yields 108 motion candidates for each rectangular strip. These scaled motion trajectories are used for 3D translational compensation of the acquired k-space data, and a set of candidate motion-compensated images is reconstructed. From this set, a gradient entropy metric is used to assemble the “best-focused” image on a pixel-by-pixel basis6.
Results and Discussion
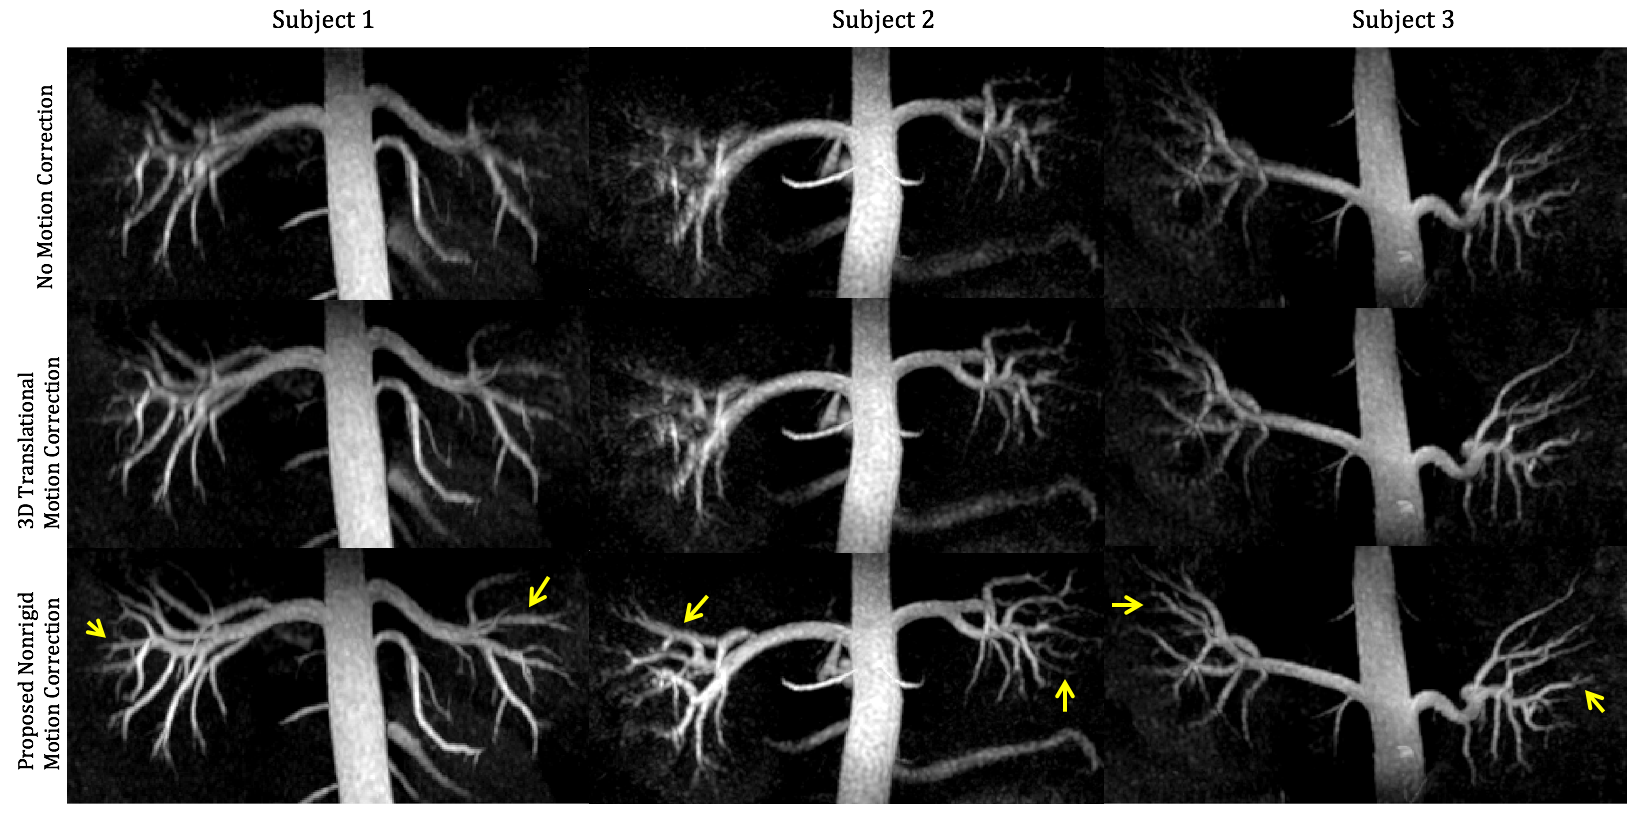
Figure 3 compares reformatted coronal rMRA maximum intensity projection (MIP) images for three volunteers acquired on a 1.5T GE scanner using an 8-channel cardiac receiver coil. In the images without motion correction and with 3D global translation motion correction, renal vessels appear highly blurred and, in some cases, missing. The latter may misleadingly suggest insufficient inflow to visualize the finer distal vessels. Application of the proposed nonrigid method, however, demonstrates motion blurring as the issue, and yields overall sharper and improved visibility of vessels.
The effectiveness of the proposed method can be attributed to localized motion estimates derived from strips covering the full extent of the RAs in the 3D iNAVs. When forming a given segment of the RAs in the final image, the autofocus method primarily chooses the motion trajectory derived from the corresponding strip on the 3D iNAVs (Figure 4(a)). Further analysis justifies the scaling of the raw motion trajectories by a range of values. It can be seen in the histogram (Figure 4(b)), which considers only the pixel locations of the RAs, that many of the scaled motion trajectories contribute to deblurring of various regions of the renal vessels.
Conclusion
For free-breathing rMRA, 3D iNAVs enable accurate estimation of localized displacements, thereby yielding effective nonrigid motion correction.Acknowledgements
We gratefully acknowledge the support of NIH grants R01HL127039, T32HL007846, and T32EB009653. This work was also supported by the Hsi-Fong Ho Stanford Graduate Fellowship, the Ruth L. Kirschstein National Research Award, and the National Science Foundation Graduate Research Fellowship under Grant No. DGE-114747.References
1. Miyazaki, M. and Isoda, H., 2011. Non-contrast-enhanced MR angiography of the abdomen. European journal of radiology, 80(1), pp.9-23.
2. Vasbinder, G.B.C., Maki, J.H., Nijenhuis, R.J., Leiner, T., Wilson, G.J., Kessels, A.G., Lemarie, E.E., Kaandorp, D.W., Ho, K.Y.J. and van Engelshoven, J., 2002. Motion of the distal renal artery during three-dimensional contrast-enhanced breath-hold MRA. Journal of Magnetic Resonance Imaging, 16(6), pp.685-696.
3. Draney, M.T., Zarins, C.K. and Taylor, C.A., 2005. Three-dimensional analysis of renal artery bending motion during respiration. Journal of Endovascular Therapy, 12(3), pp.380-386.
4. Wu, H.H., Gurney, P.T., Hu, B.S., Nishimura, D.G. and McConnell, M.V., 2013. Free-breathing multiphase whole-heart coronary MR angiography using image-based navigators and three-dimensional cones imaging. Magnetic resonance in medicine, 69(4), pp.1083-1093.
5. Addy, N.O., Ingle, R.R., Luo, J., Baron, C.A., Yang, P.C., Hu, B.S. and Nishimura, D.G., 2016. 3D image-based navigators for coronary MR angiography. Magnetic resonance in medicine.
6. Ingle, R.R., Wu, H.H., Addy, N.O., Cheng, J.Y., Yang, P.C., Hu, B.S. and Nishimura, D.G., 2014. Nonrigid autofocus motion correction for coronary MR angiography with a 3D cones trajectory. Magnetic resonance in medicine, 72(2), pp.347-361.
7. Luo, J., Addy, N.O., Ingle, R.R., Cheng, J.Y., Hu, B.S. and Nishimura, D.G., 2015. Autofocusing Motion Correction with 3D Image-based Navigators for Abdominal Imaging. Proceedings of ISMRM 23rd annual meeting & exhibition.
8. Kaandorp, D.W., Vasbinder, G.B.C., de Haan, M.W., Kemerink, G.J. and van Engelshoven, J., 2000. Motion of the proximal renal artery during the cardiac cycle. Journal of Magnetic Resonance Imaging, 12(6), pp.924-928.
Figures