1018
Fast, non-local temporally regularized elastic group-wise motion correction for improved fidelity of liver DCE-MRI1GE Global Research, Bangalore, India, 2Seoul National University Hospital, Seoul, Korea, Republic of, 3GE Healthcare, Seoul, Korea, Republic of
Synopsis
A novel group-wise registration methodology using non-local regularization is presented for liver DCE-MRI data that can provide robust motion correction even in cases of large deformations, restores DCE data characteristics, generates physiologically relevant PK maps and is feasible for clinical practice due to short computation time.
Introduction
Dynamic contrast-enhanced MRI (DCE-MRI) has been used for assessing liver perfusion [1] and its changes in various liver diseases [2]. DCE-MRI being a free-breathing acquisition, elastic deformations of liver occur over duration of scan. Motion corrupts DCE-MRI signal time-course and consequently impacts parameters obtained using pharmacokinetic (PK) model fitted to DCE data. Elastic motion is retrospectively corrected using non-rigid registration (NRR) methods which can include pair-wise NRR of each bolus phase to a fixed reference [3] or group-wise methods (4,5). Group-wise motion correction is attractive since it can provide “reference-bias” free alignment of DCE-data. In this work, we introduce a novel group-wise motion correction which incorporates a non-local (NL) temporal regularization. The NL term ensures robust motion correction despite simultaneous contrast and motion related changes in the DCE signal data as well as correct large deformations in liver. Optic flow NRR ensures speed, making it practical for clinical usage: a. reasonable processing time (< 8 mins) (11 hrs. in [5]) and b. without specialized hardware (GPUs in [3]).Methods
Patient Data: MRI data obtained from 14 liver fibrosis patients on a 1.5T GE SIGNA EXCITE system. Liver-DCE: 3D EFGRE, TE/TR = 1.12/4.8 ms, matrix = 256x256, 32 slices, FA = 15, FOV = 450 mm2, 30 bolus phase volumes.
Pair-wise motion correction: 3D SyN based NRR was performed between last bolus phase (reference) and each of other bolus phases using ANTs package [6]. SyN was chosen because of its diffeomorphic registration capabilities and robust performance in previous studies. Multi-resolution framework was used along with joint cross-correlation and mutual information metric to account for local deformations and contrast intensity variations across bolus phases. SyN parameters were tuned to obtain good registration across multiple cases and then fixed for the evaluation on entire 14 subject database.
Group-wise motion correction: We implemented an optic flow based dense NRR where all bolus phases were simultaneously registered to evolving group-wise median. Crucially, we regularize deformation field using a non-local [NL] spatial term, and a NL temporal term seeking spatial coherence of velocity. NL penalties are critical in robustly handling large motion, residual intensity variations (despite pre-processing), and in maintaining integrity of key structures [7]. Entire pipeline was implemented in ITK [8].
Implementation: Both pair-wise and group-wise motion correction schemes were parallelized using OpenMP architecture. Experiments performed on HP Z420 (6-cores, 16GB RAM).
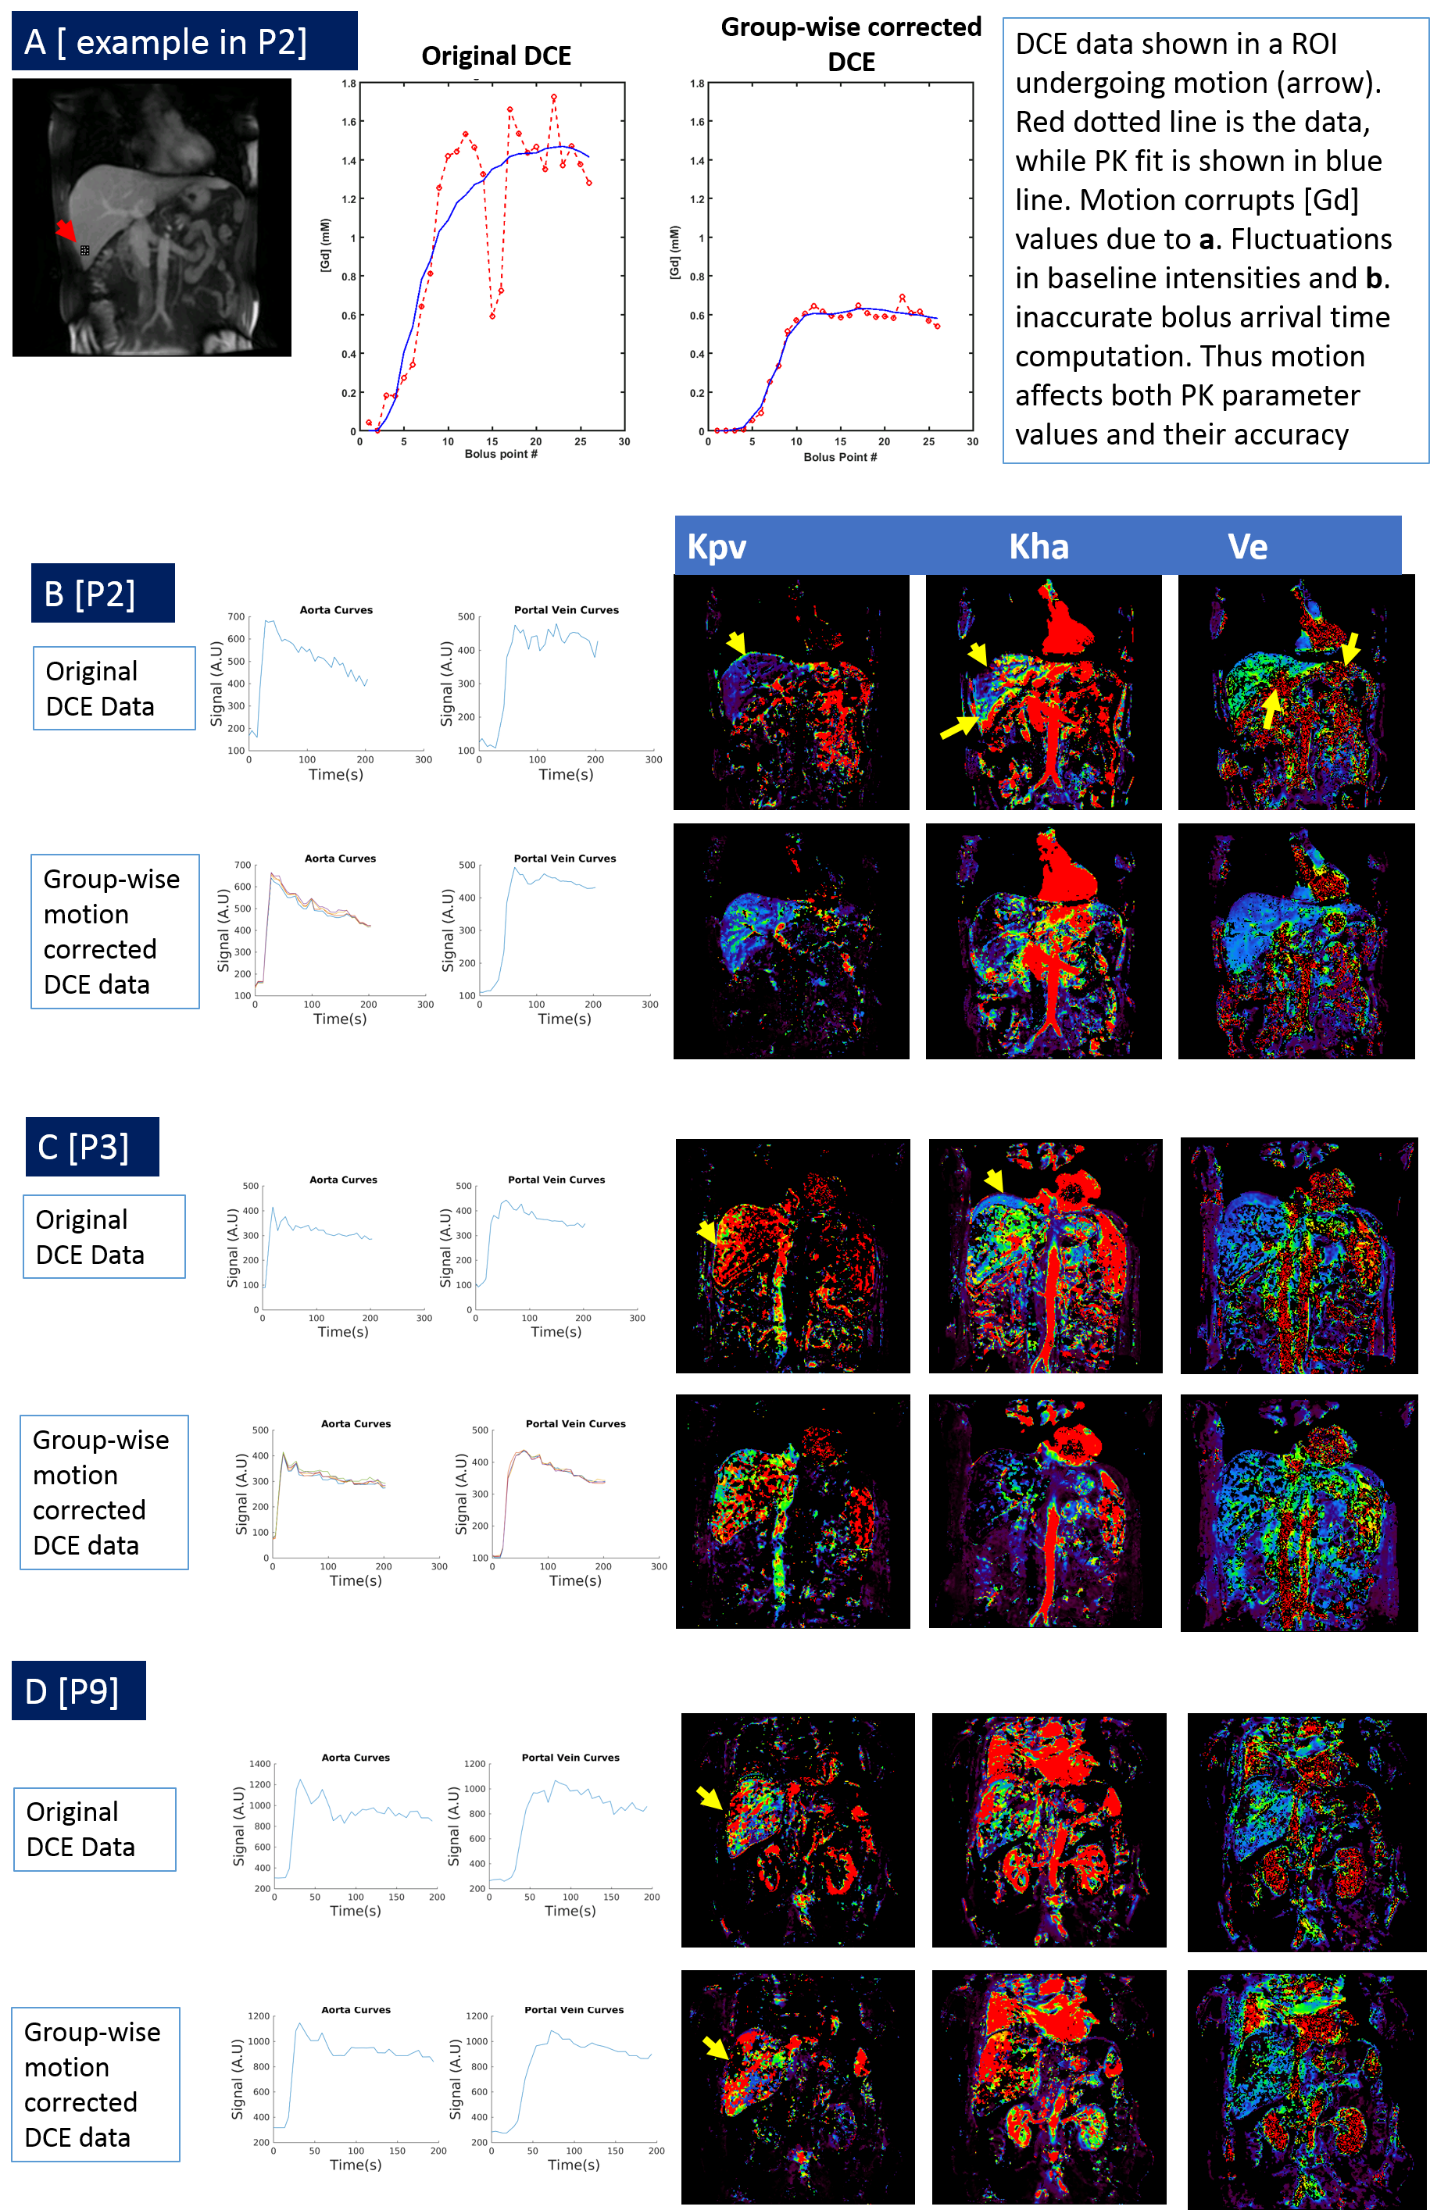
PK Modeling: DCE arbitrary signal data was converted into concentration units using baseline images and fixed tissue T1 (550 ms). Concentration data was fit using a dual input (aorta and portal vein), single compartment Materne model [1] to compute aorta transfer constant (Kha), portal transfer constant (Kpv), outflow rate constant (Kep) and extra-cellular extra-vascular volume fraction Ve = (Kha+Kpv / Kep). PK modelling was done on both: original and group-wise motion corrected data. A trained radiologist marked aorta and portal vascular input separately on original and group-wise motion corrected data.
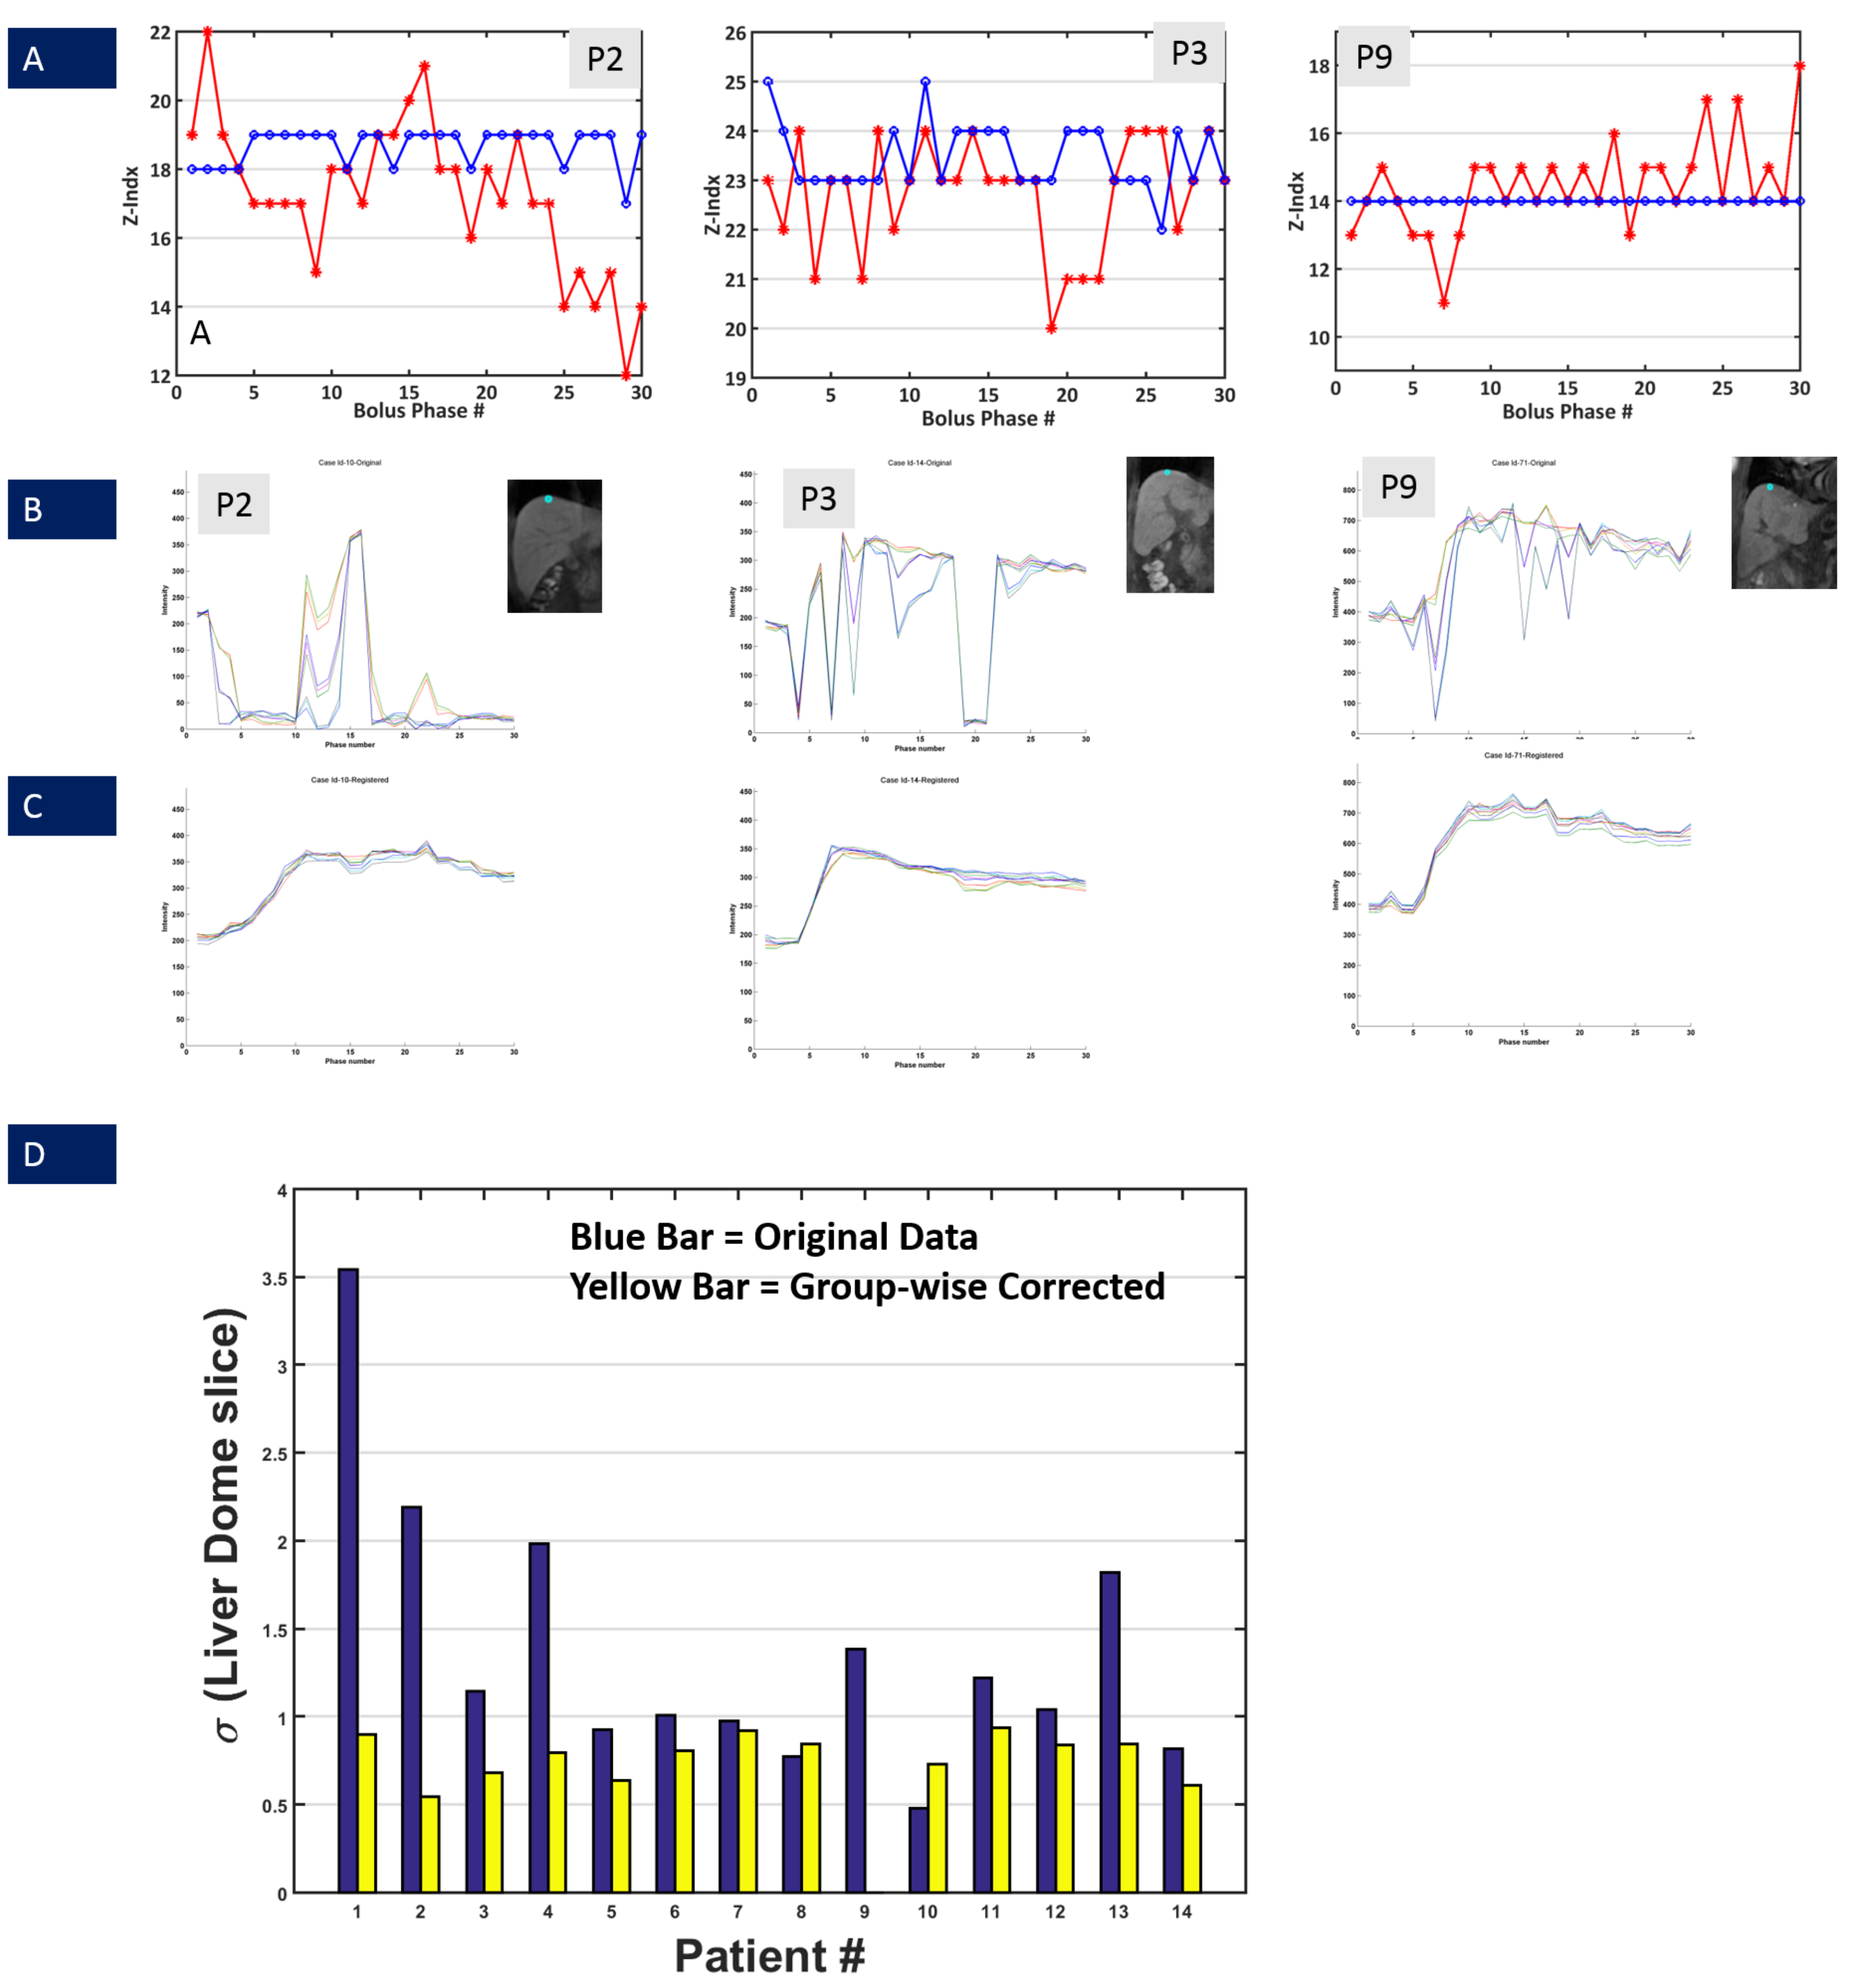
Evaluation of motion correction: Evaluation was done visually by tracking the dome of diaphragm in each bolus phase volume across all 14 cases, for both original and group-wise corrected data. The slice index variation of diaphragm dome across phases was used as metric to ascertain performance of motion correction.
Results and Discussion
Average compute time for pair-wise motion correction was 670s, while for group-wise NRR was 500s. Figures 1-2 demonstrate utility of group-wise correction vis-à-vis pairwise correction in cases where there is significant liver FOV mismatch between reference and other bolus phases. SyN algorithm parameters were varied over a wide range of values to get a good registration in these failure cases, but still could not provide robust correction in those cases. In other cases where deformation was local and overlap between reference and moving bolus phases significant, pair-wise motion correction performed similarly to group-wise motion correction. Since group-wise correction performed uniformly across cohort of DCE data, further analysis was restricted to group-wise corrected data. Figure 4 demonstrates impact of group-wise correction on recovering DCE data characteristics (Fig 4B and C) as well as improved localization of diaphragm boundaries (Fig 4A/ 4D). Figure 5 shows improvement in PK maps on post group-wise corrected data, which reflect underlying hepatic hemodynamics better (correct signal to concentration mapping, assignment of portal and arterial flow rates as observed in disease, accurate PK maps in liver periphery regions etc.).Conclusion
We have demonstrated a novel group-wise motion correction for liver DCE-MRI that provides robust motion correction even in cases of large liver deformations, restores DCE-MRI data characteristics, generates physiologically relevant PK maps and is feasible for clinical practice due to short computation time.Acknowledgements
No acknowledgement found.References
1.Materne et.al; Magnetic Resonance in Medicine 47:135–142 (2002)
2. Taouli B. et.al;, AJR Am J Roentgenol. 2013 Oct;201(4):795-800. (Tumors)
3. Satyam Ghodasara et.al;, Acceleration of Image Analysis for Liver Perfusion Quantification Using Parallel Computational Techniques, ISMRM 2016, p.161
4. Medical image analysis 18(2):301-313 · November 2013
5. Qianjin Feng et.al; Sci Rep. 2016; 6: 34461.
6. Avants B et al, Penn Img Comp and Sci Lab. 2009
7.S Thiruvenkadam et al, “GPNLPerf: Robust 4D non-rigid motion correction for Myocardial Perfusion analysis”, Volume 9902, LNCS, pp 255-263 , MICCAI, 2016.
8. www.itk.org
Figures
Figure 1. A representative case (P2) where there is significant liver FOV mismatch across bolus phases (continuous loop). First image is the original DCE data, followed by pair-wise 3D SyN motion corrected data and the last image is the group-wise motion corrected data. The pair-wise NRR is not able to provide robust motion correction in this case. Group-wise registration by incorporating non-local constraints is able to provide a very stable motion correction.
GIF Image Note: While the original DCE data contains 30 temporal frames, the GIF image contains only 15 frames to accommodate 2MB upload image size limit
Figure 2. Another case (P3) where pair-wise registration is not able to handle non-overlapping deformation of the liver. First image is the original DCE data, followed by pair-wise 3D SyN motion corrected data and the last image is the group-wise motion corrected data.
GIF Image Note: While the original DCE data contains 30 temporal frames, the GIF image contains only 15 frames and scaled in-plane by factor of 0.9 to accommodate 2MB upload image size limit.
Figure 3. Example of case (P9) where liver and surrounding organs exhibit local deformation within the neighborhood with significant overlap. First image is the original DCE data, followed by pair-wise 3D SyN motion corrected data and the last image is the group-wise motion corrected data. In such a case, pair-wise registration was able to provide robust motion correction, similar to group-wise motion correction.
GIF Image Note: While the original DCE data contains 30 temporal frames, the GIF image contains only 15 frames and scaled in-plane by factor of 0.85 to accommodate 2MB upload image size limit.