1015
Improved Accuracy of Apparent Diffusion Coefficient (ADC) Quantification: Evaluation in Prostate Diffusion Imaging without Using Endorectal Coils1MR R&D Collaborations, Siemens Healthcare, Atlanta, GA, United States, 2Department of Radiology and Imaging Sciences, Emory University, Atlanta, GA, United States, 3MR Application Predevelopment, Siemens Healthcare, Erlangen, Germany, 4MR R&D Collaborations, Siemens Healthcare, Cary, NC, United States, 5Center for Advanced Magnetic Resonance Development, Duke University Medical Center, Durham, NC, United States
Synopsis
In prostate DWI, low SNR often causes inaccuracy in ADC quantification if not compensated, especially when using surface array coils. Endorectal coils can be used, although associated with substantial setup time, patient discomfort and complications. In this work, a noise bias correction framework was developed and validated in a Monte Carlo simulation, a diffusion phantom, and 14 prostate imaging subjects. Using data acquired with an endorectal coil as a reference, this framework showed improved accuracy of ADC quantification in the prostate when only non-endorectal coils were used. This framework may allow quantitative prostate diffusion imaging without requiring endorectal coils.
INTRODUCTION
High b-value images are an important component of prostate DWI, but often suffer from low SNR, especially when only external body array coils (BAC, including spine coil elements) are utilized. Low SNR in DWI data sets can cause inaccurate ADC calculations if not compensated.1-4 Endorectal coils (ERC) may be used to improve SNR,5-8 but may lead to substantial setup time, patient discomfort9,10 and complications.10,11
We hypothesized that ADC calculations using a BAC and typical prostate DWI protocols are compromised by noise bias, and aimed to develop a framework to overcome this problem.
THEORY
The noise in the real/imaginary parts and magnitude of complex MRI data conforms to Gaussian and Rician distributions, respectively.11-13 A maximum probability (MP) parameter was identified by finding the noisy magnitude value corresponding to the maximum of the probability density function.3,15,16 The noise standard deviation (SD) map was calculated using a pseudo-replica approach.17,18 With these prerequisites, using a normalization process and a mapping modelling by Chebychev approximation, noise-biased magnitude values were converted to noise-unbiased magnitude values. Methods such as log-linear (LL) and least-squares (LS) fitting can be subsequently applied to obtain noise-unbiased ADC values.METHOD
Monte Carlo Simulation
A Monte Carlo simulation was implemented in Matlab (Mathworks, Natick, MA). Ground-truth values were set for S0, b-values and ADC. Gaussian noise was generated and added to complex data’s real/imaginary parts. Four fitting methods were performed, including (1) LL on averaged b-value images (LL AveB), (2) LS on averaged b-value images (LS AveB), (3) LS on non-averaged b-value images (LS Non-AveB) and (4) LS on non-averaged b-value images with MP noise correction (LS MP-Cor Non-AveB). Error%-SNR curves and error% maps were generated.
Diffusion Phantom
A SE-EPI diffusion sequence was modified to implement the proposed framework. A diffusion phantom (High Precision Devices, Boulder, CO) at 0°C was scanned at 3T (MAGNETOM Skyra, Siemens, Erlangen, Germany) using an 18-channel body array and a 32-channel spine array. Parameters: TR=3000ms, TE=400ms, pixel-size=2.4×2.4mm2, slice-thickness=1mm, GRAPPA×2. Four b-value sets included (1) b=0,1000s/mm2, (2) b=0,2000 s/mm2, (3) b=0,3000s/mm2, and (4) b=0,50,400,800,1200,1600,2000,3000,4000s/mm2, with 3 directions and 32 repetitions.
In Vivo Validation and Statistical Analysis
Under an IRB-approved prospective study with written informed consent, 14 subjects undergoing clinical prostate MRI were scanned. Using a single-channel ERC (Medrad eCoil, Bayer, Whippany, NJ) combined with BAC, the original SE-EPI diffusion sequence was executed to perform LL AveB as a reference. Parameters: TR=5500ms, TE=68ms, pixel-size=1.25×1.25mm2, slice-thickness=3mm, GRAPPA×2, b-value=50,800s/mm2 (2,4 repetitions), directions =3, acquisition time =105s. In a separate acquisition without the ERC, the modified sequence was applied using the BAC: TR=5700ms, TE=67ms, pixel-size=1.93×1.93mm2, slice-thickness=3mm, GRAPPA×2, b-value=50,400,800s/mm2 (2,4,8 repetitions), directions=4, acquisition time=336s. In-plane motion correction (MoCo) was implemented.19 Four methods were performed: (1) LL AveB, (2) LL AveB+MoCo, (3) LS MP-Cor Non-AveB, and (4) LS MP-Cor Non-AveB+MoCo. Peripheral and central regions were segmented on ERC ADC maps, and identified on non-ERC maps. Statistical analyses were performed using R (R Core Team, Vienna, Austria). Linear regression, Bland-Altman analysis and ANOVA (practical equivalence region:±0.05×10⁻³mm2/s) were performed.
RESULTS AND DISCUSSION
Error%-SNR curves for ADC=0.8,1.5 and 3.0×10⁻³mm2/s show that LS MP-Cor Non-AveB is most accurate (Figure 1). Error% maps as a function of SNR and ADC show the largest “Green Zone” (small errors) for LS MP-Cor Non-AveB (Figure 2).
Both LL AveB and LS MP-Cor Non-AveB exhibit similar accuracy of ADC measurements when ADC values are below 1.0×10⁻³mm2/s (Figure 3). For high b-values, LL AveB shows underestimated ADC results for the vials with ADC values above 1.0×10⁻³mm2/s (Figure 3A). In contrast, LS MP-Cor Non-AveB gives consistent results for all the four b-value sets (Figure 3B).
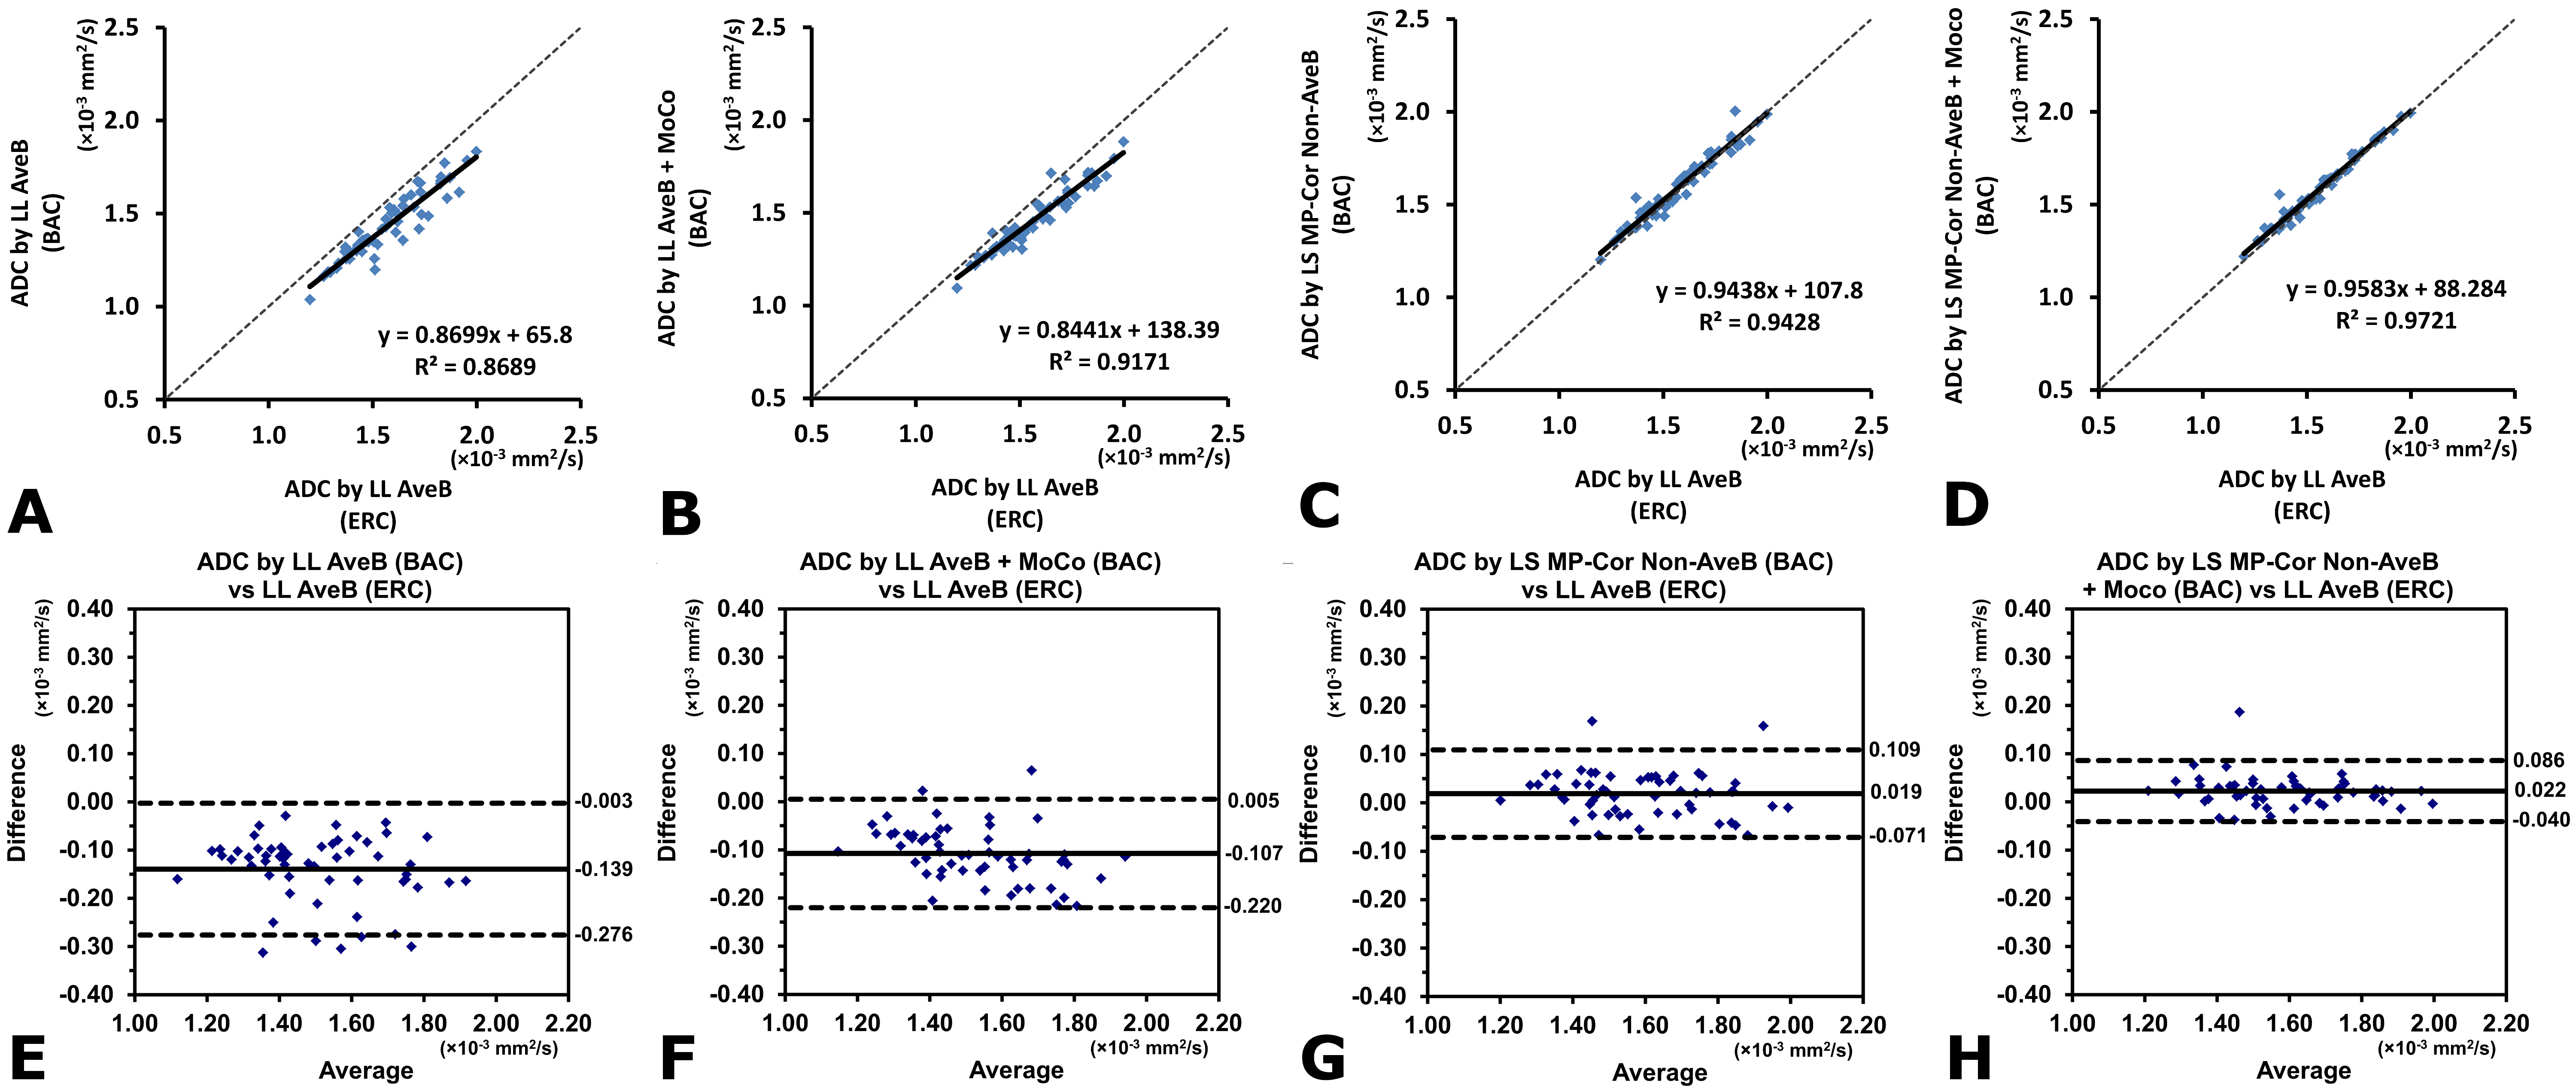
Example acquired images and results from non-ERC and ERC acquisitions are shown (Figure 4). The b0 SNR estimates for the ERC data are 49.4±11.6 and 24.6±6.1 for peripheral and central regions, respectively, in contrast to 13.0±3.5 and 9.6±2.2 for the non-ERC data. The correlations between the ERC reference and the non-ERC results were well improved with LS MP-Cor Non-AveB and less variable with MoCo (Figure 5A-D). ANOVA showed the non-ERC results with LS MP-Cor Non-AveB were practically equivalent to the ERC results, while those without LS MP-Cor Non-AveB were not equivalent (p<0.01), consistent with Bland-Altman plots (Figure 5E-H).
CONCLUSION
In this work, a noise bias correction framework was developed and validated in a Monte Carlo simulation, a diffusion phantom, and 14 prostate imaging subjects. Using data acquired with the endorectal coil as a reference, this framework showed improved accuracy of ADC quantification in prostate when only non-endorectal coils were used. This framework may allow quantitative prostate diffusion imaging without the need to use endorectal coils.Acknowledgements
The authors gratefully acknowledge Vibhas Deshpande, PhD for helpful handling of the diffusion phantom, and Elisabeth Weiland, PhD for valuable discussion of the prostate DWI protocols.References
1. Jones DK, Basser PJ. Squashing peanuts and smashing pumpkins: how noise distorts diffusion-weighted MR data. Magn Reson Med 2004;52:979-993.
2. Koay CG, Chang LC, Carew JD, Pierpaoli C, Basser PJ. A unifying theoretical and algorithmic framework for least squares methods of estimation in diffusion tensor imaging. J Magn Reson 2006;182:115-125.
3. Kristoffersen A. Optimal estimation of the diffusion coefficient from non-averaged and averaged noisy magnitude data. J Magn Reson 2007;187:293-305.
4. Andersson JL. Maximum a posteriori estimation of diffusion tensor parameters using a Rician noise model: why, how and but. Neuroimage 2008;42:1340-1356.
5. Hosseinzadeh K, Schwarz SD. Endorectal diffusion-weighted imaging in prostate cancer to differentiate malignant and benign peripheral zone tissue. J Magn Reson Imaging. 2004;20:654-661.
6. Vargas HA, Akin O, Franiel T, Mazaheri Y, Zheng J, Moskowitz C, Udo K, Eastham J, Hricak H. Diffusion-weighted Endorectal MR Imaging at 3 T for Prostate Cancer: Tumor Detection and Assessment of Aggressiveness. Radiology 2011;259:775-784.
7. Turkbey B, Shah VP, Pang Y, Bernardo M, Xu S, Kruecker J, Locklin J, Baccala AA Jr, Rastinehad AR, Merino MJ, Shih JH, Wood BJ, Pinto PA, Choyke PL. Is apparent diffusion coefficient associated with clinical risk scores for prostate cancers that are visible on 3-T MR images? Radiology 2011;258:488-495.
8. Kobus T, Vos PC, Hambrock T, De Rooij M, Hulsbergen-Van de Kaa CA, Barentsz JO, Heerschap A, Scheenen TW. Prostate cancer aggressiveness: in vivo assessment of MR spectroscopy and diffusion-weighted imaging at 3 T. Radiology 2012;265:457-467.
9. Baur AD, Daqqaq T, Wagner M, Maxeiner A, Huppertz A, Renz D, Hamm B, Fischer T, Durmus T. T2- and diffusion-weighted magnetic resonance imaging at 3T for the detection of prostate cancer with and without endorectal coil: An intraindividual comparison of image quality and diagnostic performance. Eur J Radiol 2016;85:1075-1084.
10. Lee SH, Park KK, Choi KH, Lim BJ, Kim JH, Lee SW, Chung BH. Is endorectal coil necessary for the staging of clinically localized prostate cancer? Comparison of non-endorectal versus endorectal MR imaging. World J Urol 2010;28:667-672.
11. Turkbey B, Albert PS, Kurdziel K, Choyke PL. Imaging localized prostate cancer: current approaches and new developments. AJR Am J Roentgenol 2009;192:1471-1480.
12. Gudbjartsson H, Patz S. The Rician distribution of noisy MRI data. Magn Reson Med 1995;34:910-914.
13. Constantinides CD, Atalar E, McVeigh ER. Signal-to-noise measurements in magnitude images from NMR phased arrays. Magn Reson Med 1997;38:852-857. Erratum in Magn Reson Med 2004;52:219.
14. Dietrich O, Raya JG, Reeder SB, Ingrisch M, Reiser MF, Schoenberg SO. Influence of multichannel combination, parallel imaging and other reconstruction techniques on MRI noise characteristics. Magn Reson Imaging 2008;26:754-762.
15. Walker-Samuel S, Orton M, McPhail LD, Robinson SP. Robust estimation of the apparent diffusion coefficient (ADC) in heterogeneous solid tumors. Magn Reson Med 2009;62(2):420-429.
16. Veraart J, Rajan J, Peeters RR, Leemans A, Sunaert S, Sijbers J. Comprehensive framework for accurate diffusion MRI parameter estimation. Magn Reson Med 2013;70:972-984.
17. Robson PM, Grant AK, Madhuranthakam AJ, Lattanzi R, Sodickson DK, McKenzie CA. Comprehensive quantification of signal-to-noise ratio and g-factor for image-based and k-space-based parallel imaging reconstructions. Magn Reson Med 2008;60:895-907.
18. Wiens CN, Kisch SJ, Willig-Onwuachi JD, McKenzie CA. Computationally rapid method of estimating signal-to-noise ratio for phased array image reconstructions. Magn Reson Med 2011;66:1192-1197.
19. Guetter C, Xue H, Chefd'Hotel C, Guehring J. Efficient symmetric and inverse-consistent deformable registration through interleaved optimization. In 2011 IEEE international symposium on biomedical imaging: from nano to macro:590-593.
Figures