1011
A comprehensive study of machine-assisted classifiers for predicting prostate cancer Gleason grade1Center for Medical Device Evaluation, CFDA, Beijing, People's Republic of China, 2MR Research China, GE Healthcare, Beijing, People's Republic of China, 3Department of Radiology, the First Affiliated Hospital with Nanjing Medical University, Nanjing, People's Republic of China
Synopsis
We performed comprehensive study of eight popularized classifiers for predicting prostate cancer (PCa) Gleason score (GS). The multi-parametric MRI data was obtained from 205 histopathology-confirmed PCa. The MR features were modeled using eight classifiers to predict high-GS (4+4) PCa, including Logistic Regression (LR), Artificial Neural Network (ANN), Support Vector Machine (SVM), Naive Bayes (NB), Relevance Vector Machine (RVM), Least Absolute Shrinkage and Selection operator (LASSO), Discriminant Analysis (DA) and Decision Tree (DT) analysis. Results showed that LASSO and DA had significantly higher area under curve than other classifiers, thus could be valuable for automatic prediction of PCa grade.
INTRODUCTION
Gleason score (GS) is well-validated biomarker of prostate cancer (PCa) that is associated closely with clinical outcomes 1. However, the GS is usually underscored through biopsies owing to random sampling 2. Recently, it shows that machine learning-based approach based multi-parametric MRI (mp-MRI) data had encouraging ability to predict PCa Gleason grade 3. It is still unknown which analysis approach has the highest accuracy and reproducibility for data modeling. Therefore, in this study, we performed comprehensive study of eight popularized machine-assisted classifiers for predicting PCa Gleason grade, regarding to performance accuracy and reproducibility.METHODS
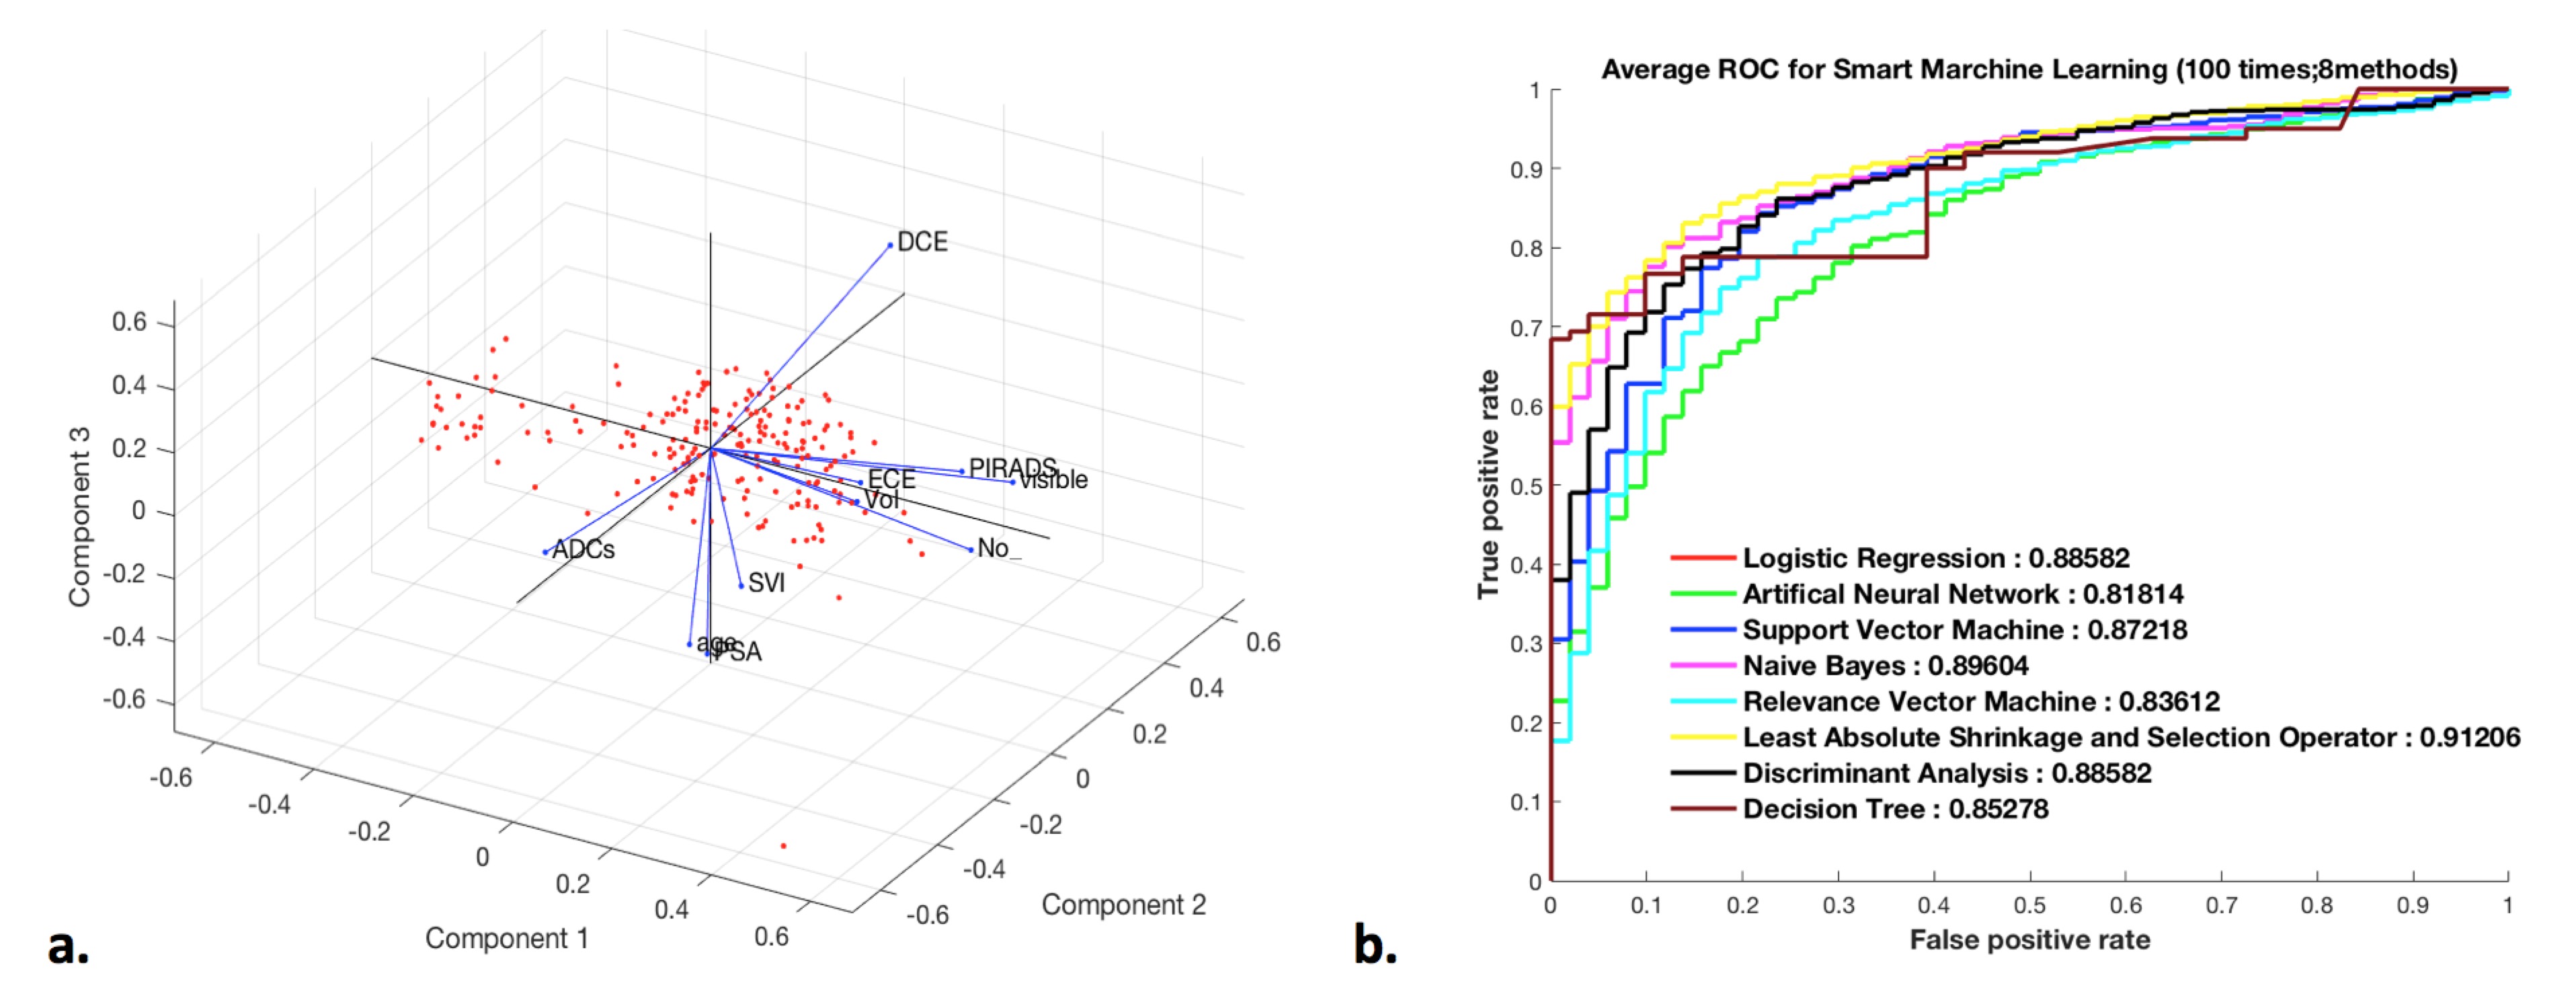
This IRB-approved retrospective study included 205 patients who underwent prostate mp-MRI and were histologically confirmed as PCa after radical prostatectomy. A radiologist and a pathologist identified 205 cancer regions of interest (ROIs) based on correlation of histologic and MR findings. Total 9 image features, i.e., age, PSA, no. of PCa, location, tumor volume, MR DCE type, MR stage, ADCs and PI-RADS v2 score, were included. Machine-assisted analysis model was established by comprehensive evaluation of mp-MRI features via Logistic Regression (LR), Artificial Neural Network (ANN), Support Vector Machine (SVM), Naive Bayes (NB), Relevance Vector Machine (RVM), Least Absolute Shrinkage and Selection operator (LASSO), Discriminant Analysis (DA) and Decision Tree (DT) analysis, respectively, to discriminate high-grade (GS ≥ 4+4) from low/intermediate-grade PCa in 145 training data, and validated in 60 validation data. The performance accuracy was tested via receiver operating characteristic with area under the curve (Az).RESULTS
According to our results, LASSO, NB, LR and DA was the first 4 ranked classifiers that had the highest Az (LASSO: 0.891; 95% confidence intervals [CIs], 0.832-0.931; NB: 0.881; 95% CIs, 0.821-0.932; LR: 0.880; 95% CIs, 0.809-0.912; DA: 0.880; 95% CIs, 0.805-0.911), followed by SVM (0.869; 95% CIs, 0.781-0.902). The ANN, RVM and DT were three last ranked classifiers with the lowest Az (ANN: 0.836; 95% CIs, 0.776-0.901; RVM: 0.827; 95% CIs, 0.765-0.898, and DT: 0.837; 95% CIs, 0.762-0.897). The difference in Az was significant between the first ranked and last ranked classifier groups (p < 0.01). Among all the classifiers, only DT had the largest variability (figure 1).CONCLUSION
In this study, an automatic machine-assisted approach based on seven popularized mathematical methods was developed, which can be effective in distinguishing high-grade from low/intermediate-grade PCa. LASSO analysis had highest performance accuracy, while DT had the lowest Az and largest variability. We concluded that the machine-assisted approach based on mp-MRI has the potential to contribute predictive role in PCa by providing radiologists with quantitative criteria, thereby enabling us to more confidentially detect cancer for better patient counseling and treatment planning.Acknowledgements
No acknowledgement found.References
1. Mottet N,et al. EAU-ESTRO-SIOG Guidelines on Prostate Cancer. Part 1: Screening, Diagnosis, and Local Treatment with Curative Intent. European urology 2016.
2. Hayes JH,et al. Screening for prostate cancer with the prostate-specific antigen test: a review of current evidence. Jama 2014.
3. Park SY, et al. Prostate Cancer: PI-RADS Version 2 Helps Preoperatively Predict Clinically Significant Cancers. Radiology 2016.
Figures