1008
Sparse Prostate Cancers on Whole-Mount Histopathology and Multiparametric MRI1Department of Radiology and Biomedical Imaging, University of California, San Francisco, San Francisco, CA, United States, 2Graduate Group in Bioengineering, University of California, San Francisco and Berkeley, San Francisco, CA, United States, 3Department of Pathology, University of California, San Francisco, San Francisco, CA, United States, 4Department of Urology, University of California, San Francisco, San Francisco, CA, United States
Synopsis
The study purpose was to establish incidence and Gleason Score of sparse lesions on whole-mount histopathology in post-prostatectomy samples and to identify imaging characteristics associated with sparse cancers detected on multiparametric MRI (mpMRI). Based on histopathology, sparse lesions were smaller than dense lesions (0.065cc vs 0.916cc), with the majority (56/57 sparse) being low-grade (GS3+3). On imaging, we found statistically significant differences between sparse GS3+3 and benign tissues on apparent diffusion coefficient and peak enhancement maps. This combined with small-size and low-grade, and thus low clinical importance [1] of sparse lesions suggests that current mpMRI capabilities are sufficient to characterize these lesions.
Purpose
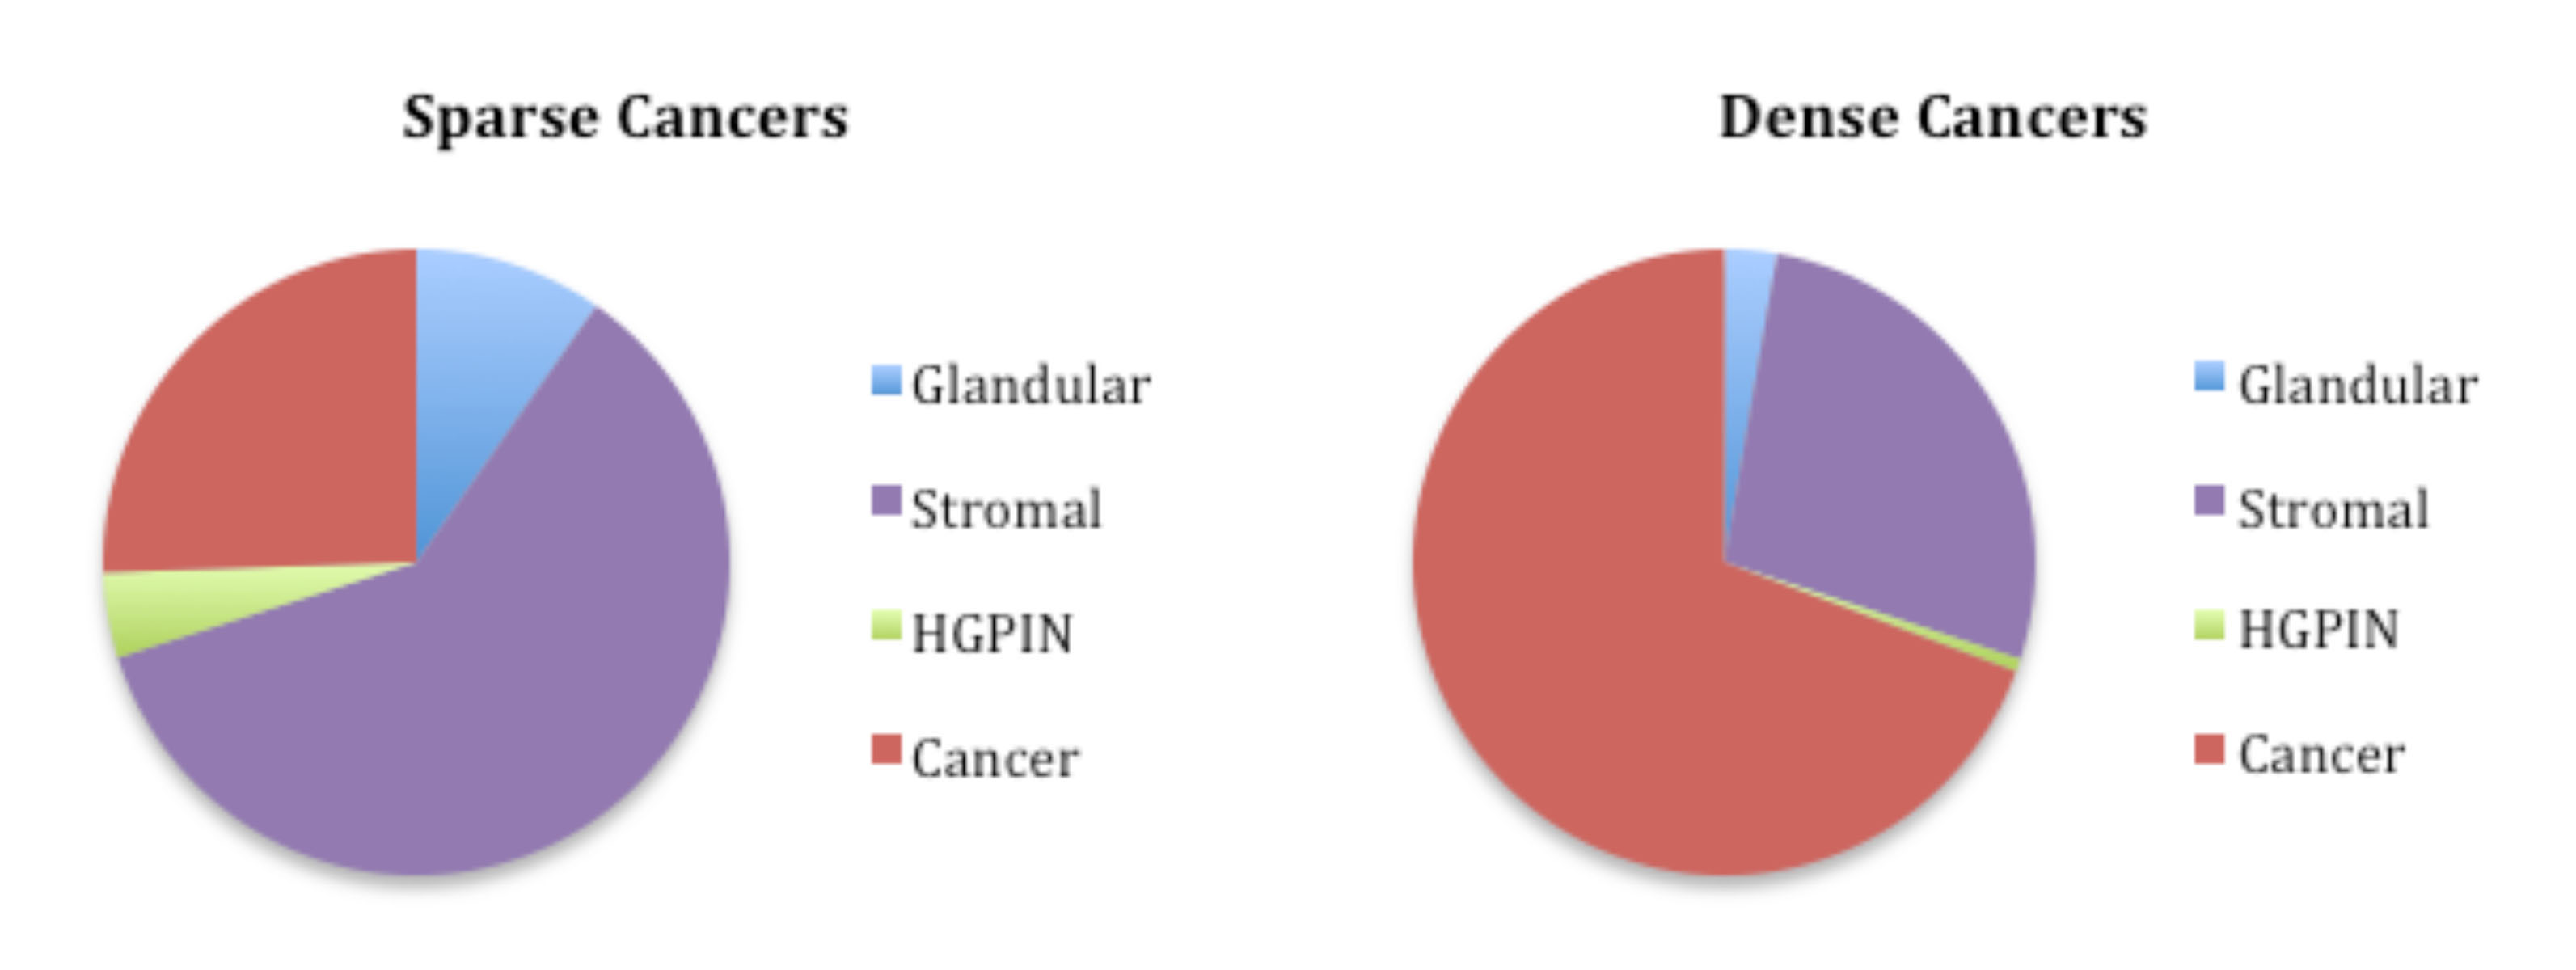
Tissue heterogeneity is common in prostatic cancers (PCa) (Figure1). The study purpose was: 1) to establish the incidence and Gleason Score of sparse lesions on whole-mount histopathology in post-prostatectomy samples; and 2) to identify the imaging characteristics associated with sparse cancer regions detected on multiparametric MRI (mpMRI).Methods
This study included 68 men with untreated PCa who received 3T-MR scans prior to undergoing prostatectomy.
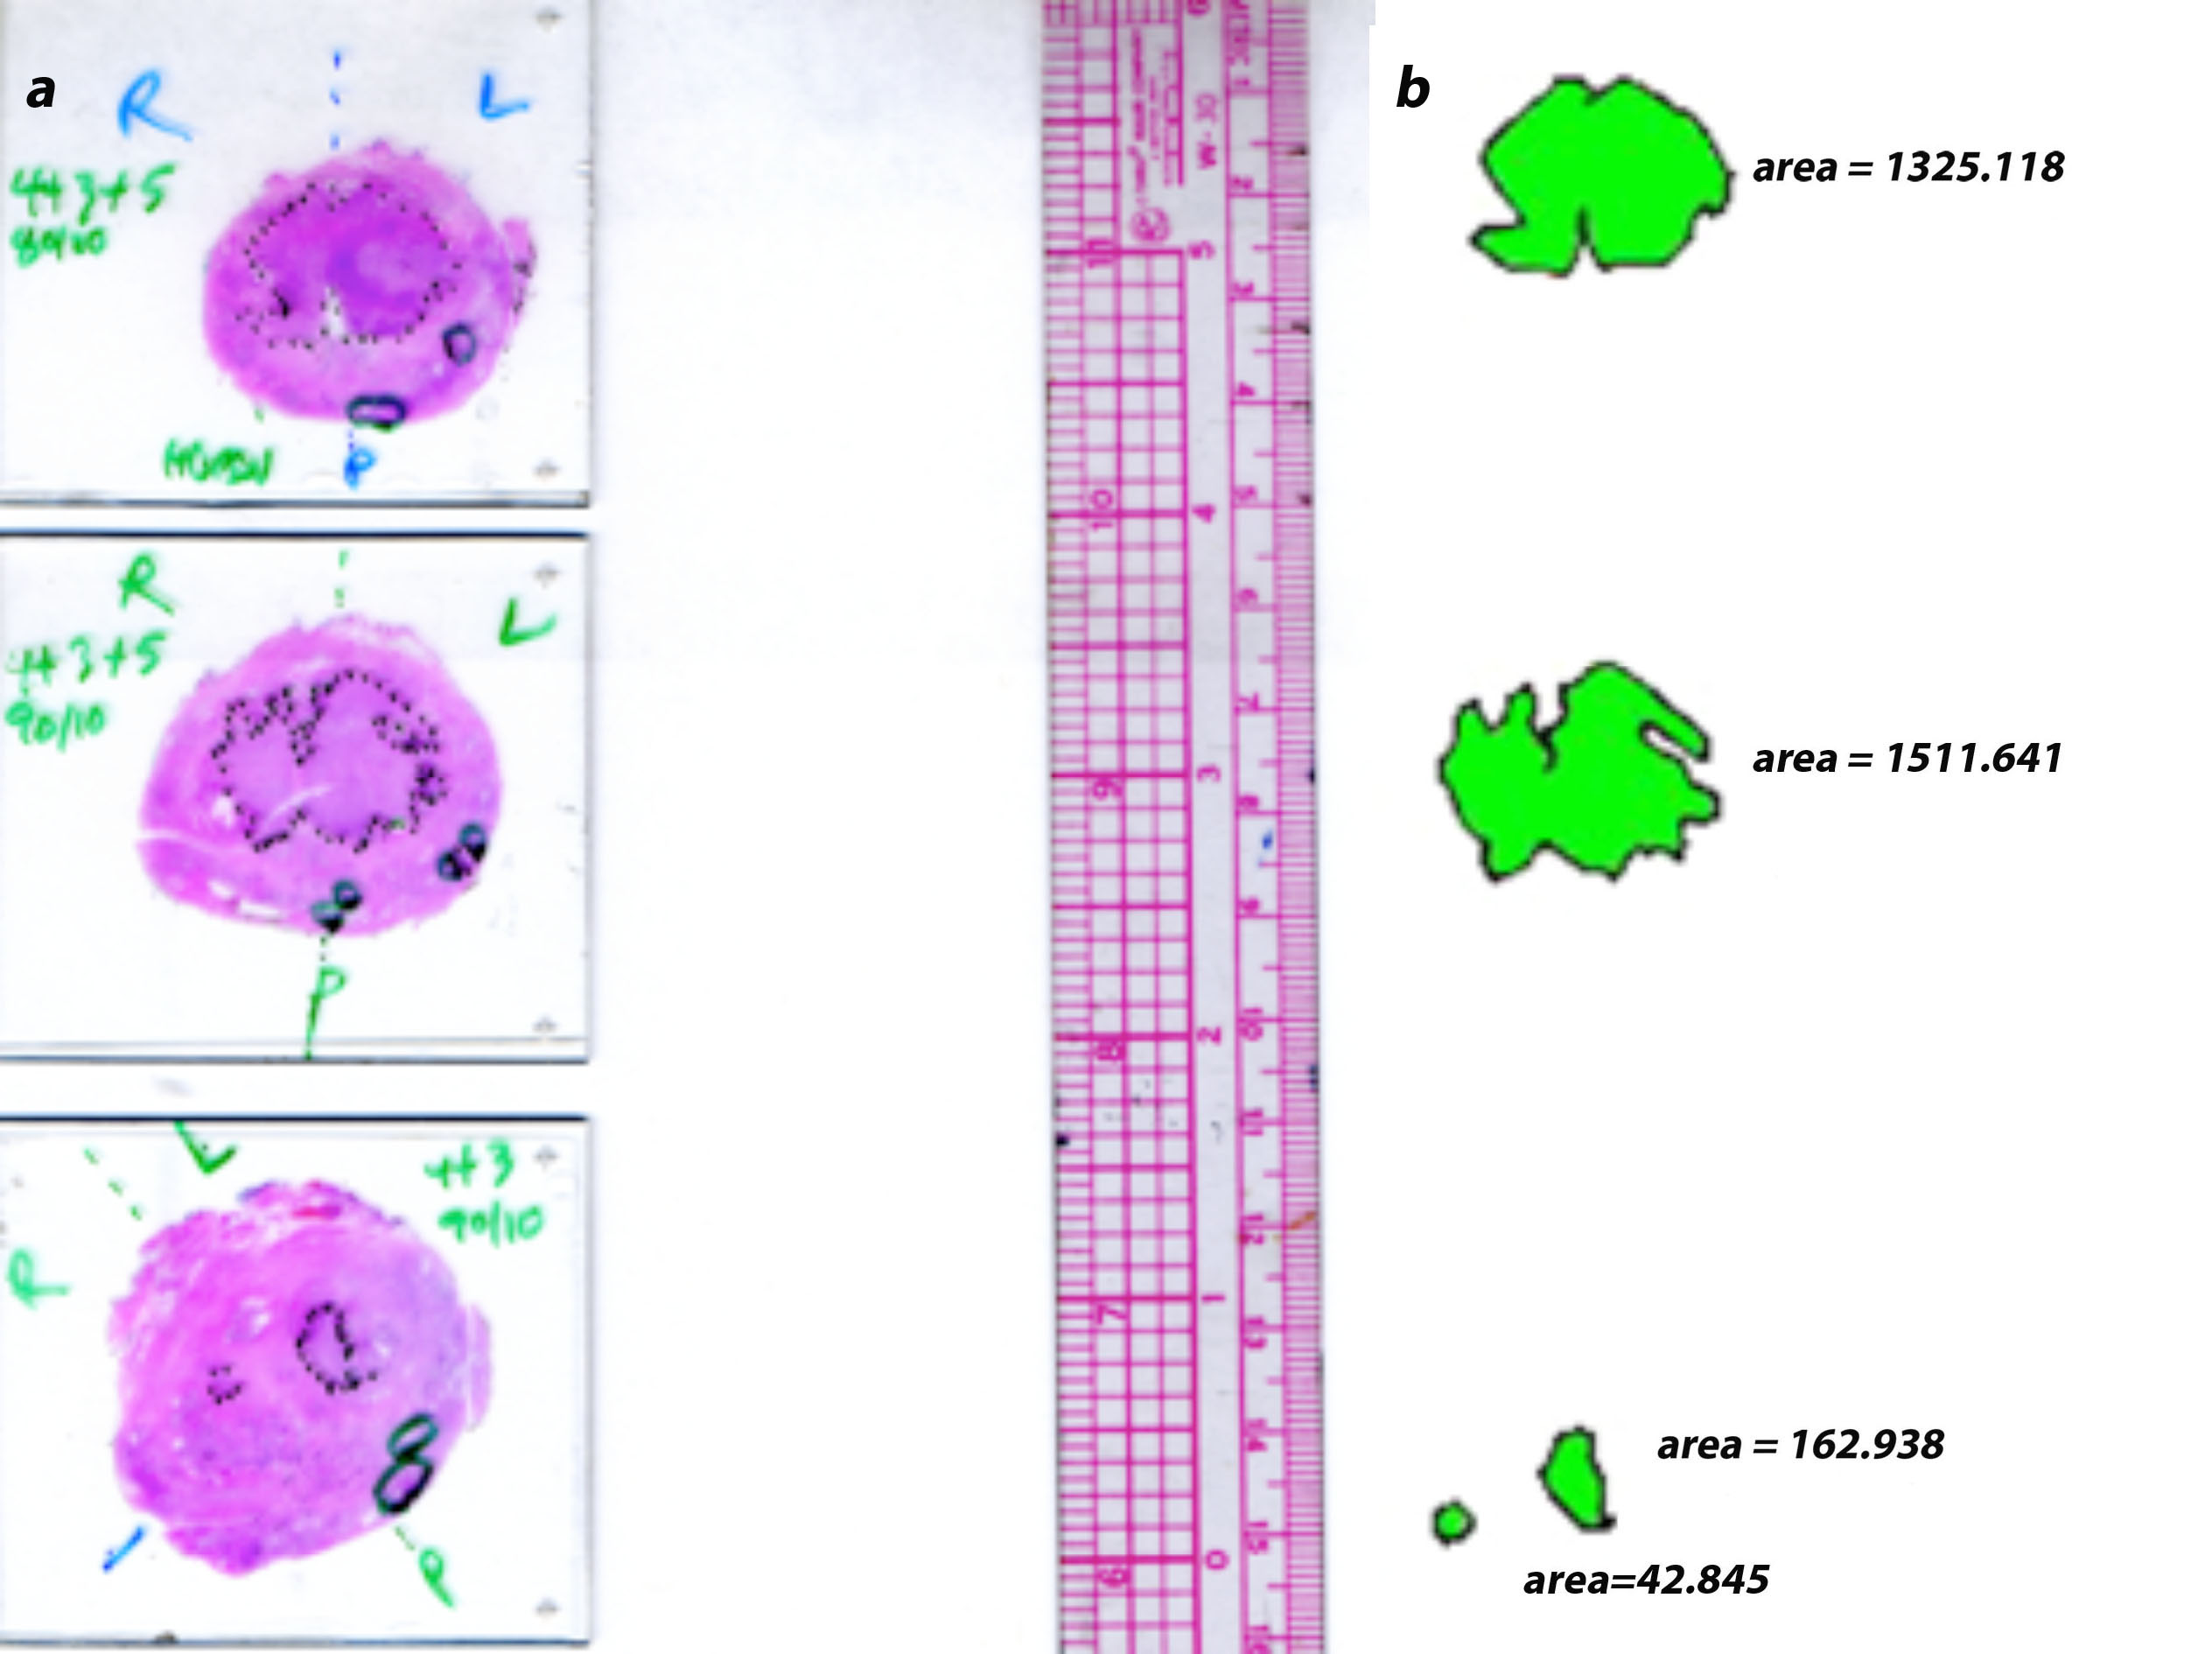
Histopathology: Post-prostatectomy, all prostate specimens were processed whole-mount. During histopathological review, cancerous regions on each slide were outlined and graded using the Gleason system, with the amount of cancer in each region estimated. Regions with cancer occupying <50% and ≥50% of the cross-sectional area were considered sparse and dense respectively. Histopathology slides and a standard ruler were digitized (Figure 2a). Digitized slides were processed using in-house semiautomatic software written in Matlab to compute the area of each cancerous region (Figure 2b). For data analysis, contiguous 2D cancer regions identified on histopathology were grouped into 3D lesions and volumes calculated. Lesions were classified as sparse or dense. Sparse lesions were defined as lesions without any dense 2D regions; lesions containing any dense 2D regions were classified as dense.
MpMRI: Regions of interest (ROI) were manually drawn freeform in the peripheral zone (PZ) on T2-weighted images based on histopathology, using anatomical cues, following a consensus of two readers and keeping within regions of homogeneous signal intensity. Within each patient, ROIs were grouped based on tissue type, Gleason Score, and sparse/dense composition. Imaging measures consisting of T2-weighted image intensity, apparent diffusion coefficient (ADC), semi-quantitative dynamic contrast-enhanced (DCE) MRI parameters of peak enhancement, maximal enhancement slope, and washout slope were computed. For analysis, ROI area-weighted averages for each imaging measure were calculated for each tissue type and sparse/dense composition per patient. Non-parametric Wilcoxon signed-rank tests were used to compare imaging metrics between normal tissues (normal PZ and cystic atrophy) and sparse Gleason Score (GS) 3+3 PCa, benign tissues (normal tissues combined with atrophy and inflammation) and sparse GS3+3 PCa, sparse and dense GS3+3 regions, as well as sparse ≥GS3+4 and dense GS3+3 cancers. Measures were reported as median(Q1, Q3). A p<0.05 defined statistical significance.
Results
Histopathology: Altogether, 255 lesions (57 sparse and 198 dense) were identified in 68 patients. The mean lesion volumes were 0.065±0.081cc and 0.916±1.607cc for sparse and dense lesions with 29.6±8.68% and 71.2±11.38% cancer composition respectively. Out of the 57 sparse lesions, 56 lesions were GS3+3 and only one lesion was higher grade (GS4+3+5), with tertiary Gleason 5 pattern signaling poor prognosis [2]. Interestingly, sparse lesions were only found in the PZ.
MpMRI: On imaging, 42 sparse and 211 dense cancerous 2D ROIs were drawn. On average, sparse and dense ROIs were 0.12±0.07cc and 0.25±0.28cc, respectively. Out of the 42 sparse ROIs, 27 were GS3+3, while 15 contained a ≥Gleason 4 component. Statistically significant differences were found between normal tissues and sparse GS3+3 for T2-weighted imaging(AU) - Normal: 2726(2511,3624) > Sparse: 2239(1741,2680); ADC(AU) - Normal: 1801(1684,1973) > Sparse: 1405(1181,1549), peak enhancement(%baseline) - Normal: 136(132,151) < Sparse: 151(143,155) and slope(%baseline/min) - Normal: 91(79,135) < Sparse: 126(100,150). When comparing benign tissues, statistically significant differences were found on ADC(AU) - Benign: 1693(1601,1823) > Sparse: 1405(1181,1549) and peak enhancement(%baseline) - Benign: 144(137,153) < Sparse: 151(143, 155). No statistically significant differences were found between sparse and dense GS3+3 lesions or between sparse ≥G3+4 cancers and dense GS3+3 cancers for any of the modalities.
Discussion
Our prostate cancer histopathological findings suggest that on average sparse lesions are smaller than dense lesions (0.065cc vs 0.916cc) and are primarily low-grade, with 56/57 sparse lesions being GS3+3 and only a single higher grade (GS4+3+5) lesion in this cohort. MpMRI characterization of sparse lesions has been limited; the most widely cited imaging publication available on the subject, with N=10 patients scanned at 1.5T, reported no statistically significant differences between sparse cancers and normal tissues on T2-weighted imaging or ADC [3]. In our study, we found statistically significant differences between sparse and benign tissues and established that sparse GS3+3 and ≥GS3+4 cancers have similar imaging characteristics to dense GS3+3 cancers. Of note, the patient with the GS4+3+5 lesion (0.175cc) also had two larger, dense, readily MR-detectable, GS4+3 (1.04cc) and GS3+4 (1.13cc) lesions. As small size and low-grade cancers have minimal metastatic potential [1], our histopathological findings that the purely sparse lesions are small and primarily low grade, suggest they have limited clinical significance. Additionally, the finding that our mpMRI methods detect significant differences between such sparse cancer regions and benign tissues suggests that our current detection capabilities of these lesions on MRI are likely sufficient.Acknowledgements
R01-CA148708, R01-CA137207References
1) Ahmed HU, Arya M, Freeman A, Emberton M. Do Low-grade and Low-volume Prostate Cancers Bear the Hallmarks of Malignancy? The Lancet Oncology. 2012: 13(11): e509-e517.
2) Mosse CA, Magi-Galluzzi C, Tsuzuki, T. Epstein JI. The Prognostic Significance of Tertiary Gleason Pattern 5 in Radical Prostatectomy Specimens. The American Journal of Surgical Pathology. 2004: 28(3): 394-398.
3) Langer DL, van der Kwast TH, Evans, AJ et al. Intermixed Normal Tissue within Prostate Cancer: Effect on MR Imaging Measures of Apparent Diffusion Coefficient and T2 – Sparse versus Dense Cancers. Radiology. 2008; 249(3): 900-908.
Figures