1006
Quadrupolar jump-and-return sequence for sodium knee MRI at 7 tesla1Radiology, New York University, New York, NY, United States
Synopsis
Glycosaminoglycans (GAGs) is an important biomarker for the diseases related to the degradation of cartilage tissues. The GAG content in cartilage tissue is known to be well correlated with the sodium concentration. In addition, the collagenous extracellular matrices of cartilage tissues provide sodium ions with ordered environments. Recently, the so-called quadrupolar jump-and-return (QJR) sequence has been developed, which can selectively detect sodium ions in ordered environments. In this work, we demonstrate the feasibility of the QJR sequence for in vivo knee MRI by assessing its performance on the contrast modification to cartilage tissues and fluid.
PURPOSE
Glycosaminoglycans (GAGs) is an important biomarker for the diseases related to the degradation of cartilage tissues, such as osteoarthritis (OA) and degenerative disc diseases (DDD).1,2 The concentration of sodium is well correlated with the GAG content,3-5 and sodium MRI methodologies have been investigated to access such information.6,7
The collagenous extracellular matrices in cartilage tissues are known to provide ordered environments, and it has been shown ex vivo that the sodium signals from the ordered environments decrease as cartilage tissues are depleted, while the quadrupolar couplings increases.8
Recently, the so-called quadrupolar jump-and-return (QJR) sequence has been developed, which can detect sodium ions in ordered environments while suppressing those in isotropic media.9 In this work, we demonstrate the feasibility of the QJR sequence for in vivo knee MRI by assessing its performance on the contrast modification to cartilage tissues and fluid.
QUADRUPOLAR JUMP-AND-RETURN
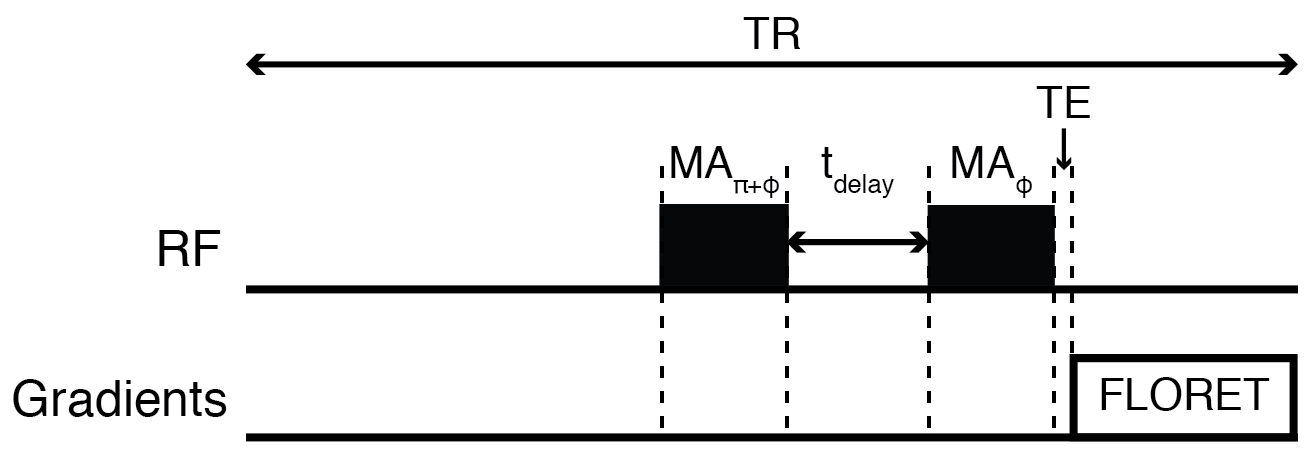
The QJR sequence consists of two opposite-phased pulses separated by a delay: (-α)y-tdelay-(+α)y, where α and y indicates the flip angle and phase of the pulses, respectively. For a spin-3/2 and in the presence of a quadrupolar coupling, the signals from the satellite transitions may be suppressed when α = cos-1(1/√3) ≅ 54.7°, which is the magic angle. At the same time, the signal from the central transition is supposed to be 2√2/5 ≅ 0.5657, which is √2 times the signal intensity of the central transition at the thermal equilibrium excited by a single 90° pulse.METHODS
After approval from the institutional review board (IRB) of the New York University and signed informed consent, the right knee joints of five healthy volunteers [3 males (mean age = 32.4 ± 1.3 years) and 2 females (mean age = 27.9 ± 1.0 years); mean age = 30.6 ± 2.7 years] were scanned on a 7 T Siemens scanner with an in-house built double-tuned coil with eight 23Na channels and four 1H channels. For each volunteer, one reference and five QJR images were recorded. The QJR pulse sequence as well as the detailed information on the parameters used in this study are presented in Figure 1.
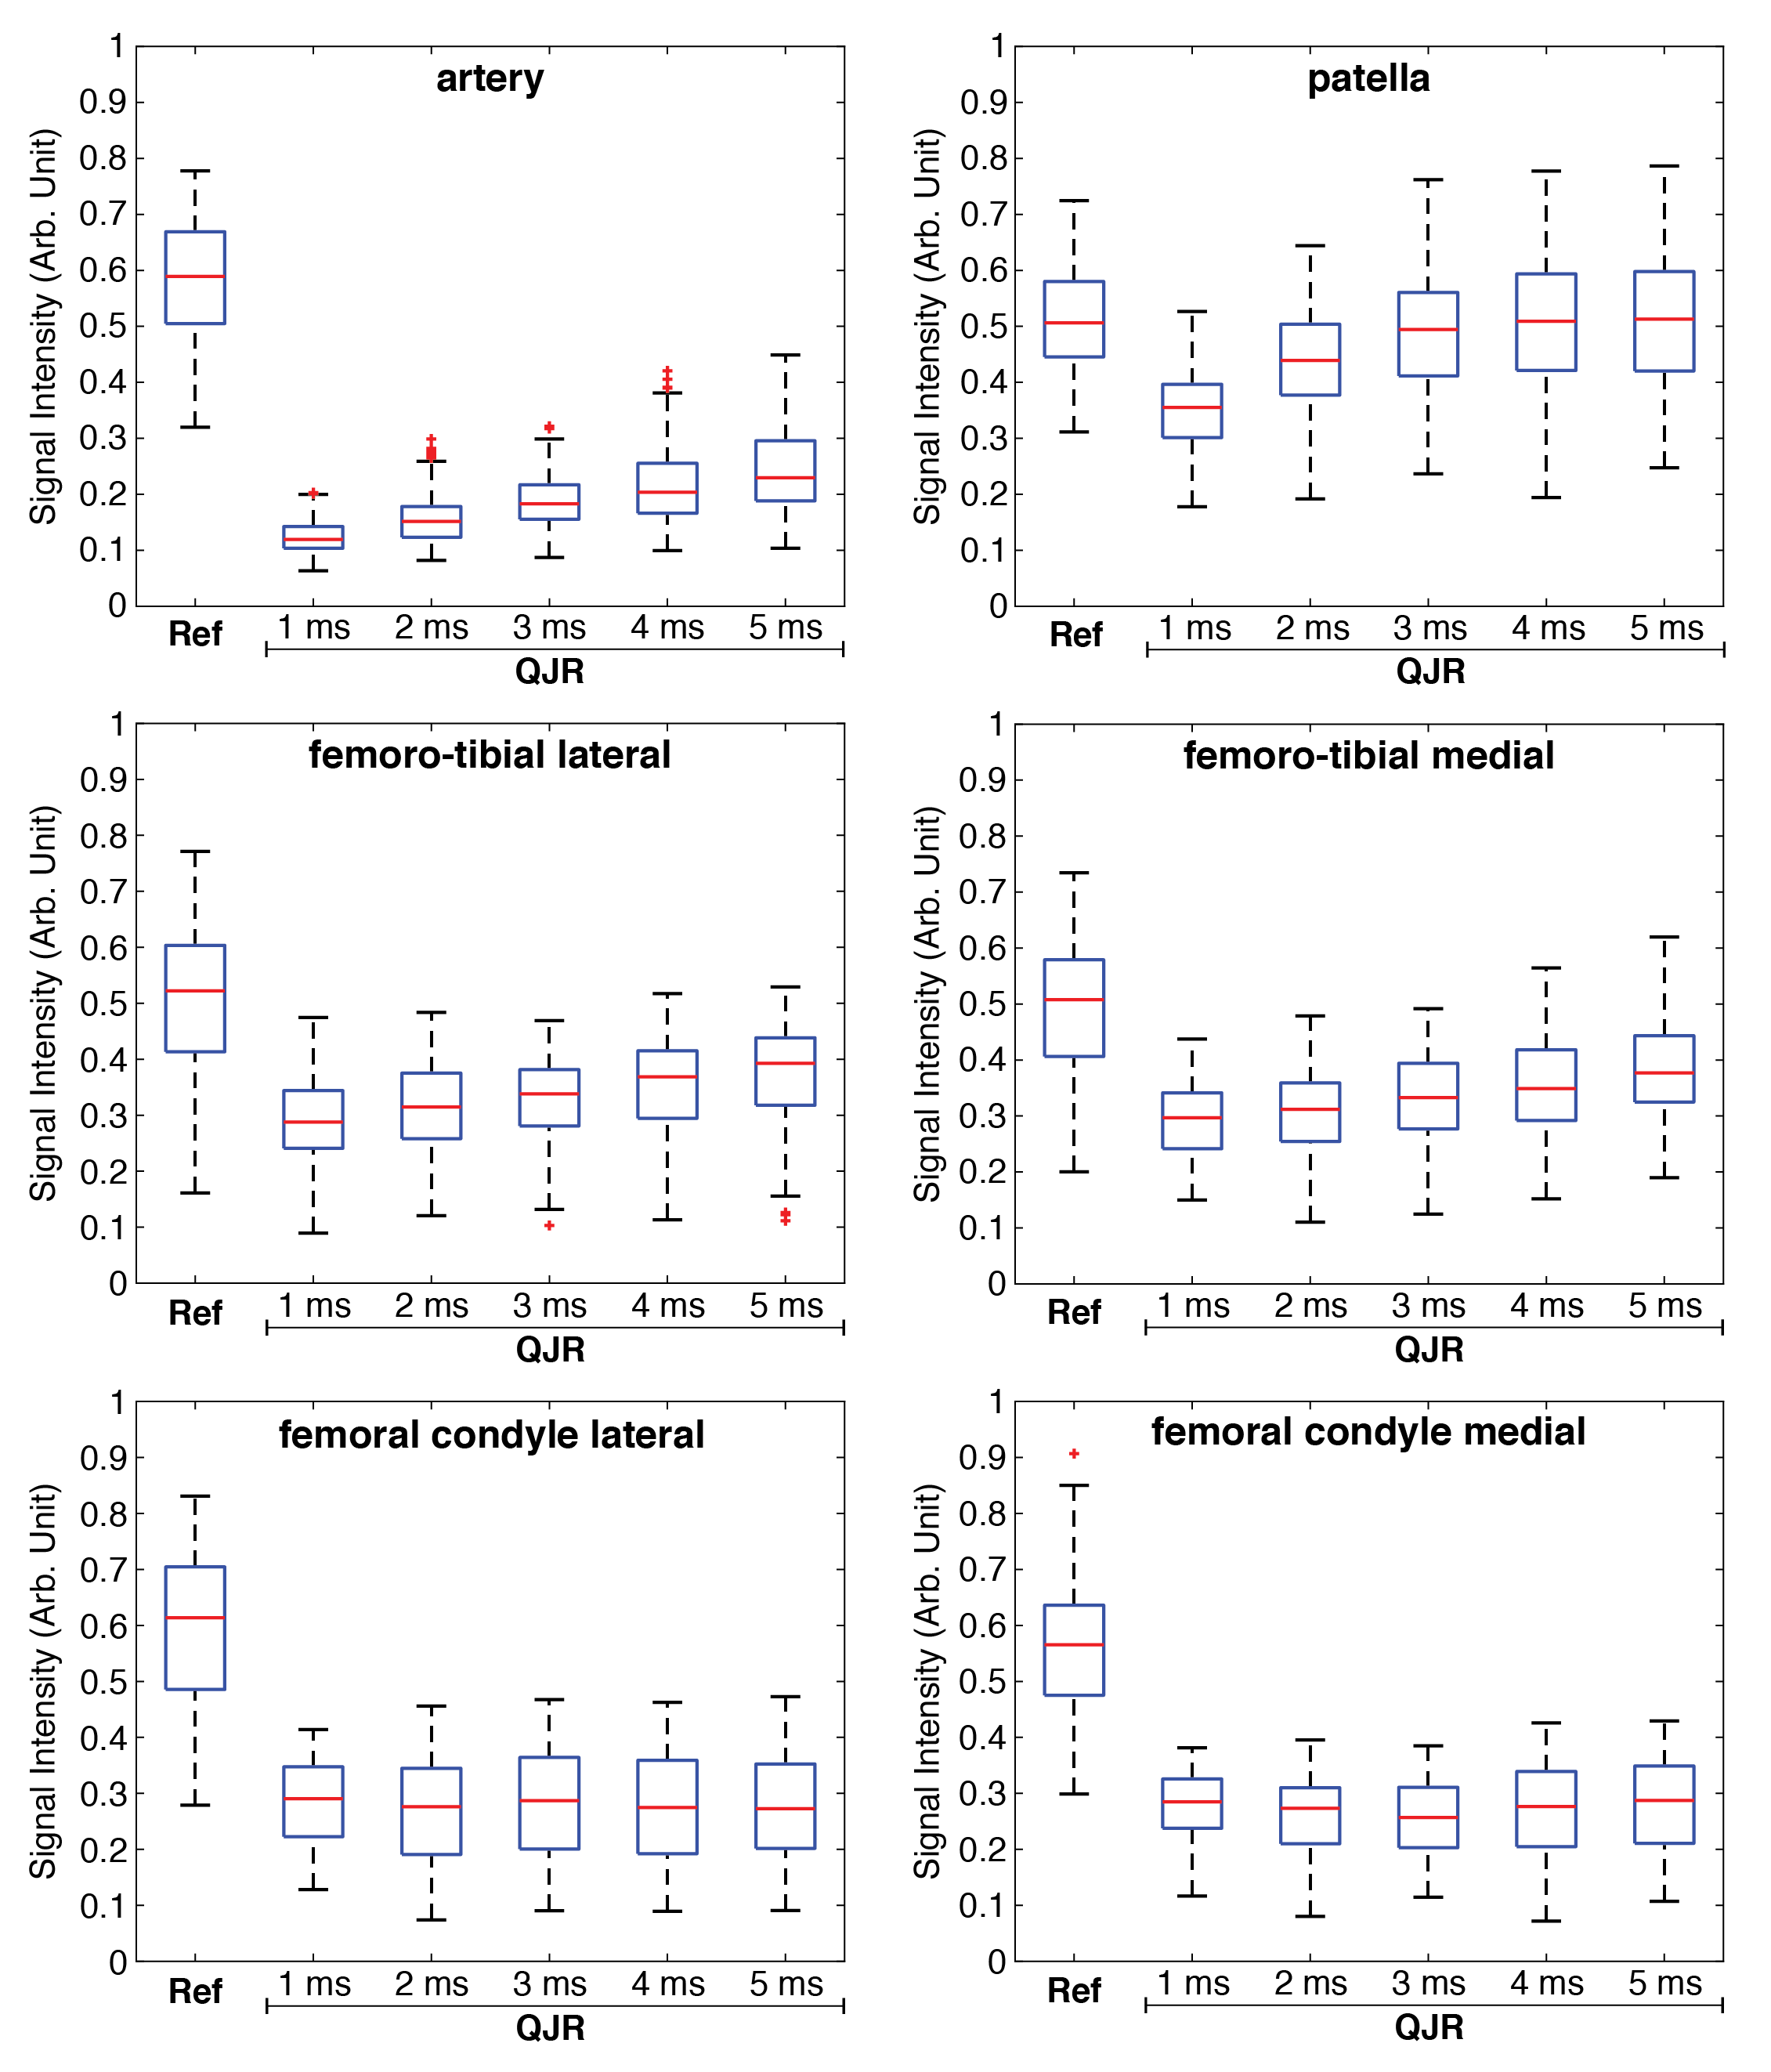
The image reconstruction was performed by using standard 3D regridding.10 The matrix size was 128×128×128 with the nominal resolution of 2 mm. To evaluate fluid suppression and tissue contrast, six regions of interest (ROIs) were defined on artery, patella cartilage, lateral and medial femorotibial cartilage, and lateral and medial femoral condyle cartilage.
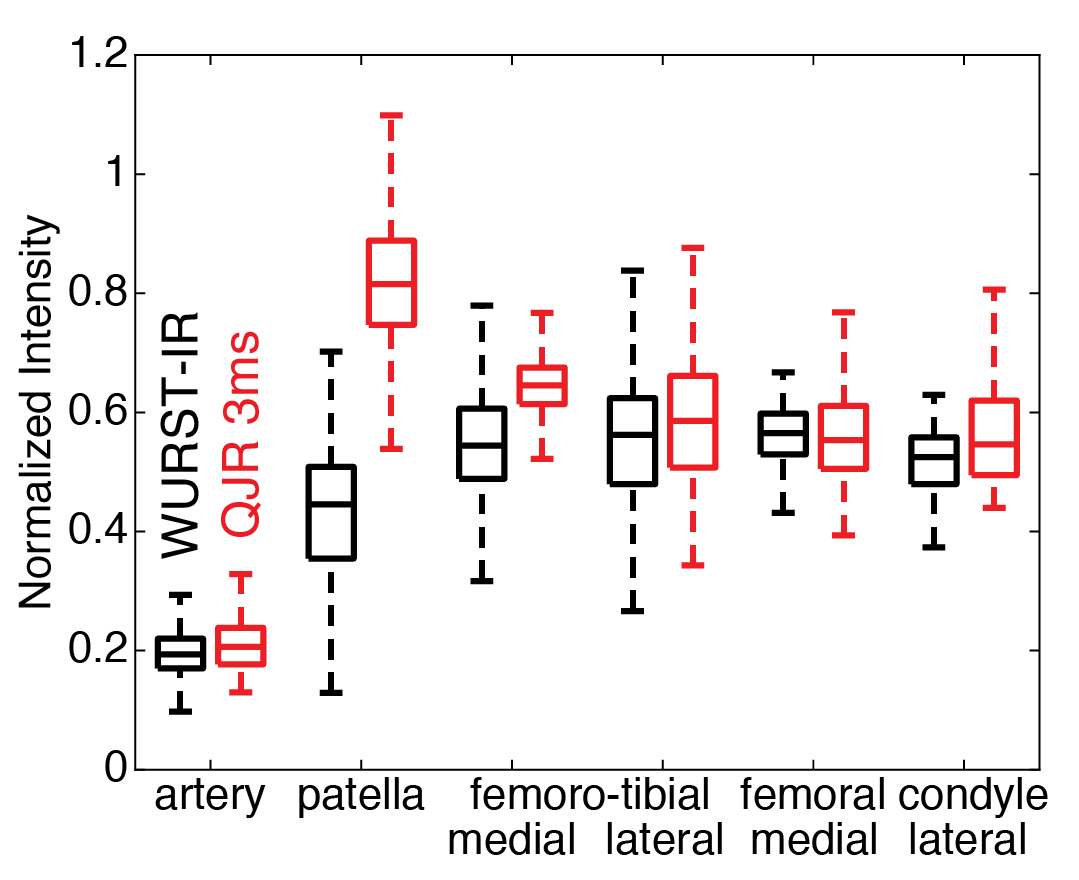
On one volunteer, the QJR and WURST-IR7 scans were additionally performed. For these scans, TR was 140 ms, the delay for the QJR scan 3 ms, and the recovery delay for the WURST-IR scan 19 ms.7,11 The reference scan was acquired with a 90° pulse.
RESULTS
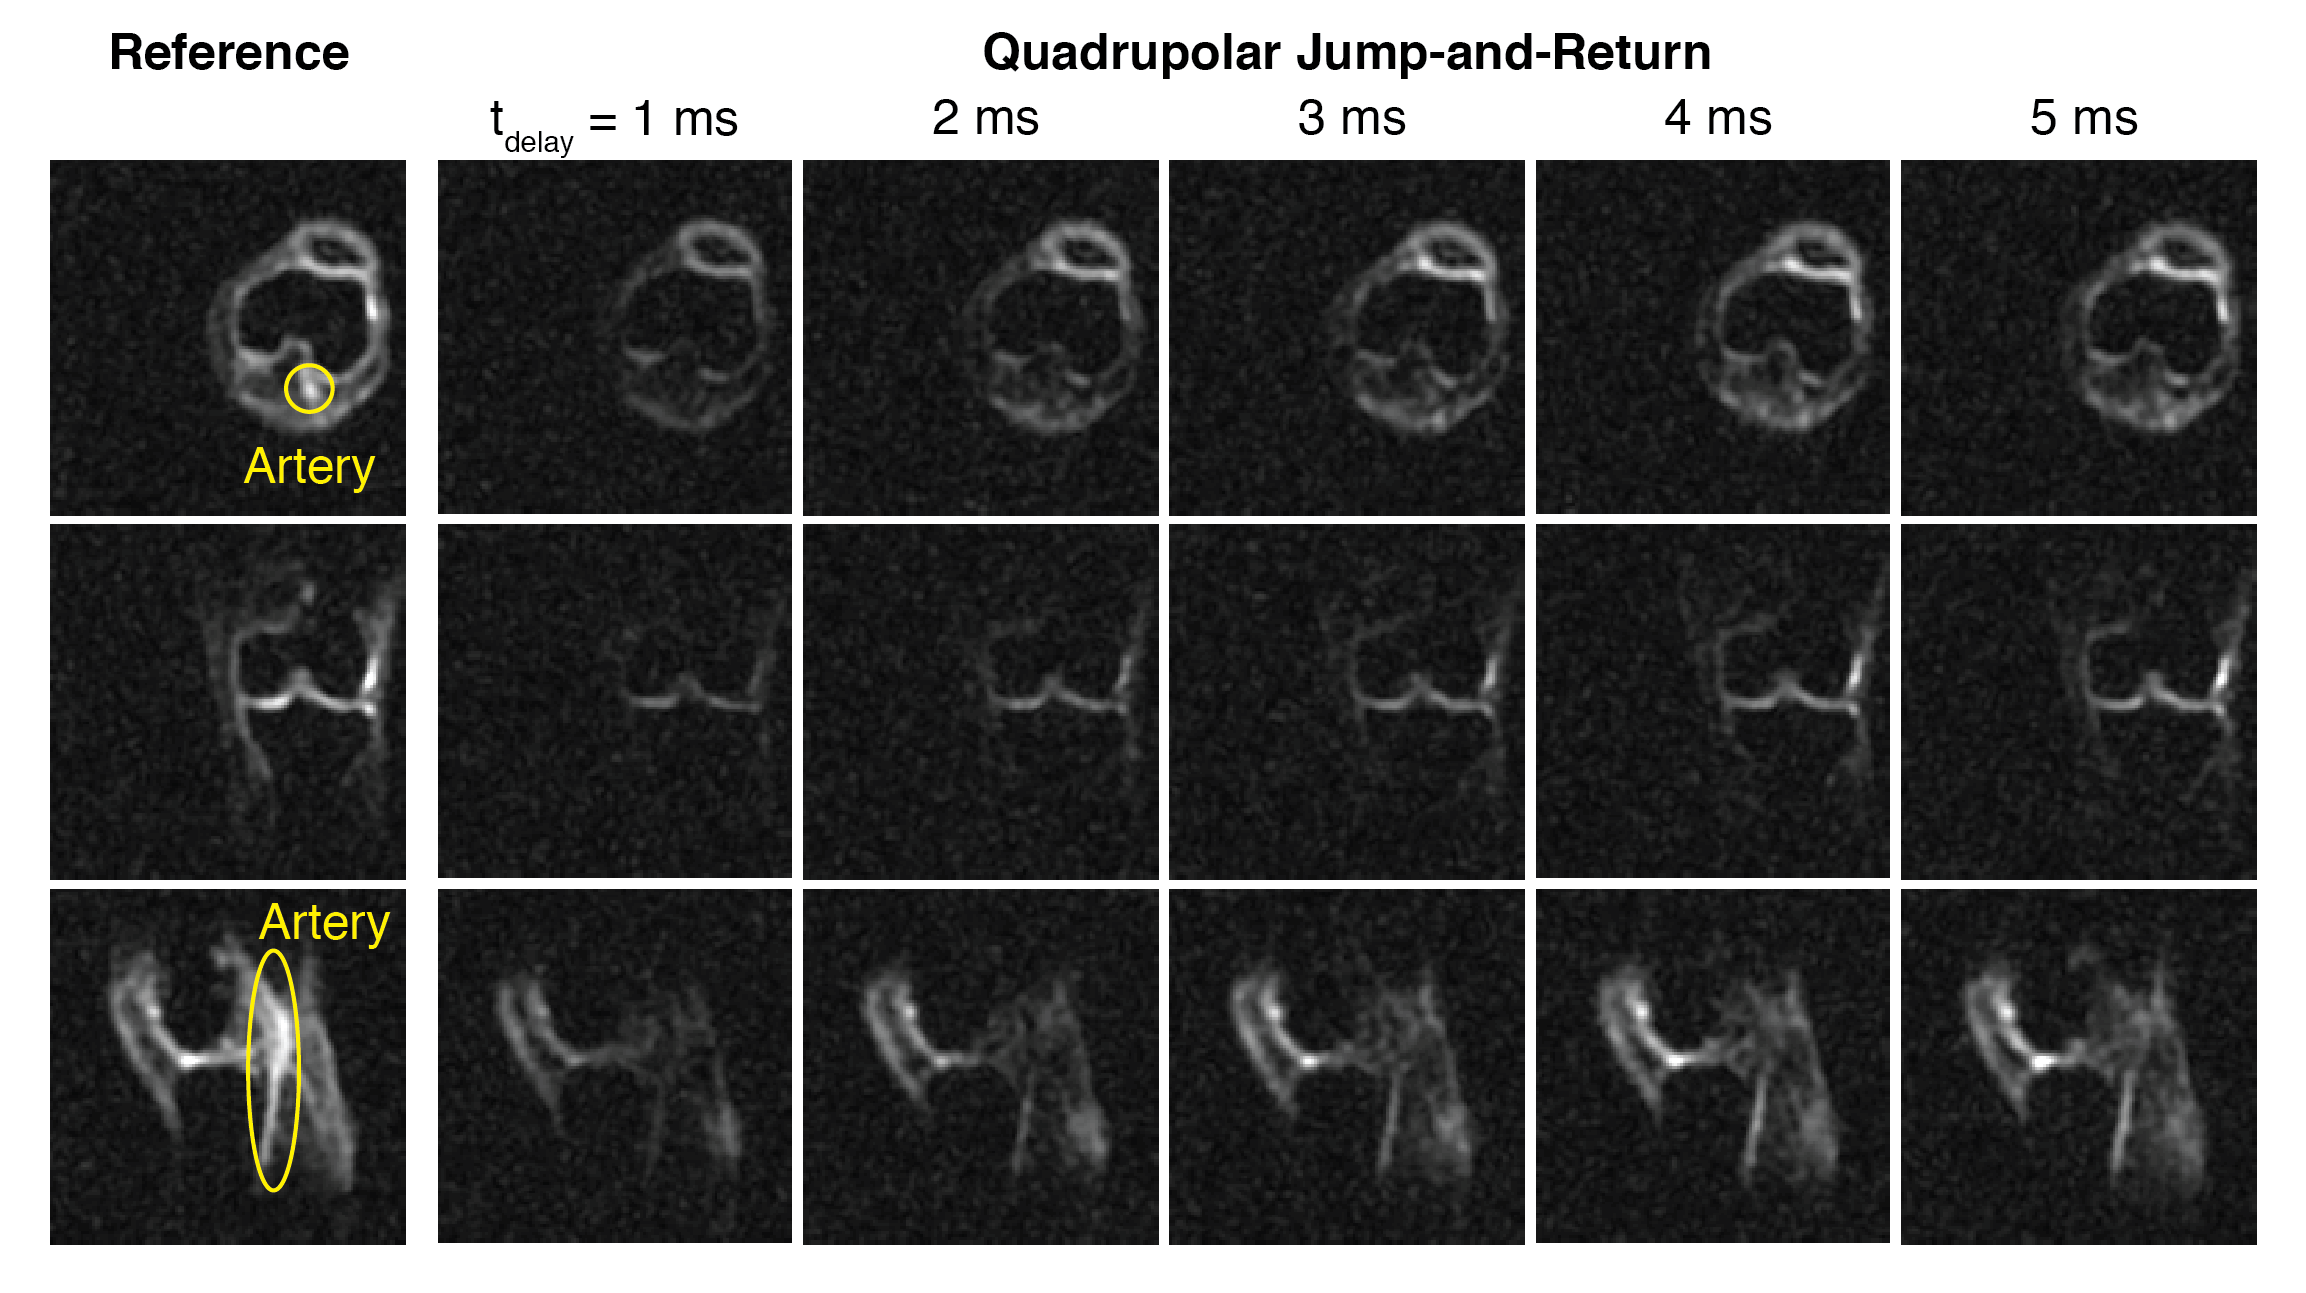
From the sodium 3D images of the right knee of a healthy volunteer, representative slices are presented in Figure 2. On the axial and sagittal slices, the suppression of the artery is clearly demonstrated. For the individual ROIs, the boxplots of signal intensities are displayed in Figure 3. The SAR values displayed on the scanner were 12% for the reference scan and 23% for the QJR scans.
The signal intensities normalized to those of the reference scan are presented as the boxplots in Figure 4. While the level of the fluid suppression can be kept similar, the signal intensities from the QJR scan were equal or greater than those from the WURST-IR scan. The SAR values displayed on the scanner were 17% for the QJR scan, which is lower than the above because of the longer TR, and 79% for the WURST-IR scan.
DISCUSSION
Fluid suppression became less efficient as the delay increases, which may be caused by the B0 field inhomogeneity. In cartilage tissues, the signal intensities on most of the ROIs increased or unchanged as the delay got incremented. For patella of some volunteers, the signal intensities displayed maxima when the delay was 3 or 4 ms, which may be related to the quadrupolar couplings.
CONCLUSION
The first in vivo QJR scans were performed on the knee joints at 7 T. This preliminary result shows that the fluid suppression and tissue contrast can be similar with those from the conventional method based on the inversion recovery. In addition, the QJR scan manifests the shorter scan time and the reduced SAR.Acknowledgements
Research reported in this publication was supported in part by the National Institute of Arthritis and Musculoskeletal and Skin Diseases of the National Institutes of Health under Award Numbers NIH K25 AR060269, R01 AR060238, R01 AR067156, R01 AR068966 and was performed under the rubric of the Center for Advanced Imaging Innovation and Research (CAI2R, www.cai2r. net), a NIBIB Biomedical Technology Resource Center (NIH P41 EB017183). The content is solely the responsibility of the authors and does not necessarily represent the official views of the National Institutes of Health.References
1. Gold GE, Burstein D, Dardzinski B, et al. MRI of articular cartilage in OA: novel pulse sequences and compositional/functional markers. Osteoarthr. Cartil. 2006;14:A76–A86.
2. Insko EK, Clayton DB, Elliott MA. In vivo sodium MR imaging of the intervertebral disk at 4 T. Acad. Radiol. 2002;9:800–804.
3. Navon G, Shinar H, Eliav U, Seo Y. Multiquantum filters and order in tissues. NMR Biomed. 2001;14:112–132.
4. Rong P, Regatte RR, Jerschow A. Clean demarcation of cartilage tissue 23Na by inversion recovery. J. Magn. Reson. 2008;193:207–209.
5. Choy J, Ling W, Jerschow A. Selective detection of ordered sodium signals via the central transition. J. Magn. Reson. 2006;180:105–109.
6. Borthakur A, Hancu I, Boada FE, et al. In vivo triple quantum filtered twisted projection sodium MRI of human articular cartilage. J. Magn. Reson. 1999;141:286–90.
7. Madelin G, Lee J-S, Inati S, Jerschow A, Regatte RR. Sodium inversion recovery MRI of the knee joint in vivo at 7T. J. Magn. Reson. 2010;207:42–52.
8. Ling W, Regatte RR, Schweitzer ME, Jerschow A. Behavior of ordered sodium in enzymatically depleted cartilage tissue. Magn. Reson. Med. 2006;56:1151–5.
9. Lee J-S, Regatte RR, Jerschow A. Selective detection of ordered sodium signals by a jump-and-return pulse sequence. J. Magn. Reson. 2009;200:126–9.
10. Pipe JG, Menon P., Sampling density compensation in MRI: rationale and an iterative numerical solution. Magn. Reson. Med. 1999;41:179–186.
Figures