1002
In vivo whole-blood $$$T_2$$$ versus $$$HbO_2$$$ calibration by modulating blood oxygenation level in the femoral vein through intermittent cuff occlusion1Radiology, University of Pennsylvania, Philadelphia, PA, United States, 2Obstetrics and Gynecology, University of Pennsylvania, Philadelphia, PA, United States
Synopsis
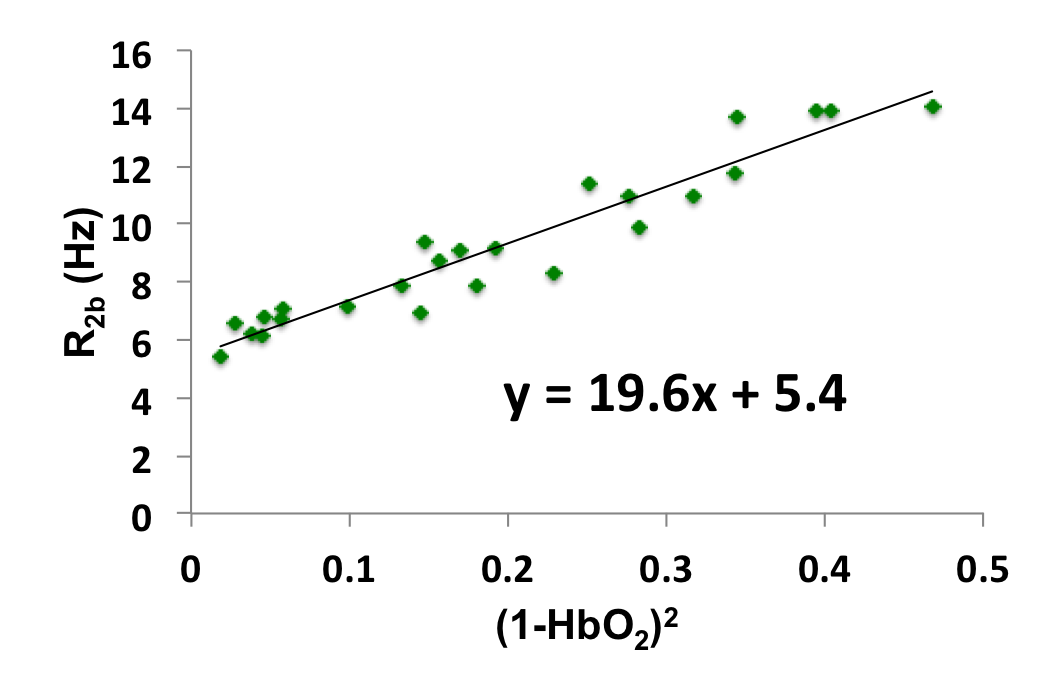
The relationship between whole-blood T2 and blood hemoglobin oxygen saturation (HbO2) can be modeled as $$${1\over T_{2b}}={1\over T_{2o}}+K(1-HbO_2)^2$$$, where K and T2o are determined empirically in vitro. The feasibility of estimating K and T2o in vivo is investigated with T2-prepared bSSFP at 1.5T in the superficial femoral vein (SFV) with intermittent cuff occlusion. In this manner a range of HbO2 were achieved allowing quantification of venous oxygen saturation via MR susceptometry, a method that had been validated rigorously against blood gas analysis. Initial result (K=19.6Hz, T2o=185ms) is lower than the literature value (24.6Hz, 254ms) but not unexpected because transient bSSFP signal is acquired while disturbing the T2-prepared magnetization.
Introduction
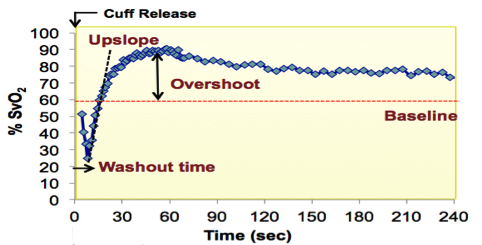
One approach to measuring blood $$$HbO_2$$$ level in vivo is via MR quantification of whole-blood T2, which is governed by deoxyhemoglobin fraction $$$(1-HbO_2)$$$ in erythrocytes [1]. T2-prepared bSSFP acquisition (T2-bSSFP), previously developed for myocardial edema T2 quantification [2], is an appealing approach for T2-based MR oximetry due to high speed and SNR efficiency. In [1] the k-space center is acquired immediately after T2-preparation via center-out spiral readout. In the T2-bSSFP approach, the T2-prepared magnetization experiences many RF pulses during single-shot half-Fourier bSSFP readout and the k-space center is captured much later. Consequently, the calibration curve for converting T2 to HbO2 based on the T2-prepared bSSFP pulse-sequence is expected to deviate substantially from that derived in [1]. The purpose of this work is to derive the calibration curve for T2-bSSFP, i.e. to estimate K and T2o, based on the Luz-Meiboom model for chemical exchange. We investigate the feasibility of modulating superficial femoral vein (SFV) HbO2 via intermittent cuff occlusions in order to perform the calibration in vivo. Fig 1 shows the range of venous oxygenation levels (%SvO2) that can be observed in SFV via cuff-induced ischemia [3].Methods
SFV of two healthy males (40 and 25 yrs old) were imaged at 1.5T (Siemens Avanto) with a single channel Siemens circularly polarized extremity coil. In the older subject the blood T2 in the superior sagittal sinus was also quantified with T2-prepared bSSFP (see below) using 12-channel Siemens head coil.
Cuff paradigm
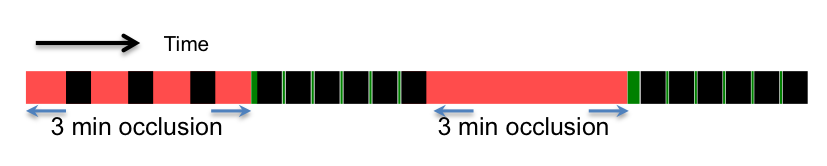
The cuff paradigm is summarized in Fig 2. Femoral arterial occlusion was achieved by application of super-systolic pressure (200mmHg) in a cuff secured around the thigh (Hokanson, Inc; Bellevue, WA). During the intermittent cuff occlusions the timing of the protocol was set up so as to delay launching of the pulse sequence by two sec following cuff inflation to ensure suspension of blood flow.
%HbO2 quantification with MR susceptometry
In MR susceptometry [4] HbO2 is quantified by making use of the paramagnetism of venous blood, which scales with the fraction of deoxyhemoglobin, $$$(1-HbO_2)$$$ , which in turn determines the relative magnetic susceptibility, $$$\Delta\chi$$$, of deoxygenated blood. $$$\Delta\chi$$$ is obtained from the measured field shift, $$$\Delta B$$$, relative to the surrounding diamagnetic tissue (typically muscle, which serves as a self-calibrating reference). The field map is obtained from the phase difference image, $$$\Delta\phi$$$, computed from two gradient echoes separated by $$$\Delta TE$$$, $$$\Delta\phi=\gamma\Delta B\Delta TE$$$, where $$$\gamma$$$ gyromagnetic ratio of water protons. Once hematocrit Hct is known $$$HbO_2$$$ can be computed as $$$HbO_2=[1-\frac{2\Delta\phi}{\gamma\Delta\chi_{do}\Delta TE\cdot Hct\cdot B_o(cos^2\theta-1/3)}]$$$, where $$$\Delta\chi_{do}=4\pi(0.27 ppm)$$$ is the magnetic susceptibility between fully deoxygenated and fully oxygenated blood in SI units and $$$\theta$$$ is the vessel tilt angle with respect to $$$B_o$$$. Imaging parameters of RF-spoiled multi-echo GRE: FOV 144mm, matrix size 144, slice thickness 5mm, TE/ΔTE/TR=5.7/8.88/38.5ms, FA=16o, partial Fourier factor 0.83 and acquisition time <5s.
T2 quantification
After RF-spoiled multi-echo GRE acquisition, the magnetization was reset to zero and allowed to recover for 2.5 sec prior to initiating T2-preparation, which consisted of 90o RECT excitation pulse, MLEV-4 type refocusing pulses with $$$\tau_{180}$$$=12ms, and composite tip-up (270x360-x). The duration of MLEV-4 was 48ms and comprises four composite refocusing pulses, each consisting of 90x180y90x RECT pulses separated by 150μsec. The amplitude of all RECT pulses was fixed and the duration was 500μsec/90o, e.g. duration of 180y is 1000μsec . TEs=0, 48, 96, 144 and 192ms correspond to 0, 1, 2, 3 and 4 MLEV-4 refocusing pulses, respectively. Imaging parameters of bSSFP: FOV 144mm, slice thickness 8mm, TE/TR=2/4ms, flip angle 60o, in-plane resolution 0.8mm, half-Fourier with linear ramp-up signal stabilization and 14 reference lines for reconstruction phase correction, i.e. k-space center is collected on 25th pulse cycle; acquisition time ~15s. T2 was quantified by fitting the average pixel intensities S of ROI from each of the five images to the three-parameter equation [5], i.e. S=Ae-Bt+C, and corrected TEs (0, 43.9, 87.7, 131.6, 175ms) were used in the fitting to reduce error associated with T1 decay between RECT pulses [6].
Results
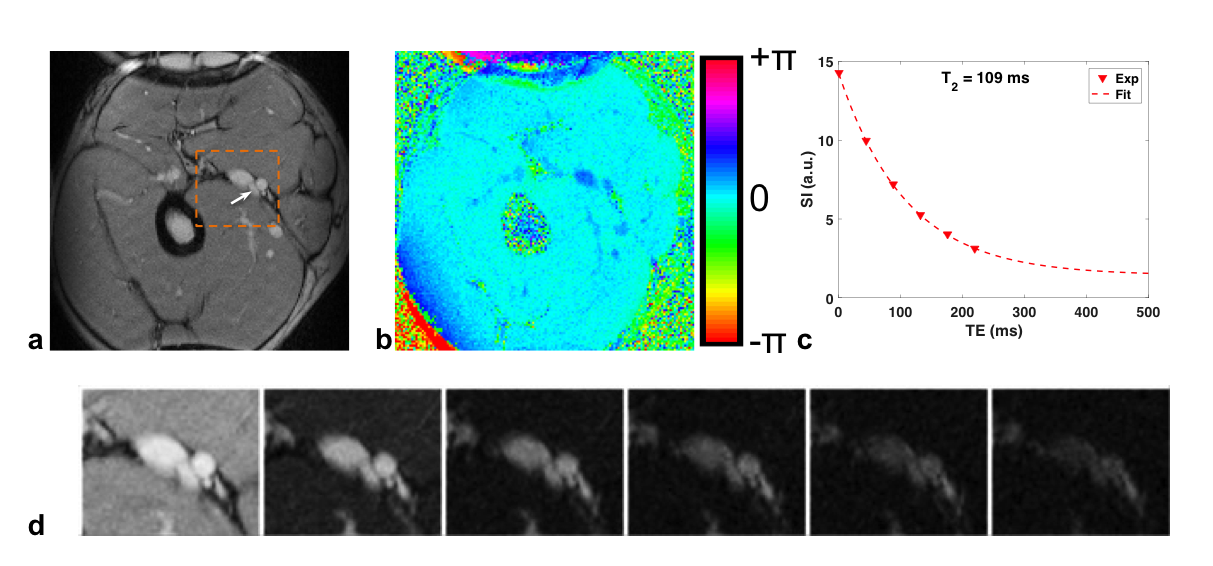
Sample images of T2-prepared bSSFP and phase difference are shown in Fig 3. The two subjects’ Hct were very close (0.44 and 0.45) so the data points were combined for the fit to estimate K and T2o (Fig 4). In the 40 yr old subject the blood T2 in the superior sagittal sinus was 132ms, which translates to 67%HbO2 based on the fit of Fig 4, in good agreement with values found in the literature (e.g. Lu et al[7] and Jain et al[8]).Conclusions
In this work we demonstrated the feasibility of in vivo calibration for converting whole-blood T2 to HbO2.Acknowledgements
NIH Grants K25 HL111422, U01 HD087180 and RO1 HL109545.References
[1] Wright et al, JMRI 1991, [2] Giri et al, JCMR 2009, [3] Langham et al, JACC 2010, [4] Fernández-Seara et al, MRM 2006, [5] Akaya et al MRM 2015, [6] Foltz et al, MRM 1997, [7] Lu et al, MRM 2008, [8] Jain et al, MRM 2010.Figures