1001
Detecting regional changes in brain tissue quantitative T1 values due to hydration status1Centre for Addiction and Mental Health (CAMH), Toronto, ON, Canada, 2Psychiatry, University of Toronto, Toronto, ON, Canada
Synopsis
Volumetric/morphometric changes in brain structures are often investigated as markers for disease or drug-induced effects. Brain tissue has been shown to shrink during mild dehydration which is not typically controlled for in MRI studies thus potentially confounding the results. Quantitative T1 is expected to change in response to changes in water content of tissue. Here, we show for the first time, that T1 maps, generated as we suggest, can capture regional water shifts that result from changes in hydration status. These can be used to control for water shifts in volumetric/morphometric studies and may aid in the interpretation of results.
Introduction
Many studies use volumetric/morphometric changes in brain structures as markers for disease or drug-induced effects. However, the brain tissue has been shown to shrink under mild dehydration thus implicating hydration status as a potential confound in volumetric studies1,2,3,4,5. Relaxation parameters (T2 and T1) depend on the amount of free water in tissue and thus may be used to distinguish true brain atrophy/growth from changes caused by water content. To the best of our knowledge, only one study has shown that whole brain pseudo-T2 values correlate with volumetric changes associated with hydration status5. However, attempts to show this for T1 have been unsuccessful6,7. This may reflect limitations of the T1-mapping technique7 and/or the dehydration/rehydration protocol6. The goal of this work is to determine if our reproducible T1 mapping method based on the eMoS8,9 (that minimizes improper RF spoiling artifacts and B1 effects) is sensitive enough to detect brain tissue water content changes associated with hydration state. Furthermore, we aim to characterize regional changes in T1 values and determine how well they reflect the observed tissue volume changes. To better interpret our results, independent measures of the apparent diffusion coefficient (ADC) and cerebral blood flow (CBF) are performed to assess changes in tissue and/or intravascular water content, respectively.Methods
Scans: Six consenting healthy volunteers (1 male, 36 ±13 years) were scanned with a 3T scanner (MR750, GE Healthcare) according to the REB of the Institution. Five subjects, hydrP , underwent the dehydration-rehydration protocol of ref.5 (pre=dehyrated, post=rehydrated) while one subject, HC, underwent the same scanning protocol without changes in hydration (pre=post). Urine samples and weight were used to assess hydration state. The following sagittal 3D spoiled-gradient-echo (SPGR) based sequences were used: high resolution (1mm)3 T1-weighted IR-Prep (BRAVO), two low resolution (4mm)3 scans, TR=50ms, α=(130º,150º) for B1 and two high resolution scans, TR=10.7ms, α=(3º,14º) for T1 maps8,9. Stock DTI (12 directions b=1000+ 2 b=0) and ASL (3D pCASL) sequences were used for ADC and CBF measurements, respectively.
Image processing: FSL (FMRIB Analysis Group, Oxford University, UK) was used along with in-house code written in Matlab (The MathWorks Inc., Natick, MA). Pre and post BRAVOs were entered into the SIENA10 routine to determine the two-timepoint percentage brain volume change (PBVC). Standard FSL routines (FLIRT/FNIRT) were used for coregistrations and standard atlases available in FSL were used for GM (HO) and WM (JHU) matter ROI extraction.
Results
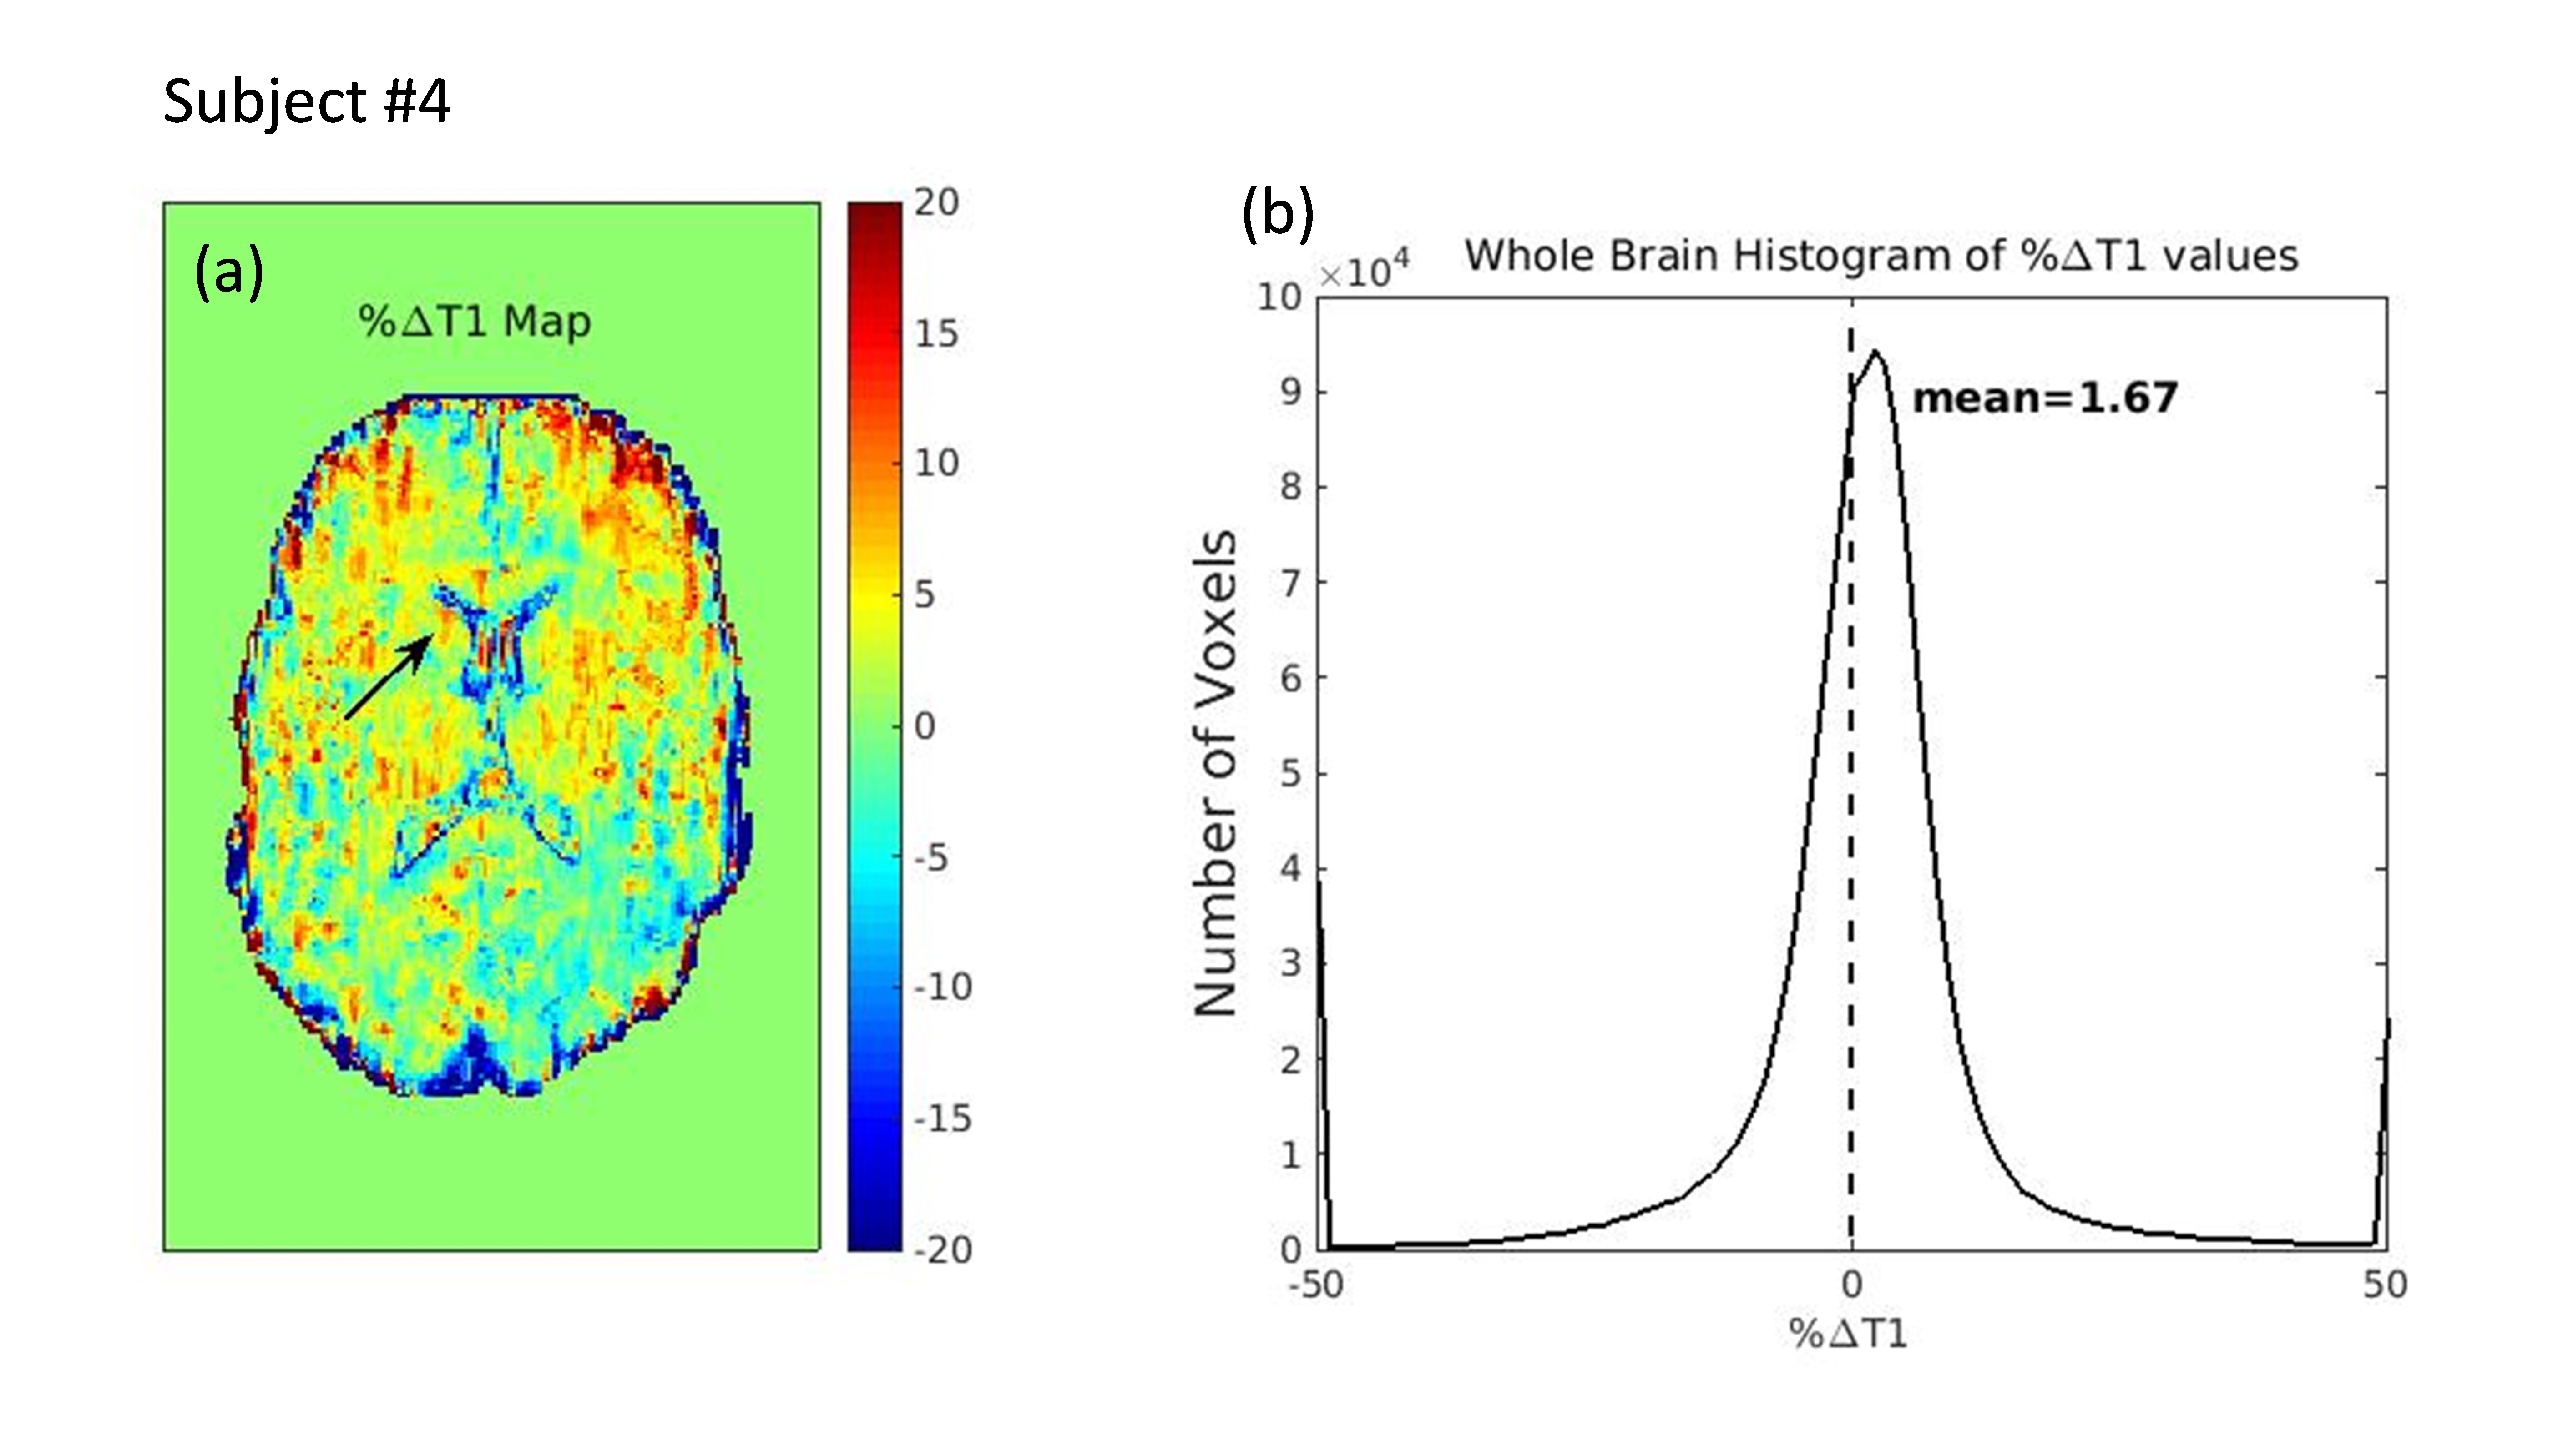
Whole brain: maps showing %ΔT1 values (post-pre) were computed for all subjects (Fig.1a). Although the %ΔT1 maps were noisy, hydration-related changes were present throughout the brain but particularly in the subcortical GM for the hydrP subjects: in all cases, the average %ΔT1 value was positive, indicating and overall increase in T1 after rehydration (Fig.1b). This was not the case for the HC. Also, SIENA results indicated an order of magnitude larger PBVC for the hydrP subjects than for the HC. A correlation between %ΔT1 and PBVC across all subjects was determined (r=0.83, p=0.039). Similar processing was used on the ADC & CBF maps and only %ΔADC, not %ΔCBF, was also found to correlate with PBVC (r=-0.84,p=0.036).
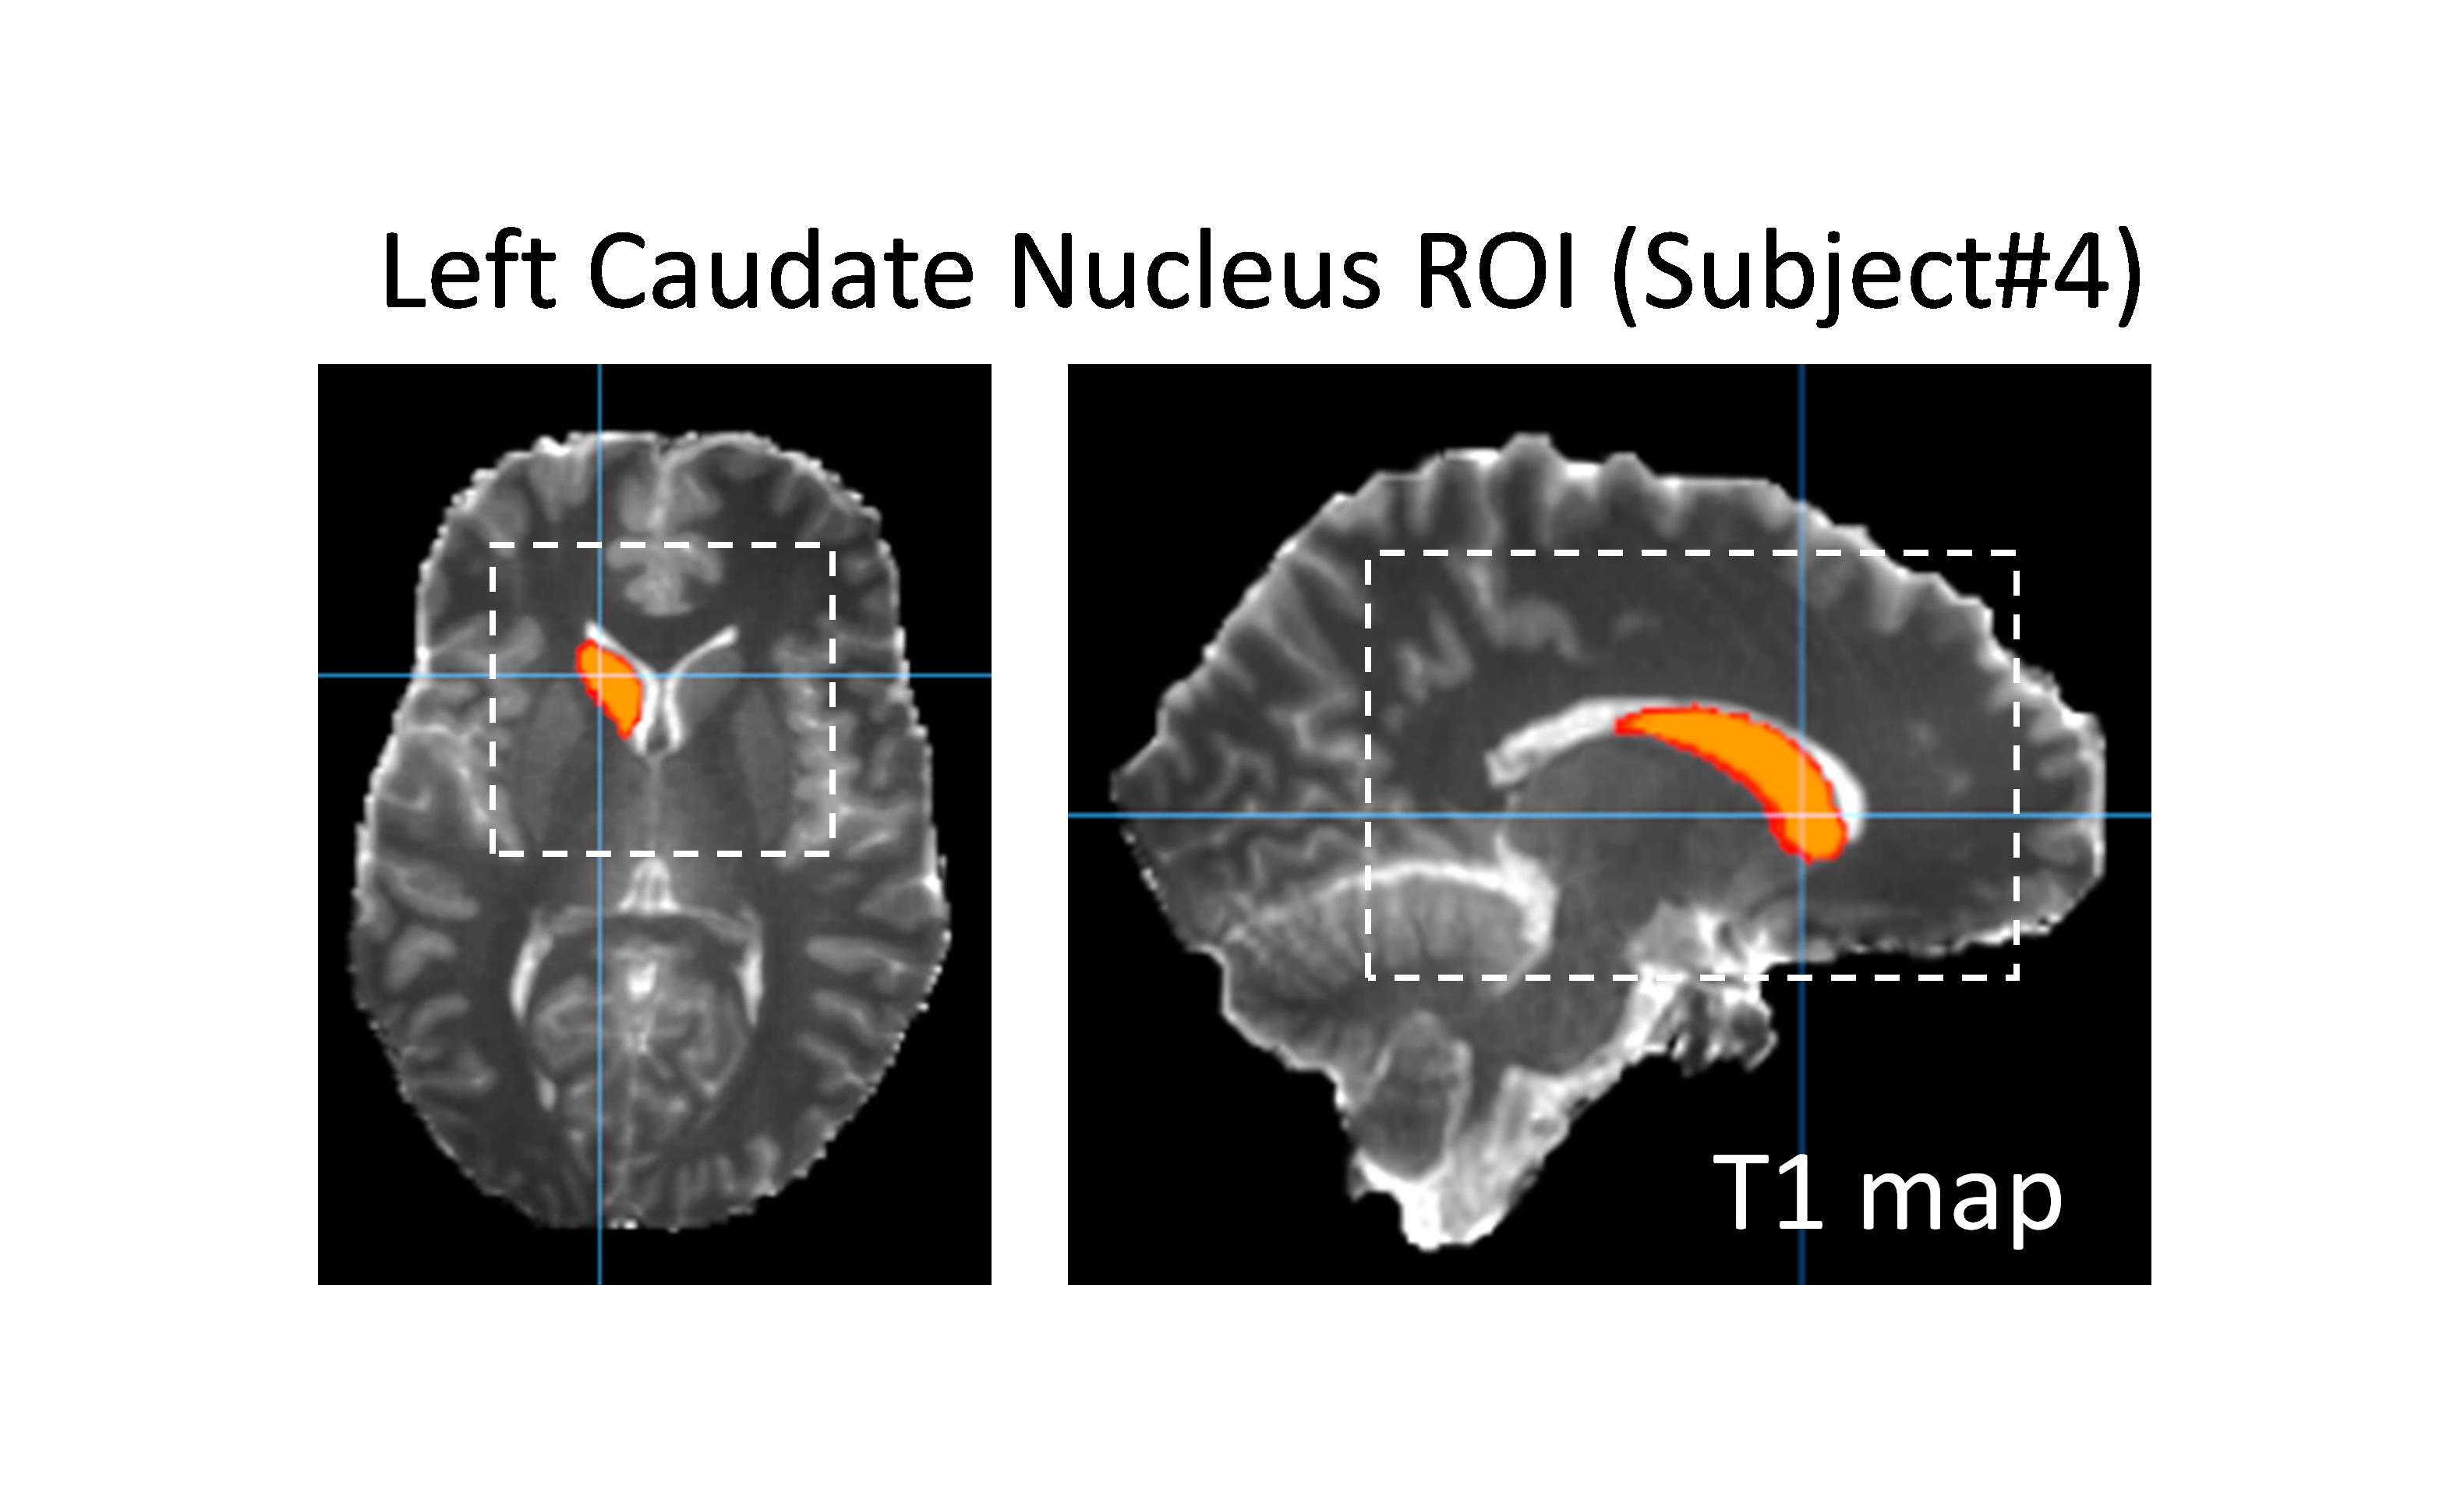
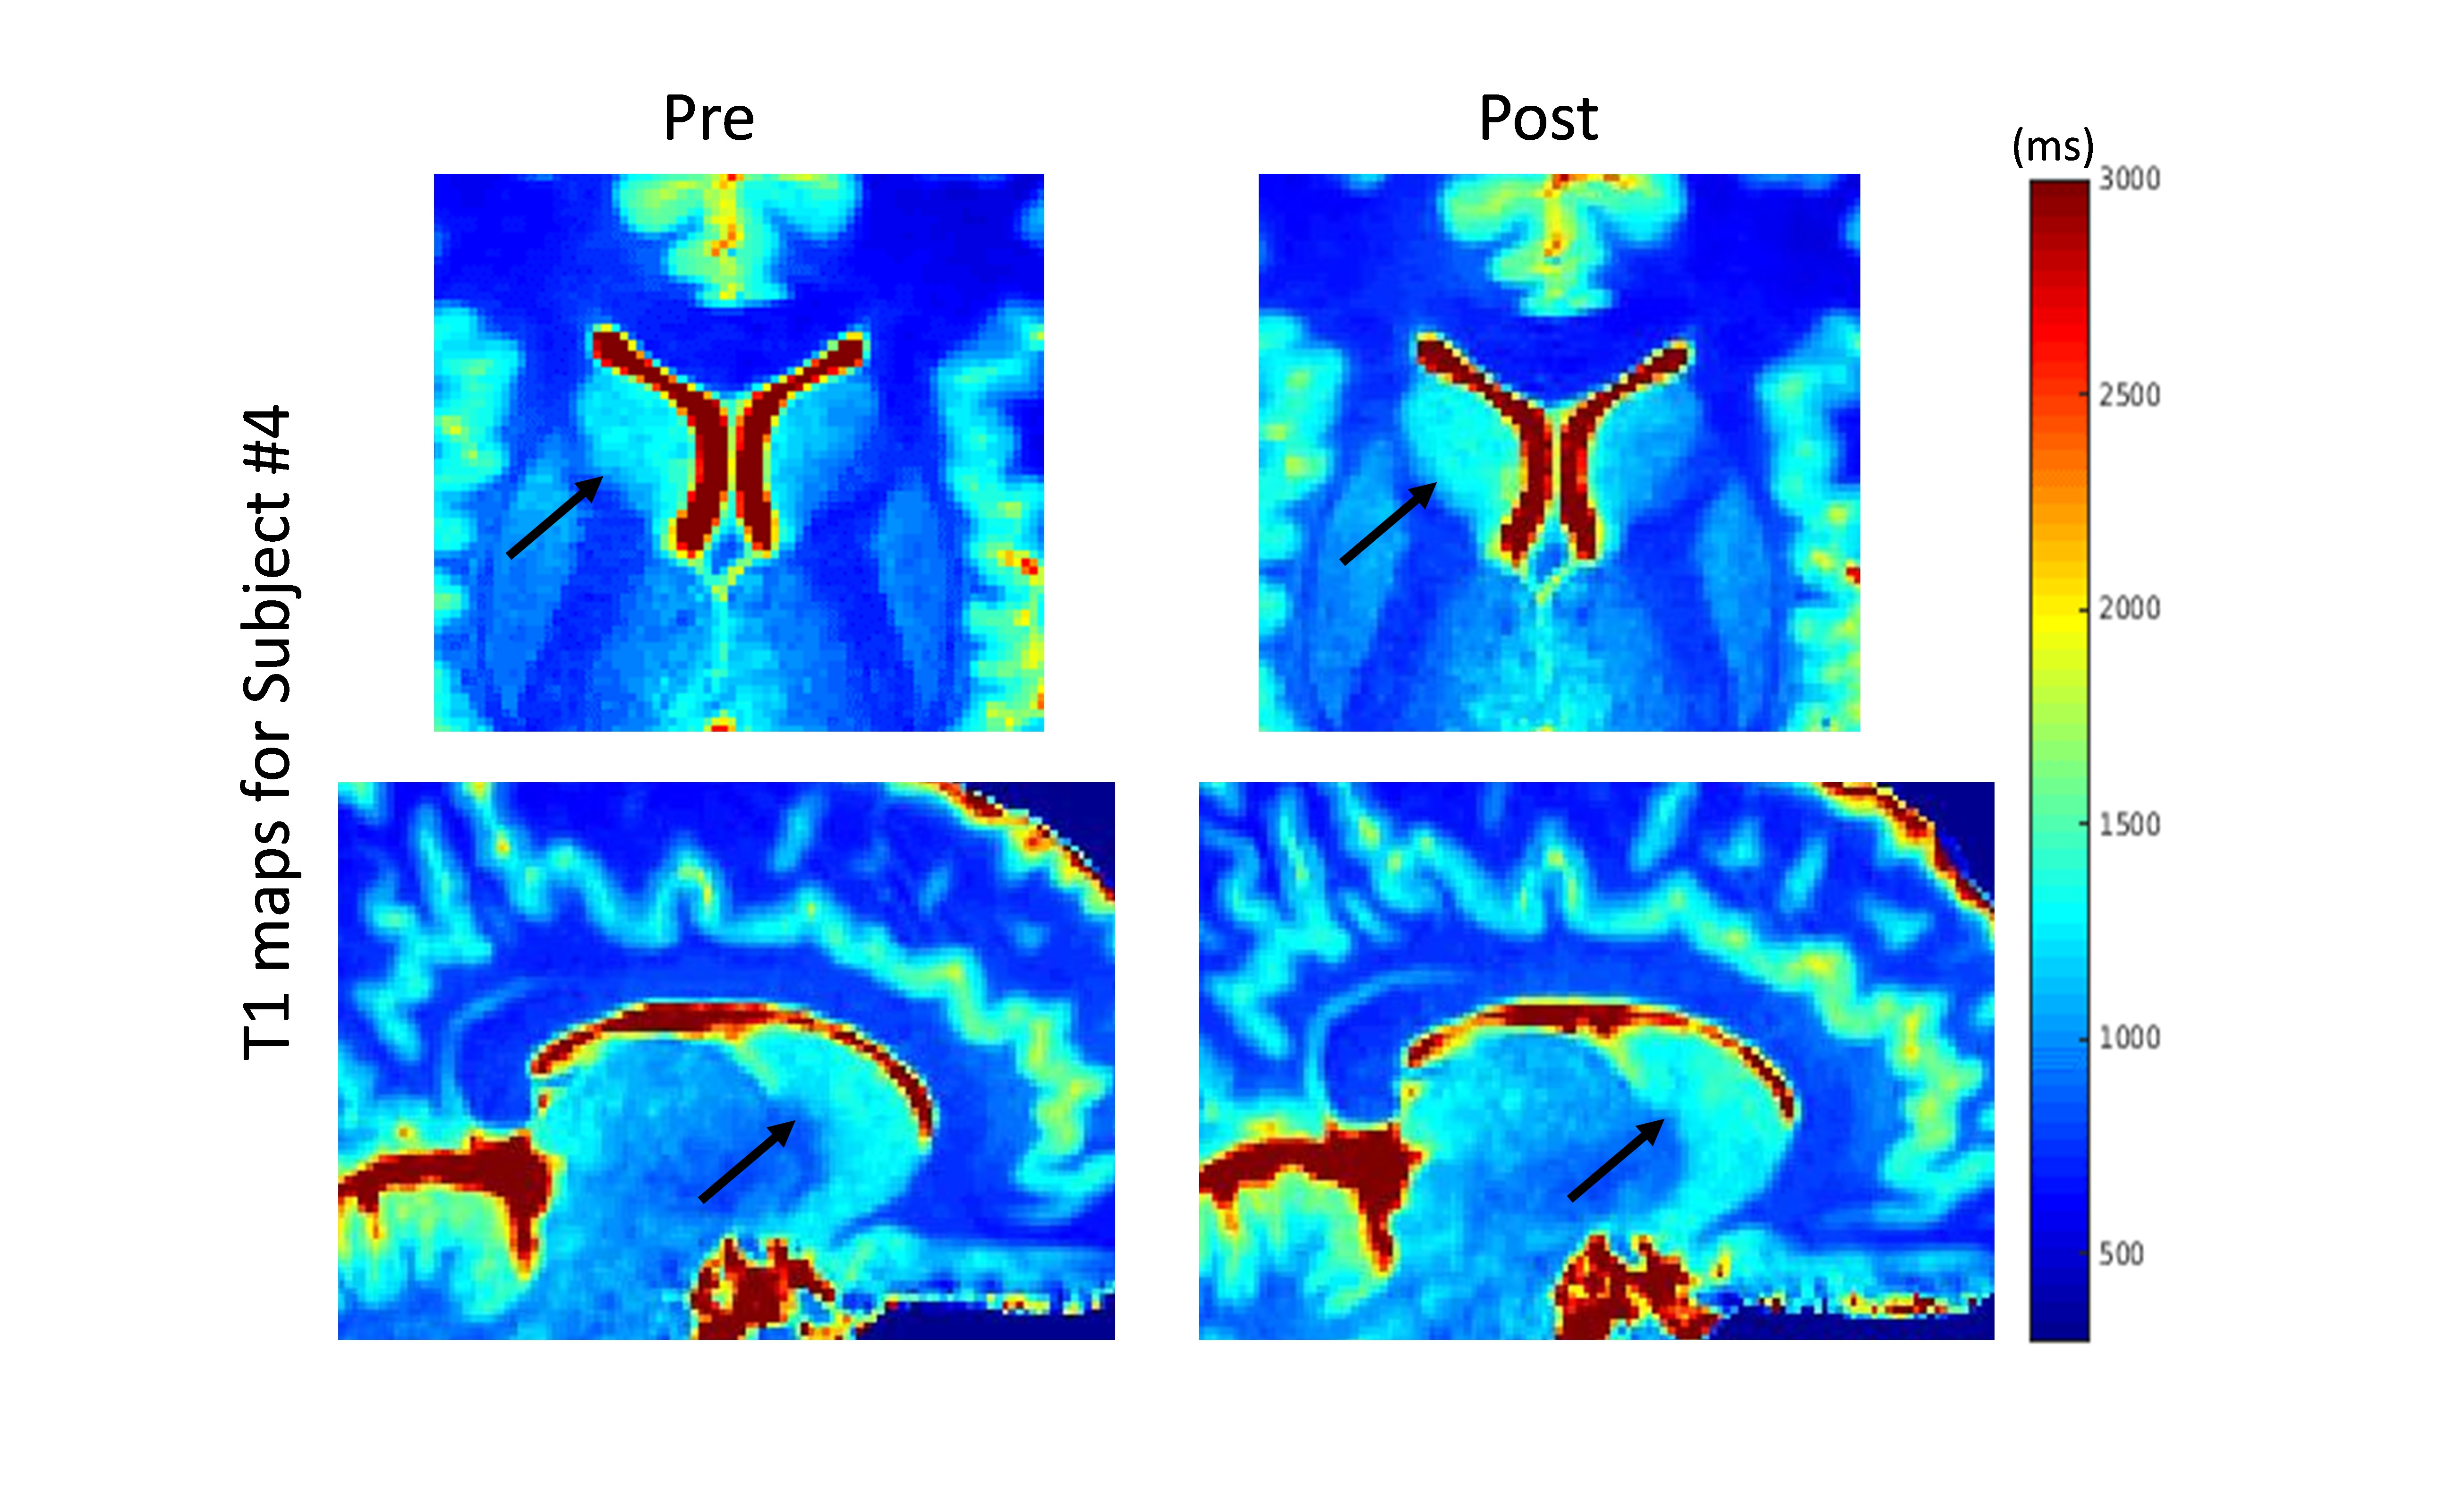
ROI: a template was mapped onto each individual T1 map and subject- and time-specific ROIs were determined (Fig.2). The size of the ROI and average T1 value was compared from pre to post. Several subcortical GM (thalamus, putamen, caudate nucleus) and two WM (splenium and genu of CC) regions were investigated. Ventricular enlargement and some regional decreases in T1 were apparent in the dehydrated state relative to the hydrated state of most subjects (Fig.3). Several regions show the expected trend between PBVC and %ΔT1 but only the left caudate nucleus revealed a strong correlation (r=0,96,p=0091). This region is consistent with a previous study2 that found significant volumetric changes in the left caudate across hydration states.
Discussion
Whole brain changes in T1 and ADC were correlated with PBVC, these measures thus appear to capture the hydration-related volume changes. Perfusion does not appear to confound the results. The correlations indicate that the T1 maps can not only capture whole brain changes but also localized tissue changes. These results also suggest that T1 measurements may be more sensitive to tissue water content changes than volumetry. Presently, more subjects (hydrP & HC) are being recruited and the ROI analysis of ADC and T1 is being extended.Conclusion
The T1 maps generated in this study are sensitive enough to capture water content shifts induced by varying hydration states. These maps may prove useful in disentangling the effects of reversible volumetric changes due to hydration state from true brain atrophy/growth, regionally.Acknowledgements
The authors would like to thank Sophie Lafaille for her help with image processing.References
1. Dunning T, Kloska S, et al. Dehydration confounds the assessment of brain atrophy. Neurology 2005;64:548.
2. Streitburger D-P, Moller HE, et al. Investigating structural brain changes of dehydration using voxel-based morphometry. PLoS One 212;7:e44195.
3. Kempton MJ, Ettinger U, et al. Effects of acute dehydration on brain morphology in healthy humans. Hum Brain Mapp 2009;30:291-298.
4. Dickson JM, Weavers HM, et al. The effects of dehydration on brain volume—preliminary results. Int J Sports Med 2005;26:481-485.
5. Nakamura K, Brown RA, et al. Correlation between brain volume change and T2 relaxation time induced by dehydration and rehydration: implications for monitoring atrophy in clinical studies. NeuroImage Clin 2014;6:166-170.
6. Meyers S, Tam R, et al. Does hydration status affect MRI measures of brain volume or water content? JMRI 2016;44:296-304.
7. Biller A, Reuter M, et al. Responses of the human brain to mild dehydration and rehydration explored in vivo by 1H-MR imaging and spectroscopy. Amer J Neuroradiol 2015; 36(12):2277-84.
8. Chavez S, Kish S, et al. Highly reproducible in vivo T1 maps in brain at 3T. Proceedings of the International Society of Magnetic Resonance in Medicine, 2013;2476.
9. Chavez S. A simple method (eMoS) for T1 mapping is more accurate and robust than the Variable Flip Angle (VFA) method. Proceedings of the International Society of Magnetic Resonance in Medicine, 2015;1673.
10. Smith SM, Zhang Y, et al. Accurate, robust and automated longitudinal and cross-sectional brain change analysis. NeuroImage, 17(1):479-489, 2002.
Figures