1000
The T1-Dispersion Curve as a Biomarker of Colorectal Cancer1Aberdeen Biomedical Imaging Centre, School of Medicine, Medical Sciences & Nutrition, University of Aberdeen, AB25 2ZD, Scotland, United Kingdom, 2Department of Pathology, University of Aberdeen, AB25 2ZD, Scotland, United Kingdom
Synopsis
A graph of T1 versus applied magnetic field, obtained via Fast Field-Cycling (FFC) NMR relaxometry, can be used as a diagnostic tool thanks to the information it provides about molecular dynamics. In this work, FFC NMR relaxometry, extended to magnetic fields below 17 μT, was used to investigate new biomarkers of colorectal cancer. The acquired results indicated that there were significant differences in the molecular motions with correlation times 0.1-10 ms and 0.5–1.4 μs between the healthy and cancer tissues examined, showing great potential for diagnosis, staging and monitoring response to treatment.
Purpose
T1-dispersion curves, acquired with Fast Field-Cycling (FFC) NMR relaxometry, plot T1 relaxation time versus the applied magnetic field strength. They are used for the investigation of the molecular dynamics of complex systems, with applications in biomedicine1. The purpose of the study was to acquire T1-dispersion curves that extend to magnetic fields below 17 μT for the study of the slowest molecular dynamics, and then to investigate their use as new biomarkers of colorectal cancer.Materials and Methods
Colorectal tissue samples were provided by the Grampian Biorepository with the informed consent of the patients. 19 fresh, non-frozen samples were used in total. These were obtained between October 2015 and September 2016 from four male and seven female patients, aged between 35-87 years, who had colorectal cancer (seven Dukes B cases and four Dukes C cases respectively). The samples comprised: matched pairs of healthy and diseased tissue samples from eight patients; one healthy and two diseased tissue samples from a further three patients.
The samples were measured using a commercial FFC NMR relaxometer (Stelar S.l.r., Italy), using samples of volume ca 1 mL at a controlled of temperature of 37 °C. A Field-Cycling Inversion-Recovery Carr-Purcell-Meiboom-Gill (IRCPMG) pulse sequence was used, with the evolution field varying between 10 MHz to 700 Hz proton Larmor frequency (PLF). To extend the FFC NMR techniques, and thus the acquired T1-dispersion curves, below 10 kHz PLF, a novel calibration method previously presented2 was applied.
The models applied to fit the acquired curves, presented as R1 (R1=1/T1) versus field, were a sum of power law functions applied to fit the background curves, and a sum of Lorentzian functions previously published3, applied to fit the quadrupole peaks consistently observed in biological samples between 0.4-0.9 MHz and 1.5-3.5 MHz PLF. The parameters presented in this study as biomarkers are the vertical shifts and slopes of the segments appearing in the ultra-low and low ranges of the applied magnetic fields, defined as 700 Hz-10 kHz and 0.7-1.8 MHz PLF respectively.
Results and Discussion
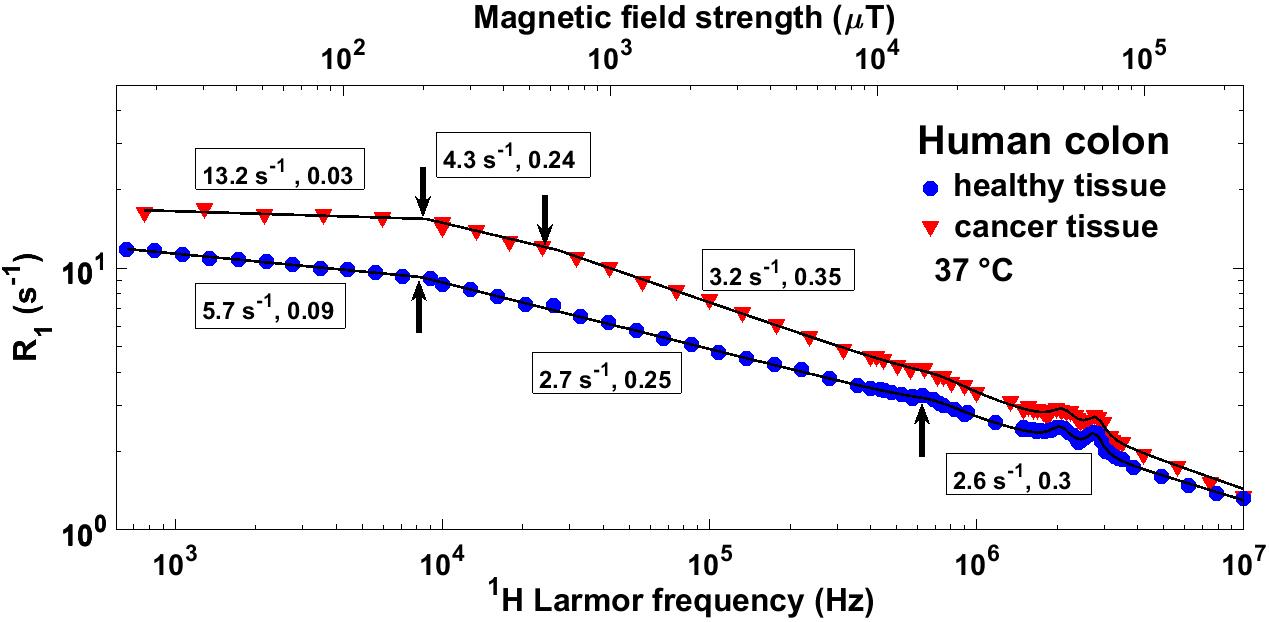
As seen in Figure 1, the R1-dispersion curves, acquired with the relaxometer calibrated, extended to magnetic fields as low as 700 Hz PLF (16.4 μT), significantly less than the earth’s field (ca 2 kHz). They showed three segments of power law distributions with different vertical shift, slope and length, as well as three quadrupole peaks of Lorentzian distribution. The segments below 10 kHz PLF, revealed after the calibration of the relaxometer, showed a different vertical shift and slope from the rest of the curves, indicating a slower motion (correlation times > 0.1 ms) in the examined tissues. Additionally, the diversion of T1 values, measured between the healthy and cancer tissue, is increased with the decrease of the applied field from 10 MHz to 10 kHz PLF, indicating an enhanced T1-contrast at low fields.
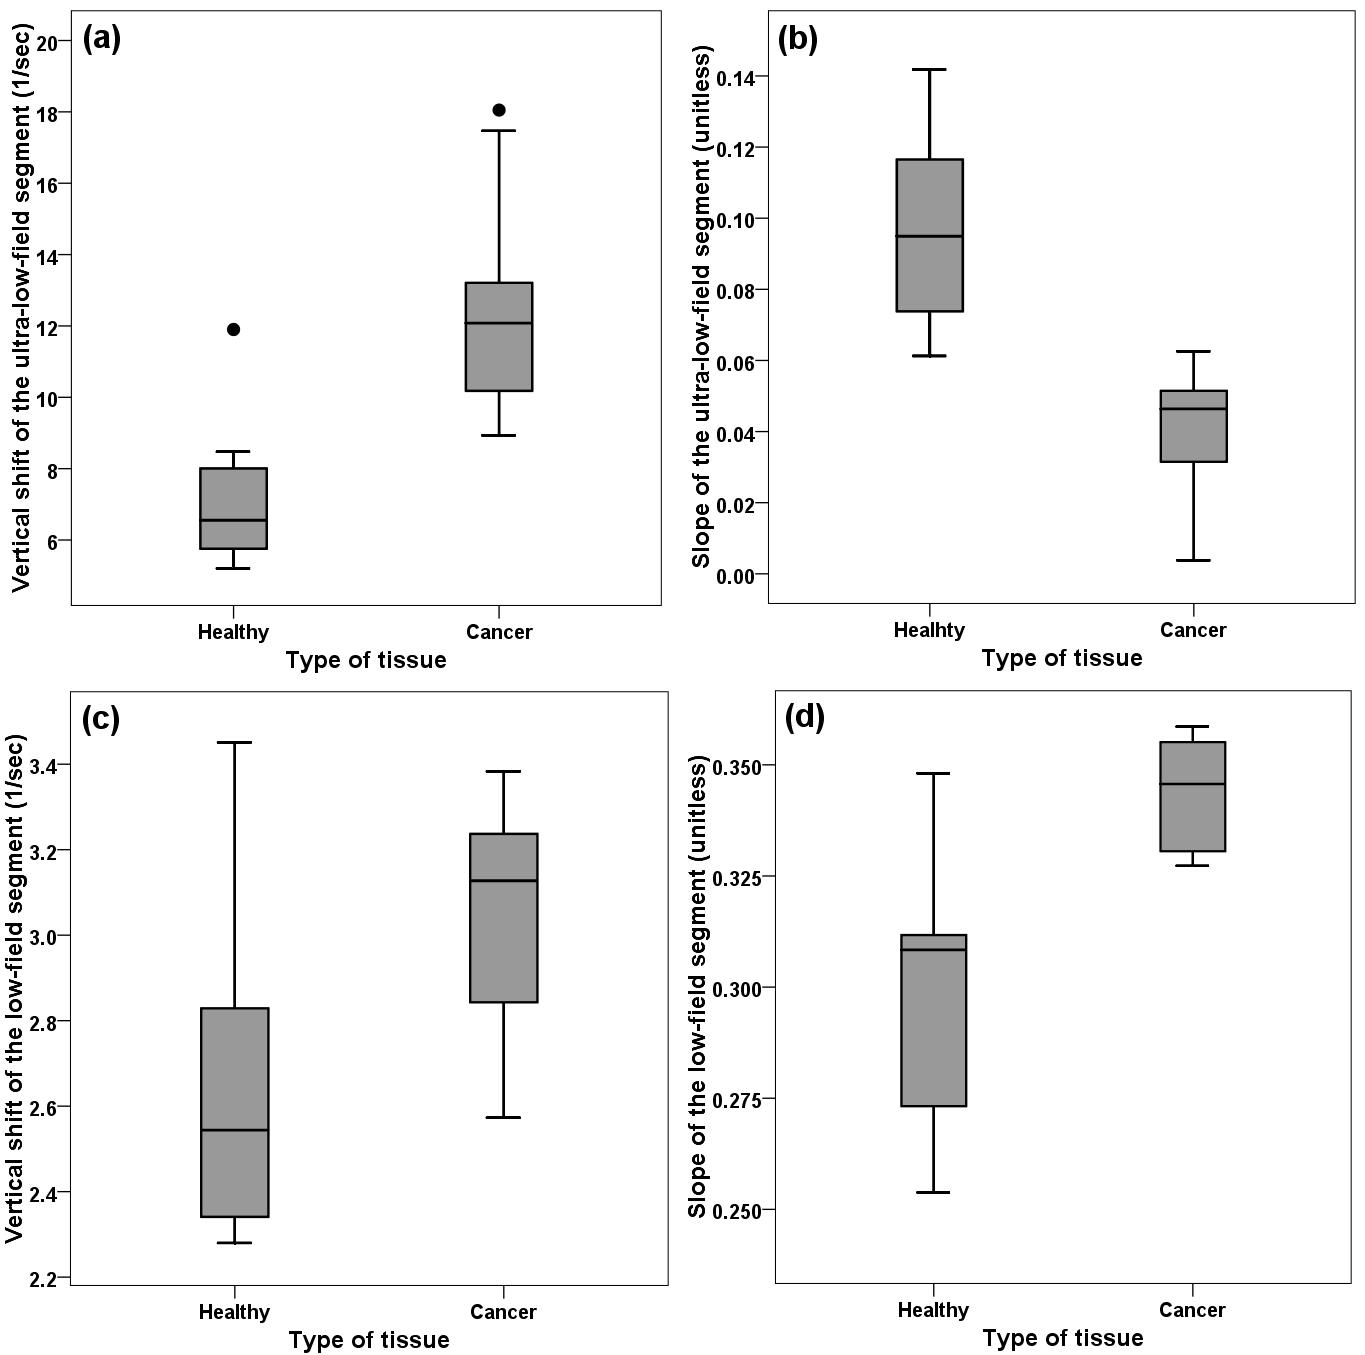
Figure 2 summarises the values of the vertical shifts and slopes of the ultra-low- and low-field-segments which were shown on the R1-dispersion curves of healthy and diseased tissues. In the case of the ultra-low-field segments (Figure 2a,b), the values of the healthy and cancer tissue did not overlap, apart from an outlier at approximately 12 sec-1 observed in healthy tissue in Figure 2a. In the case of the low-field segments (Figure 2c,d), the box plots indicated that about 50% and 85% of the measured vertical shifts and slopes of the healthy tissues were smaller than the ones arising from the cancer tissues.
Statistical tests performed on the results acquired from the paired tissues showed that there were significant differences between the healthy and diseased tissues for all four parameters studied (p-values of 0.012, 0.012, 0.025, and 0.012, for the parameters presented in Figure 2 (a), (b), (c), and (d) respectively).
These results indicate that there are significant differences in the motions with correlation times 0.1-10 ms and 0.5–1.4 μs, between the healthy and cancer tissues examined.
Conclusion
This work shows that T1-dispersion curves, extended to ultra-low magnetic fields, have potential as new biomarkers of colorectal cancer. The vertical shifts and slopes of their segments can also form the basis of new types of contrast in FFC MRI1, highlighting the different dynamic processes which take place between healthy and cancer tissues. Next steps will include the application of localised FFC NMR relaxometry to acquire T1-dispersion curves from selected regions of the human body in vivo, and the acquisition of T1-weighted images at various field strengths using our newly-constructed whole-body 0.2 tesla FFC MRI scanner.Acknowledgements
V.Z. acknowledges funding from the EPSRC through the Centre for Doctoral Training in Integrated Magnetic Resonance, and is grateful to Mr. Graeme I. Murray and Dr. W. Mathieson for providing access to the biological samples used.References
1. Lurie D, Aime S, Baroni S, Booth N, Broche L, Choi C, Davies G, Ismail S, Hogain D, Pine K. Fast field-cycling magnetic resonance imaging. Comptes Rendus Physique. 2010;11(2):136-48.
2. Zampetoulas V, Broche L, Lurie D. Fast field-cycling NMR relaxometry extended to the ultra-low field region: Calibration method and acquisition of T1-dispersion curves that reach 2.3 μT. 24th ISMRM Annual Meeting & Exhibition. 2016.
3. Fries P, Belorizky E. Simple expressions of the nuclear relaxation rate enhancement due to quadrupole nuclei in slowly tumbling molecules. J Chem Phys. 2015;143(4).
Figures