0998
Offset-Saturation-Induced (osi-) Variations in Multiexponential T2 at 16.4T: A New Dimension for Probing White Matter Contrast1Champalimaud Neuroscience Programme, Champalimaud Centre for the Unknown, Lisbon, Portugal
Synopsis
Whether Magnetization Transfer could affect Multiexponential T2 (MET2) Relaxometry remains poorly explored. Here, the effects of irradiation at different offset frequencies on the MET2 components were evaluated as novel contrast mechanisms for white matter in the rat spinal cord at 16.4T. MET2 coefficients were found to shift with off-resonance saturation, showing unique tract-specific signatures across the irradiation frequency. Offset-saturation-induced (osi-) MET2 Relaxometry maps show strong contrasts between microstructurally-distinct rat spinal cord tracts. The potential of exploiting the osi-MET2 shift phenomenon to increase white matter contrast is discussed.
Purpose
Out of the many contrasts available in MRI, Magnetization Transfer (MT) and Multiexponential T2 (MET2) Relaxometry have histologically correlated sensitivity to white matter (WM)1–3. Several studies comparing MET2 and MT were conducted4–6; however, whether magnetization transfer could actively affect MET2-derived relaxation rates has not been demonstrated insofar. This study investigates how spectrally-resolved off-resonance irradiation modulates MET2 components, and its potential to contrast different WM tracts of the rat spinal cord (SC) at 16.4T.Methods
All experiments were preapproved by the Institution’s animal ethics committee. Long Evans rats (n=3) were perfused and the cervical SC extracted. Experiments were conducted on a 16.4T Bruker Aeon scanner equipped with a 10mm micro5 probe and gradients capable of producing up to 3000 mT/m in all directions.
To investigate multiexponential relaxation, a Multi-Slice-Multi-Echo (MSME) sequence was employed with: TR=16000 ms; TE=1.2:1.2:96.0 ms; resolution=(63x63x800) µm3; NA=2; BW=200 kHz. The MSME was preceded by a MT module consisting of a 2 sec RF pulse, with peak power of 5 µT7, and a gradient crusher prior to the MSME acquisition. MT offset frequencies were varied between {-50,50 kHz} in 1 kHz increments. The 102 experiments took ~43.5h in total. One SC was excluded due to acquisition artefacts.
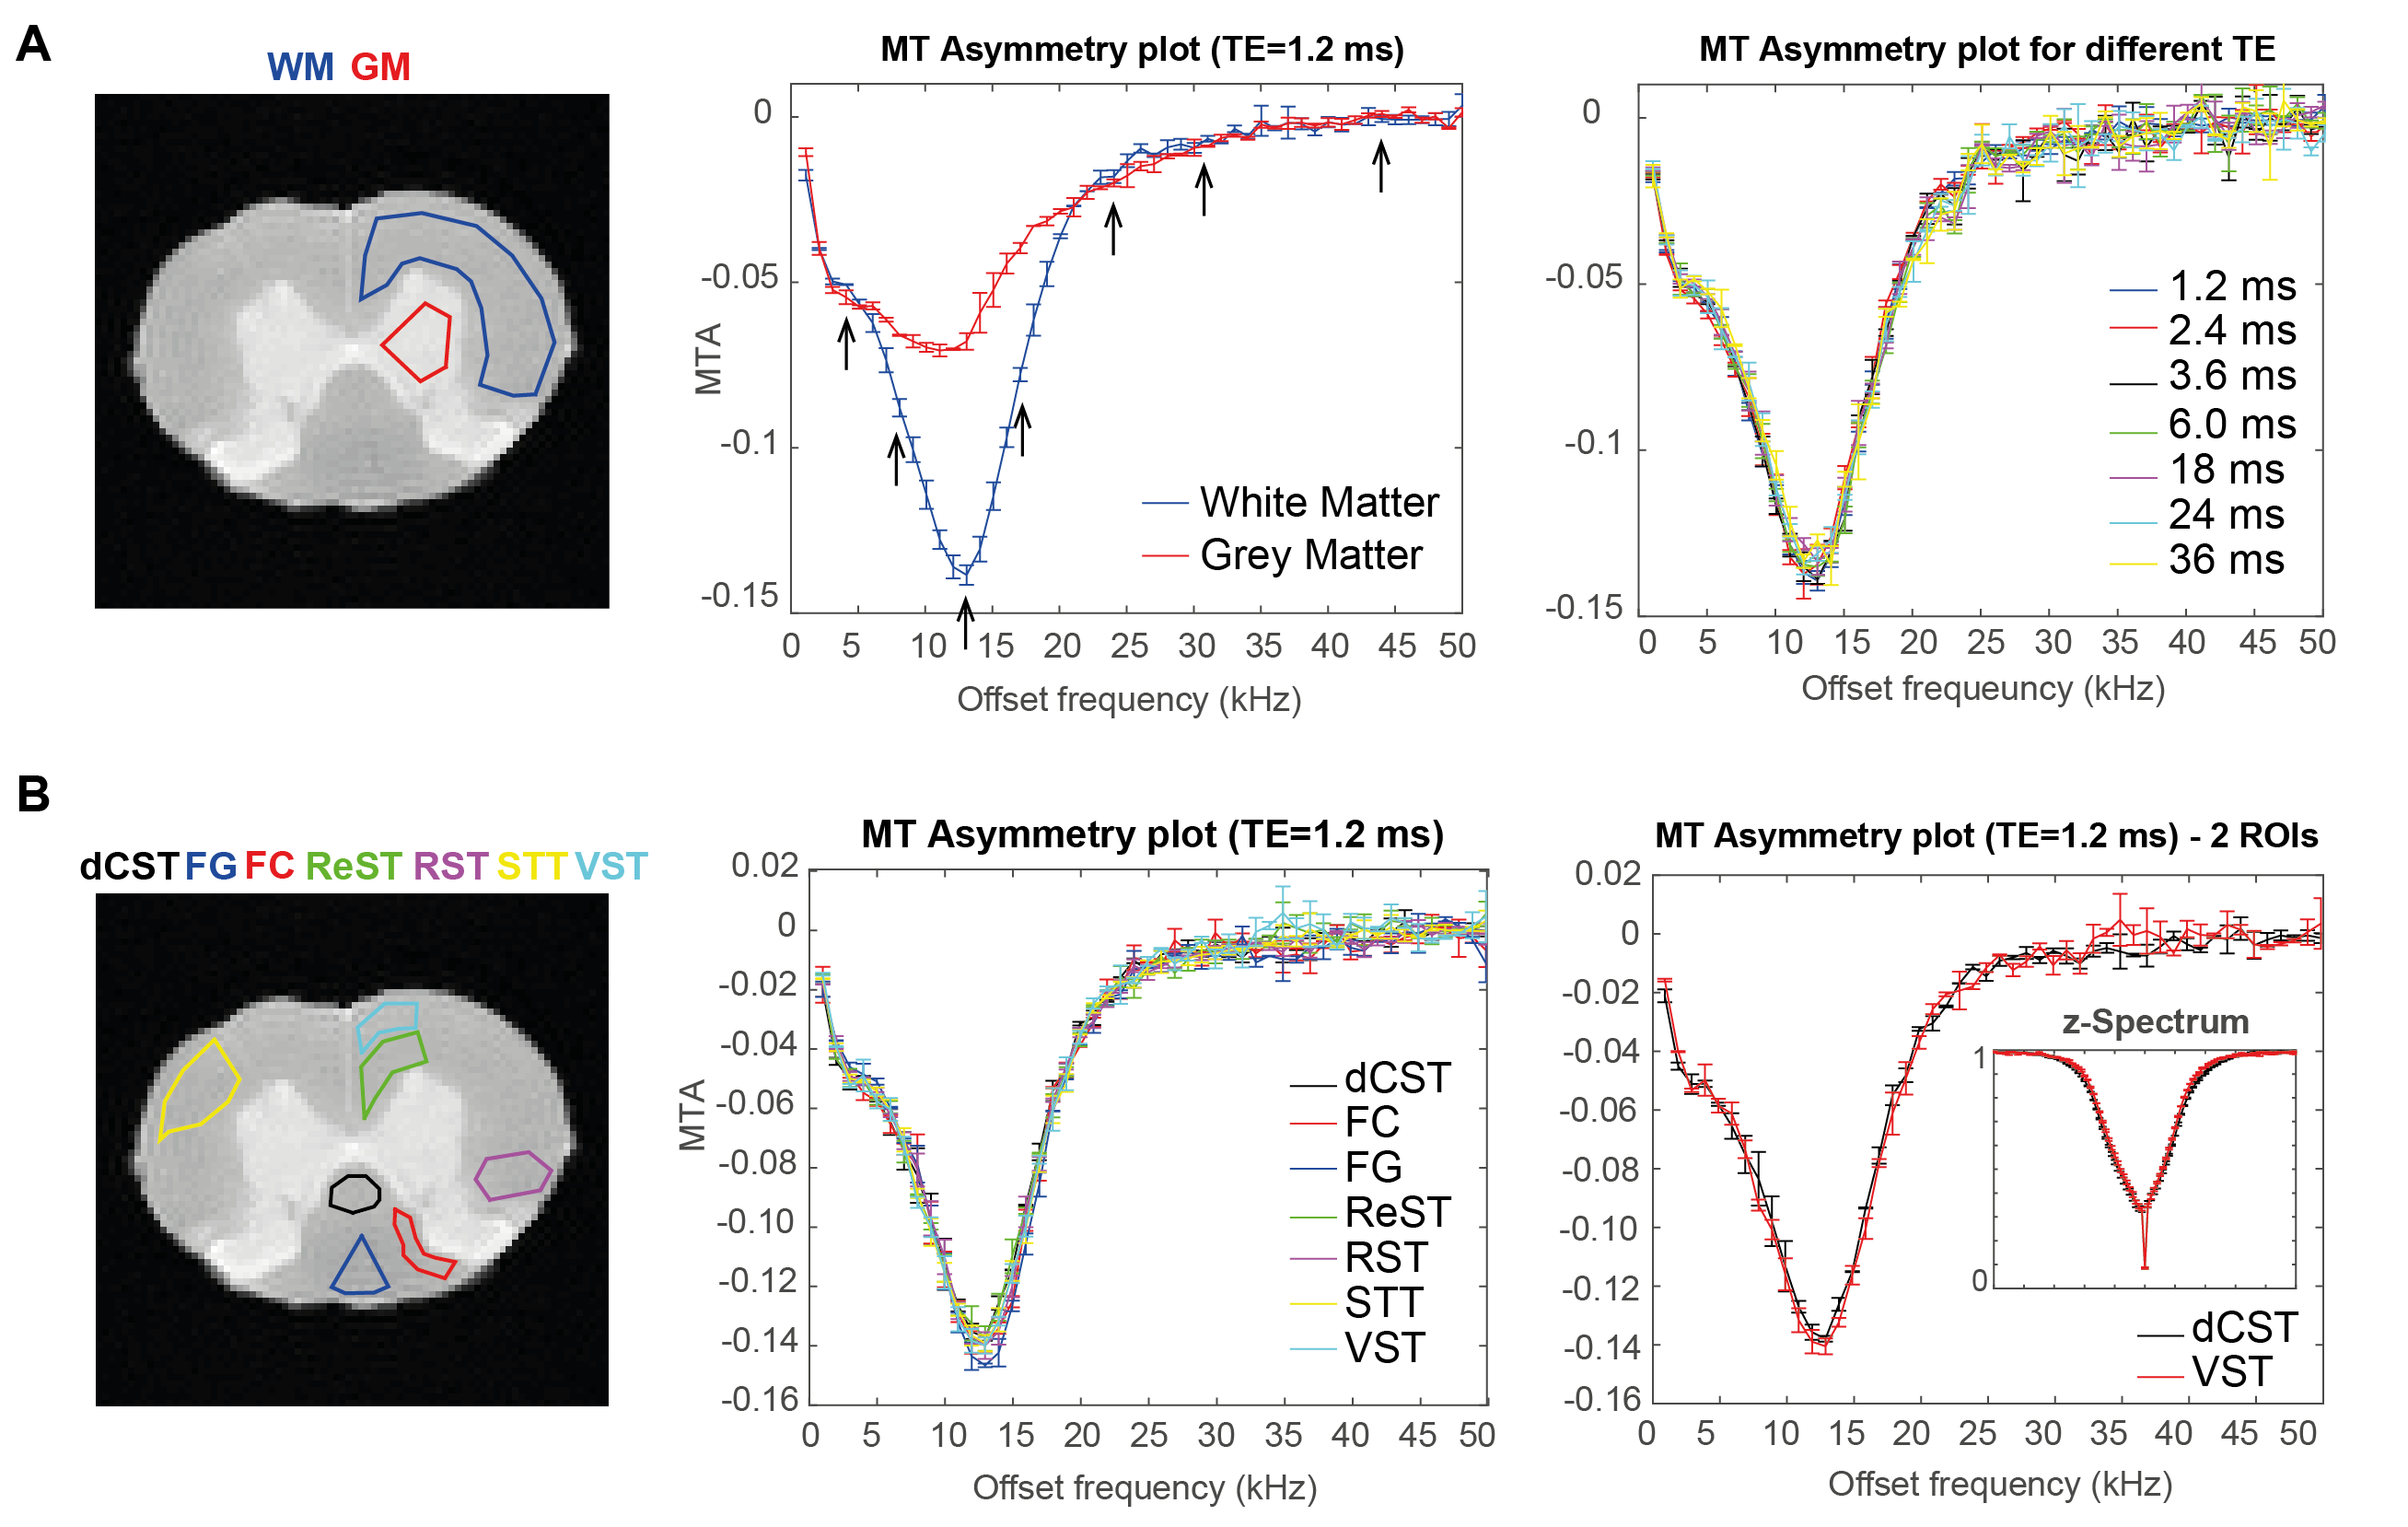
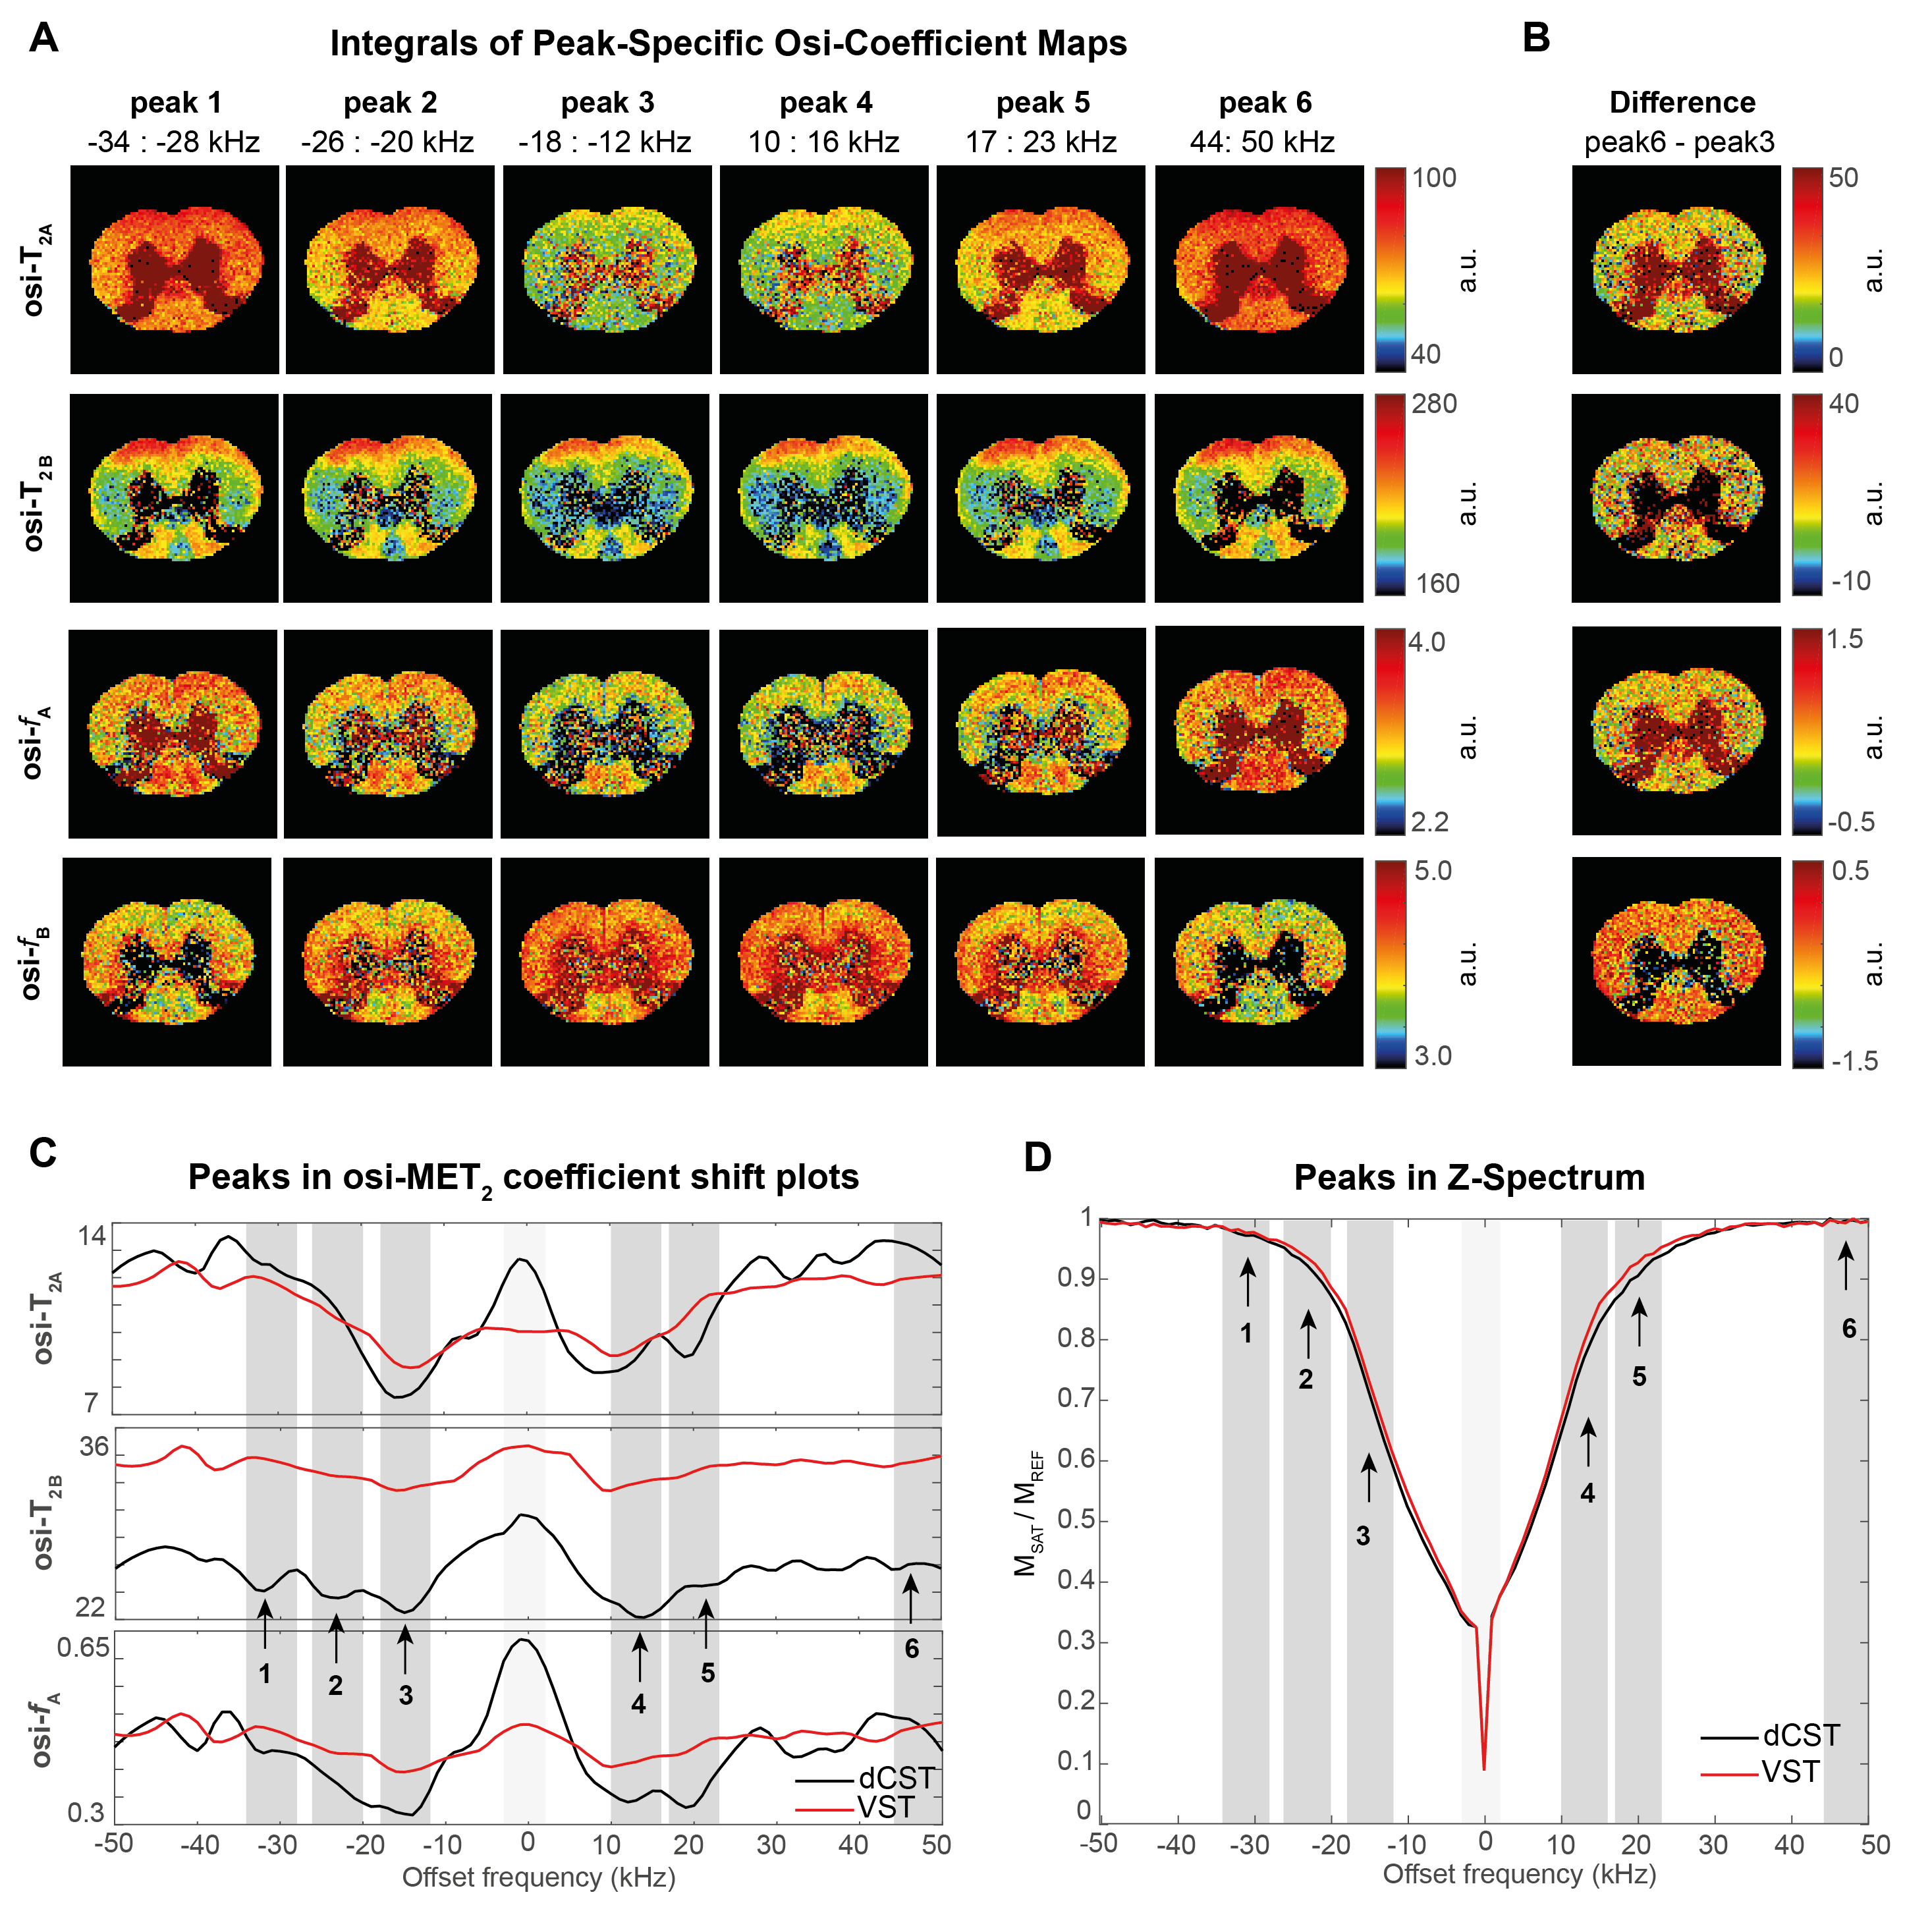
Nine ROIs including WM, grey matter (GM) and seven tracts in WM5 were drawn on the raw data (Figure 1). Z-Spectra and MT asymmetry (MTA) plots (AVG±SEM among SCs) normalized to the reference scan8 were calculated per ROI, for each echo. Subsequently, the signal decay at each frequency was individually fitted to a two-compartment model. T2A, fA and T2B maps were obtained by similar voxelwise fits. To investigate if MT irradiation induces changes in these coefficients, the extracted coefficients were plotted against the irradiation frequency. From these spectra, six peaks were selected, and their integral was taken per coefficient per voxel, resulting in parametric offset-saturation-induced-MET2 coefficient maps.
Results
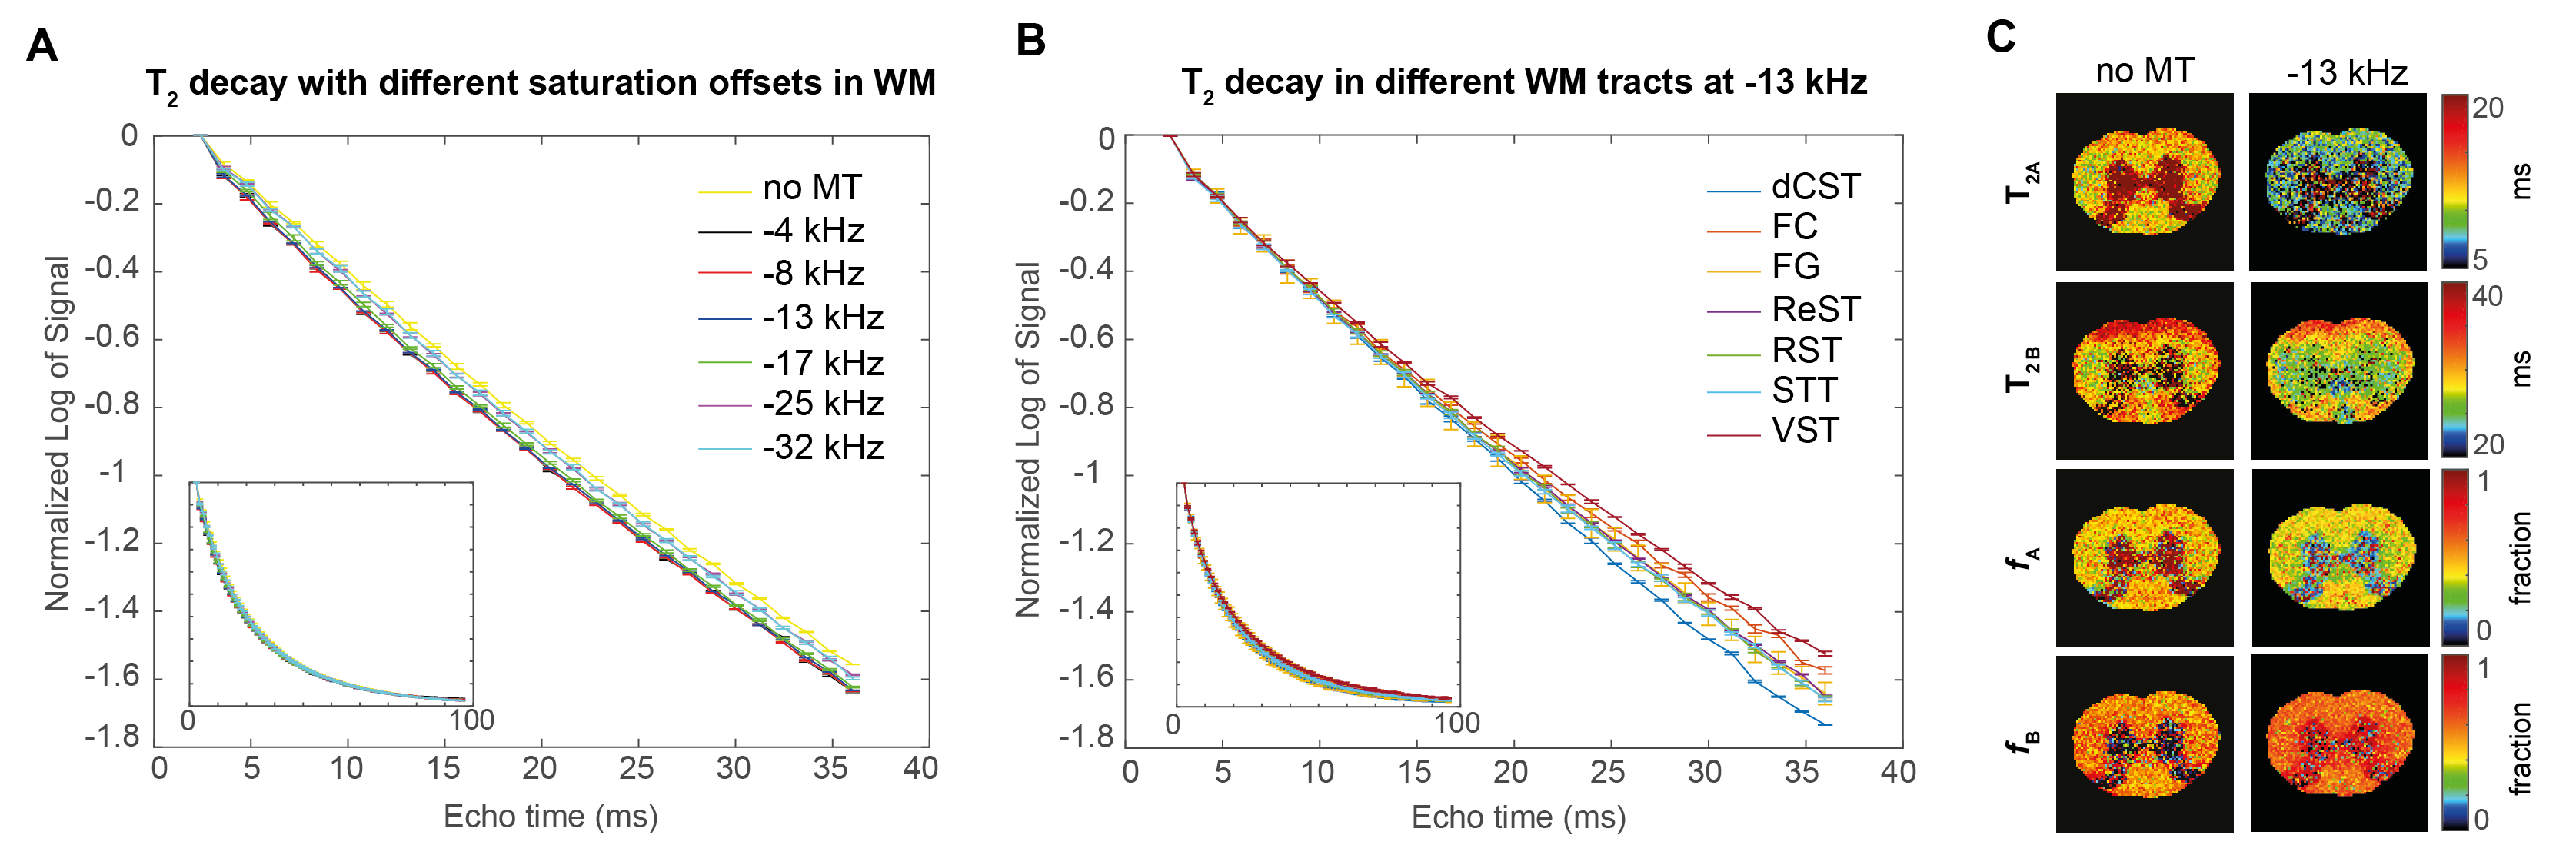
Figure 1 shows the MTA plots for different ROIs and TEs. While MT provides a substantial WM/GM contrast, only minor changes were found among the different tracts in WM. The nonexponential signal decay is illustrated in Figure 2 for different MT presaturation offsets. In the absence of the saturation pulse, the AVG±SEM of T2A, fA, and T2B in the entire WM was T2A=12.65±0.50 ms, fA=0.48±0.01, T2B=30.11±0.01 ms, respectively. Small, yet clearly visible changes in the WM signal decay were observed after irradiation. Similarly, different WM tracts appeared to differ in their decay profiles when analysed at specific frequencies (Figure 2).
Figure 3 plots the extracted coefficients against irradiation offset. A clear modulation in all parameters is observed, which we term “Offset-Saturation-Induced” (osi-) and prefix to the respective coefficient. Interestingly, osi-T2A, osi-T2B and osi-fA shifts were all found to carry a specific signature for each WM tract. To test whether they could be used to enhance contrast, we plot the integrals of peak-specific osi-coefficient maps in Figure 4A (n.b., peak 6 reflects a “reference” image with no MT-contrast). The irradiation effects are evident in all parametric maps, which show that the complex evolution patterns shown in Figure 3 are spatially distinct. Figures 4C and 4D show the osi parameters in the two microstructurally most distinct tracts, the dCST and VST, demonstrating large differences in osi-coefficient spectra.
Discussion
This study investigated the variation of MET2 parameters modulated by irradiation offset in rat WM at 16.4T. An osi-MET2 shift signature, undescribed so far (to the best of our knowledge) was indeed observed. MT thus adds another dimension which could be used to filter specific T2 components. It should be noted that the mechanism for these spectral signatures is complex: for example, if the MT module was simply erasing (through presaturation) a specific component’s magnetization, a change in the estimated T2s would not be expected – only changes in the extracted fractions. One potential mechanism for effective T2 variations is perturbation of the rotational correlation time spectrum, J(ω), which may be modulated by irradiation. Dipolar coupling and exchange effects would also need to be considered.
Interestingly, osi-coefficient signatures varied widely among SC tracts, which differ mainly in microstructure and much less so in myelin content9,10. Hence, osi-coefficient contrast may be sensitive to underlying microstructural features. Both histology and a careful theoretical treatment are required to elucidate the observed mechanism. Nevertheless, the present data, suggests that osi phenomena might be used fruitfully for characterization of WM.
Conclusion
MET2 coefficients were found to shift with off-resonance saturation, showing unique, spatially distinct, tract-specific signatures across the irradiation frequency. This phenomenon adds a new dimension for tissue characterization.Acknowledgements
This study was supported through funding from the European Research Council (ERC) under the European Union’s Horizon 2020 research and innovation programme (Starting Grant, agreement No. 679058). The authors would like to acknowledge Dr. Daniel Nunes for providing tissue.References
1. Mottershead, J. P. et al. High field MRI correlates of myelin content and axonal density in multiple sclerosis: A post-mortem study of the spinal cord. J Neurol 1293–1301 (2003).
2. Zaaraoui, W. et al. Monitoring demyination and remyelization transfer imaging in the mouse brain at 9.4 T. MAGMA 21, 357–362 (2008).
3. Laule, C. et al. Myelin water imaging in multiple sclerosis?: quantitative correlations with histopathology. Mult. Scler. (2016).
4. Harrison, R., Bronskill, M. J. & Henkelman, R. M. Magnetization Transfer and T2 Relaxation Components in Tissue. Magn Reson Med 490–496 (1995).
5. Dula, A. N., Gochberg, D. F., Valentine, H. L., Valentine, W. M. & Does, M. D. Multiexponential T2, Magnetization Transfer, and Quantitative Histology in White Matter Tracts of Rat Spinal Cord. Magn Reson Med 909, 902–909 (2010).
6. Mccreary, C. R. et al. Multiexponential T2 and magnetization transfer MRI of demyelination and remyelination in murine spinal cord. Neuroimage 45, 1173–1182 (2009).
7. Pohmann, R., Shajan, G. & Balla, D. Z. Contrast at High Field?: Relaxation Times, Magnetization Transfer and Phase in the Rat Brain at 16.4 T. Magn Reson Med 1581, 1572–1581 (2011).
8. Zhou, J., Payen, J., Wilson, D. A., Traystman, R. J. & Zijl, P. C. M. Van. Using the amide proton signals of intracellular proteins and peptides to detect pH effects in MRI. Nat. Med. 9, 1085–1090 (2003).
9. Xu, J. et al. Mapping mean axon diameter and axonal volume fraction by MRI using temporal diffusion spectroscopy. Neuroimage 103, 10–19 (2014).
10. Ong, H. H. et al. Indirect measurement of regional axon diameter in excised mouse spinal cord with q -space imaging?: Simulation and experimental studies. Neuroimage 40, 1619–1632 (2008).
Figures