0997
CEST-weighted MRI at 21.1 T: application to glioma and ischemic rat model1NeuroSpin, Commisariat à l'Energie Atomique et aux Energies Alternatives, Gif-sur-Yvette, France, 2Department of Chemical Physics, Weizmann Institute of Science, Rehovot, Israel, 3National High Magnetic Field Laboratory, Florida State University, Tallahassee, FL, United States, 4Department of Chemical & Biomedical Engineering, The Florida State University, Tallahassee, FL, United States
Synopsis
This study explores and demonstrates the opportunities opened by ultrahigh fields for in vivo CEST-weighted imaging. CEST-weighted fast spin-echo imaging was performed on two neurological models: hypoxic ischemic and glioblastoma. A remarkably strong CEST contrast (≈15%) was observed for the tumors at 3.32 ppm originating mainly from an APT increase and a strong decrease in NOE and MT. Ischemic lesions were still more robustly detected with standard T2-weighted images than with CEST. Potential explanations and dependence with high magnetic field are discussed.
Purpose
CEST methodologies are receiving growing interest in the MRI community1,2 and are involved in many preclinical and clinical studies. CEST measures the losses in water signal intensity caused by the saturation of exchangeable protons. Amide Proton Transfer3 (APT) is the most commonly used endogenous CEST-weighted imaging approach, and has been used to quantitatively map tissues in brain tumors4 and ischemic tissue.5 However, the origins of the CEST contrast –especially in tumors– are still debated and can be influenced by several physical and physiological parameters including temperature, pH5 and specific metabolite concentration such as glucose6 or glutamate.7 Recent preclinical8 and clinical studies9 at higher magnetic fields have shown that NOE can contribute to the CEST contrast. This paper explores for the first use of endogenous CEST-weighted imaging to detect strokes (a) and glioblastoma tumors (b) in rats at 21.1T.Method
Brain ischemia model. To mimic cerebral hypoxic ischemia, a middle cerebral artery occlusion (MCAO) was performed on seven Sprague-Dawley for 1.5h followed by re-perfusion. The animals were imaged 24h following the occlusion.
Glioblastoma model. 9L glioma cells were cultured; 100,000 9L glioma cells were injected at 2mm anterior, 2.5mm lateral and 3.5mm deep with respect to Bregma. Seven male Sprague-Dawley rats were used. Tumor bearing animals were imaged at 7 and 11 days post injection.
MRI acquisitions. All experiments were performed at 21.1T using a Bruker Avance III console and a home-built transmit/receive quadrature surface coil. CEST-weighted 1H RARE images (TE/TR=9/5000ms) were acquired from a 32x32-mm field of view and 1-mm slice thickness (250x250µm in-plane resolution). The CEST preparation achieve a B1 of 3.5µT using a train of 400 10-ms gaussian pulses with a frequency offset varied between –10 and +10ppm (with 23 increments).
Data processing. CEST-weighted images were processed and quantified with a customized MATLAB code using three methods: (a) the commonly used Magnetization Transfer Ratio (MTR) method, (b) the Lorentzian Fit Difference (LFD) method10 which consisted in adjusting a double Lorentzian model to fit the direct saturation of the Z-spectrum and analyzing the fit residue and (c) an APT and NOE three-offset area integration technique.8 Healthy and diseased tissue regions of interest (ROI) were selected and their quantification results were compared.
Results
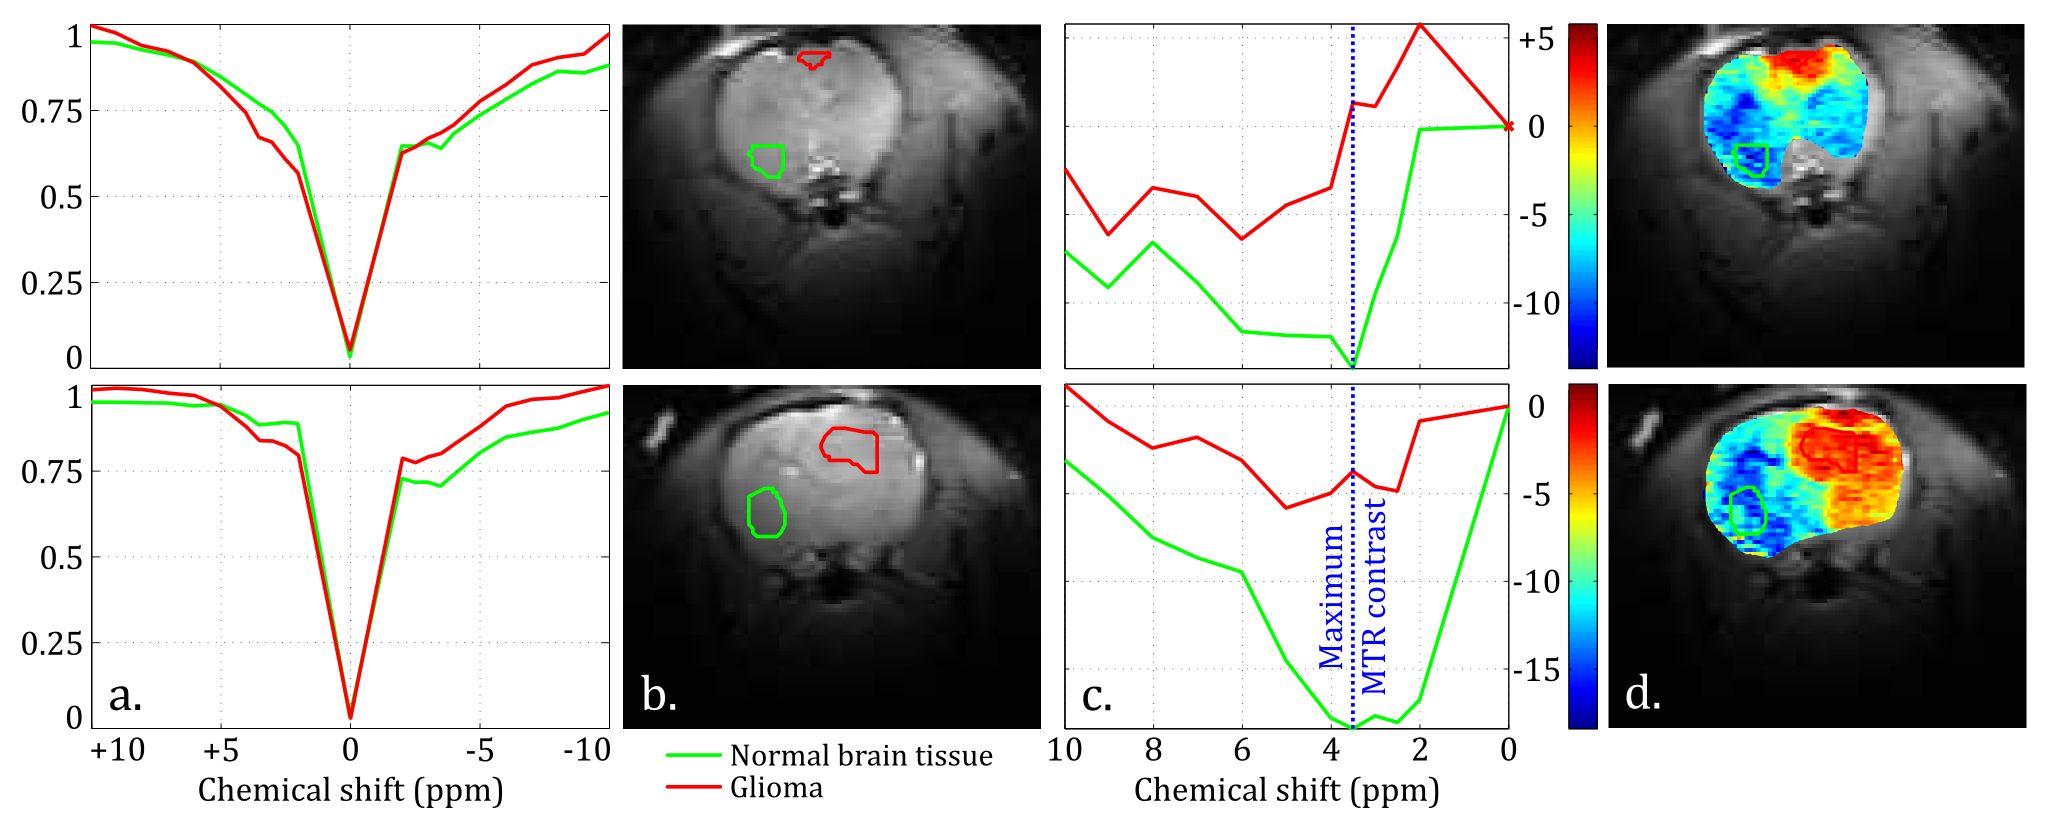
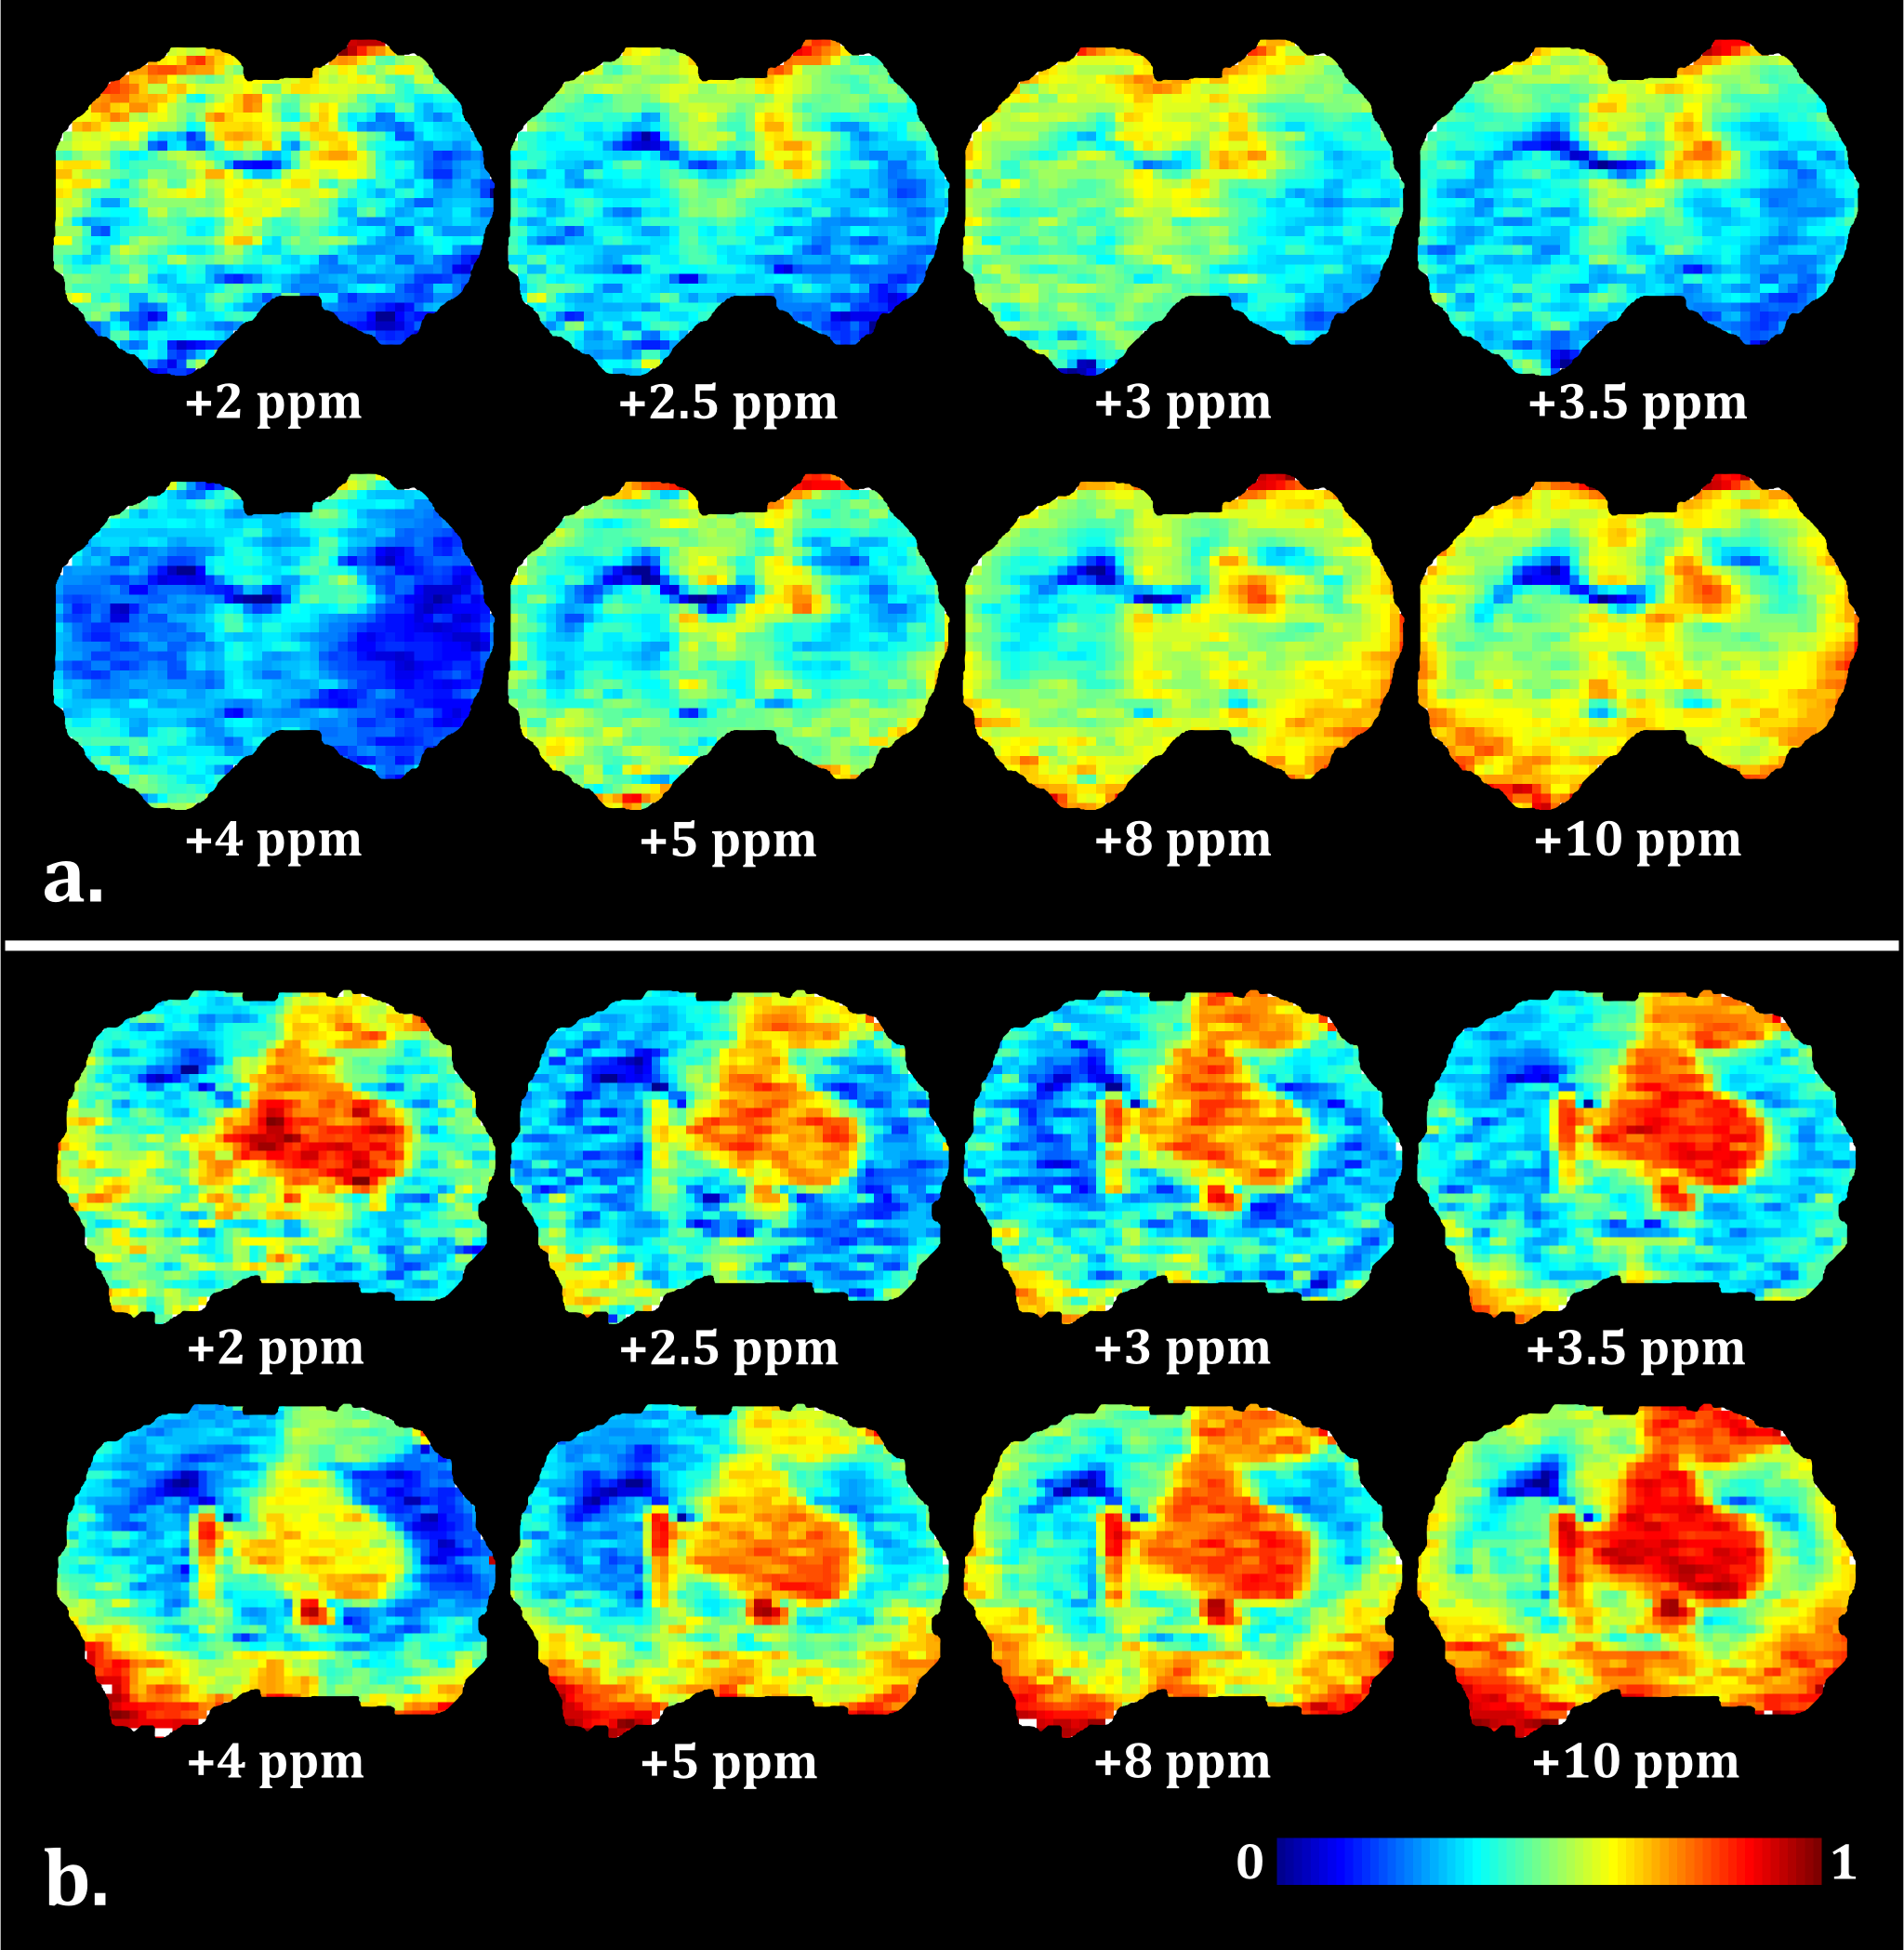
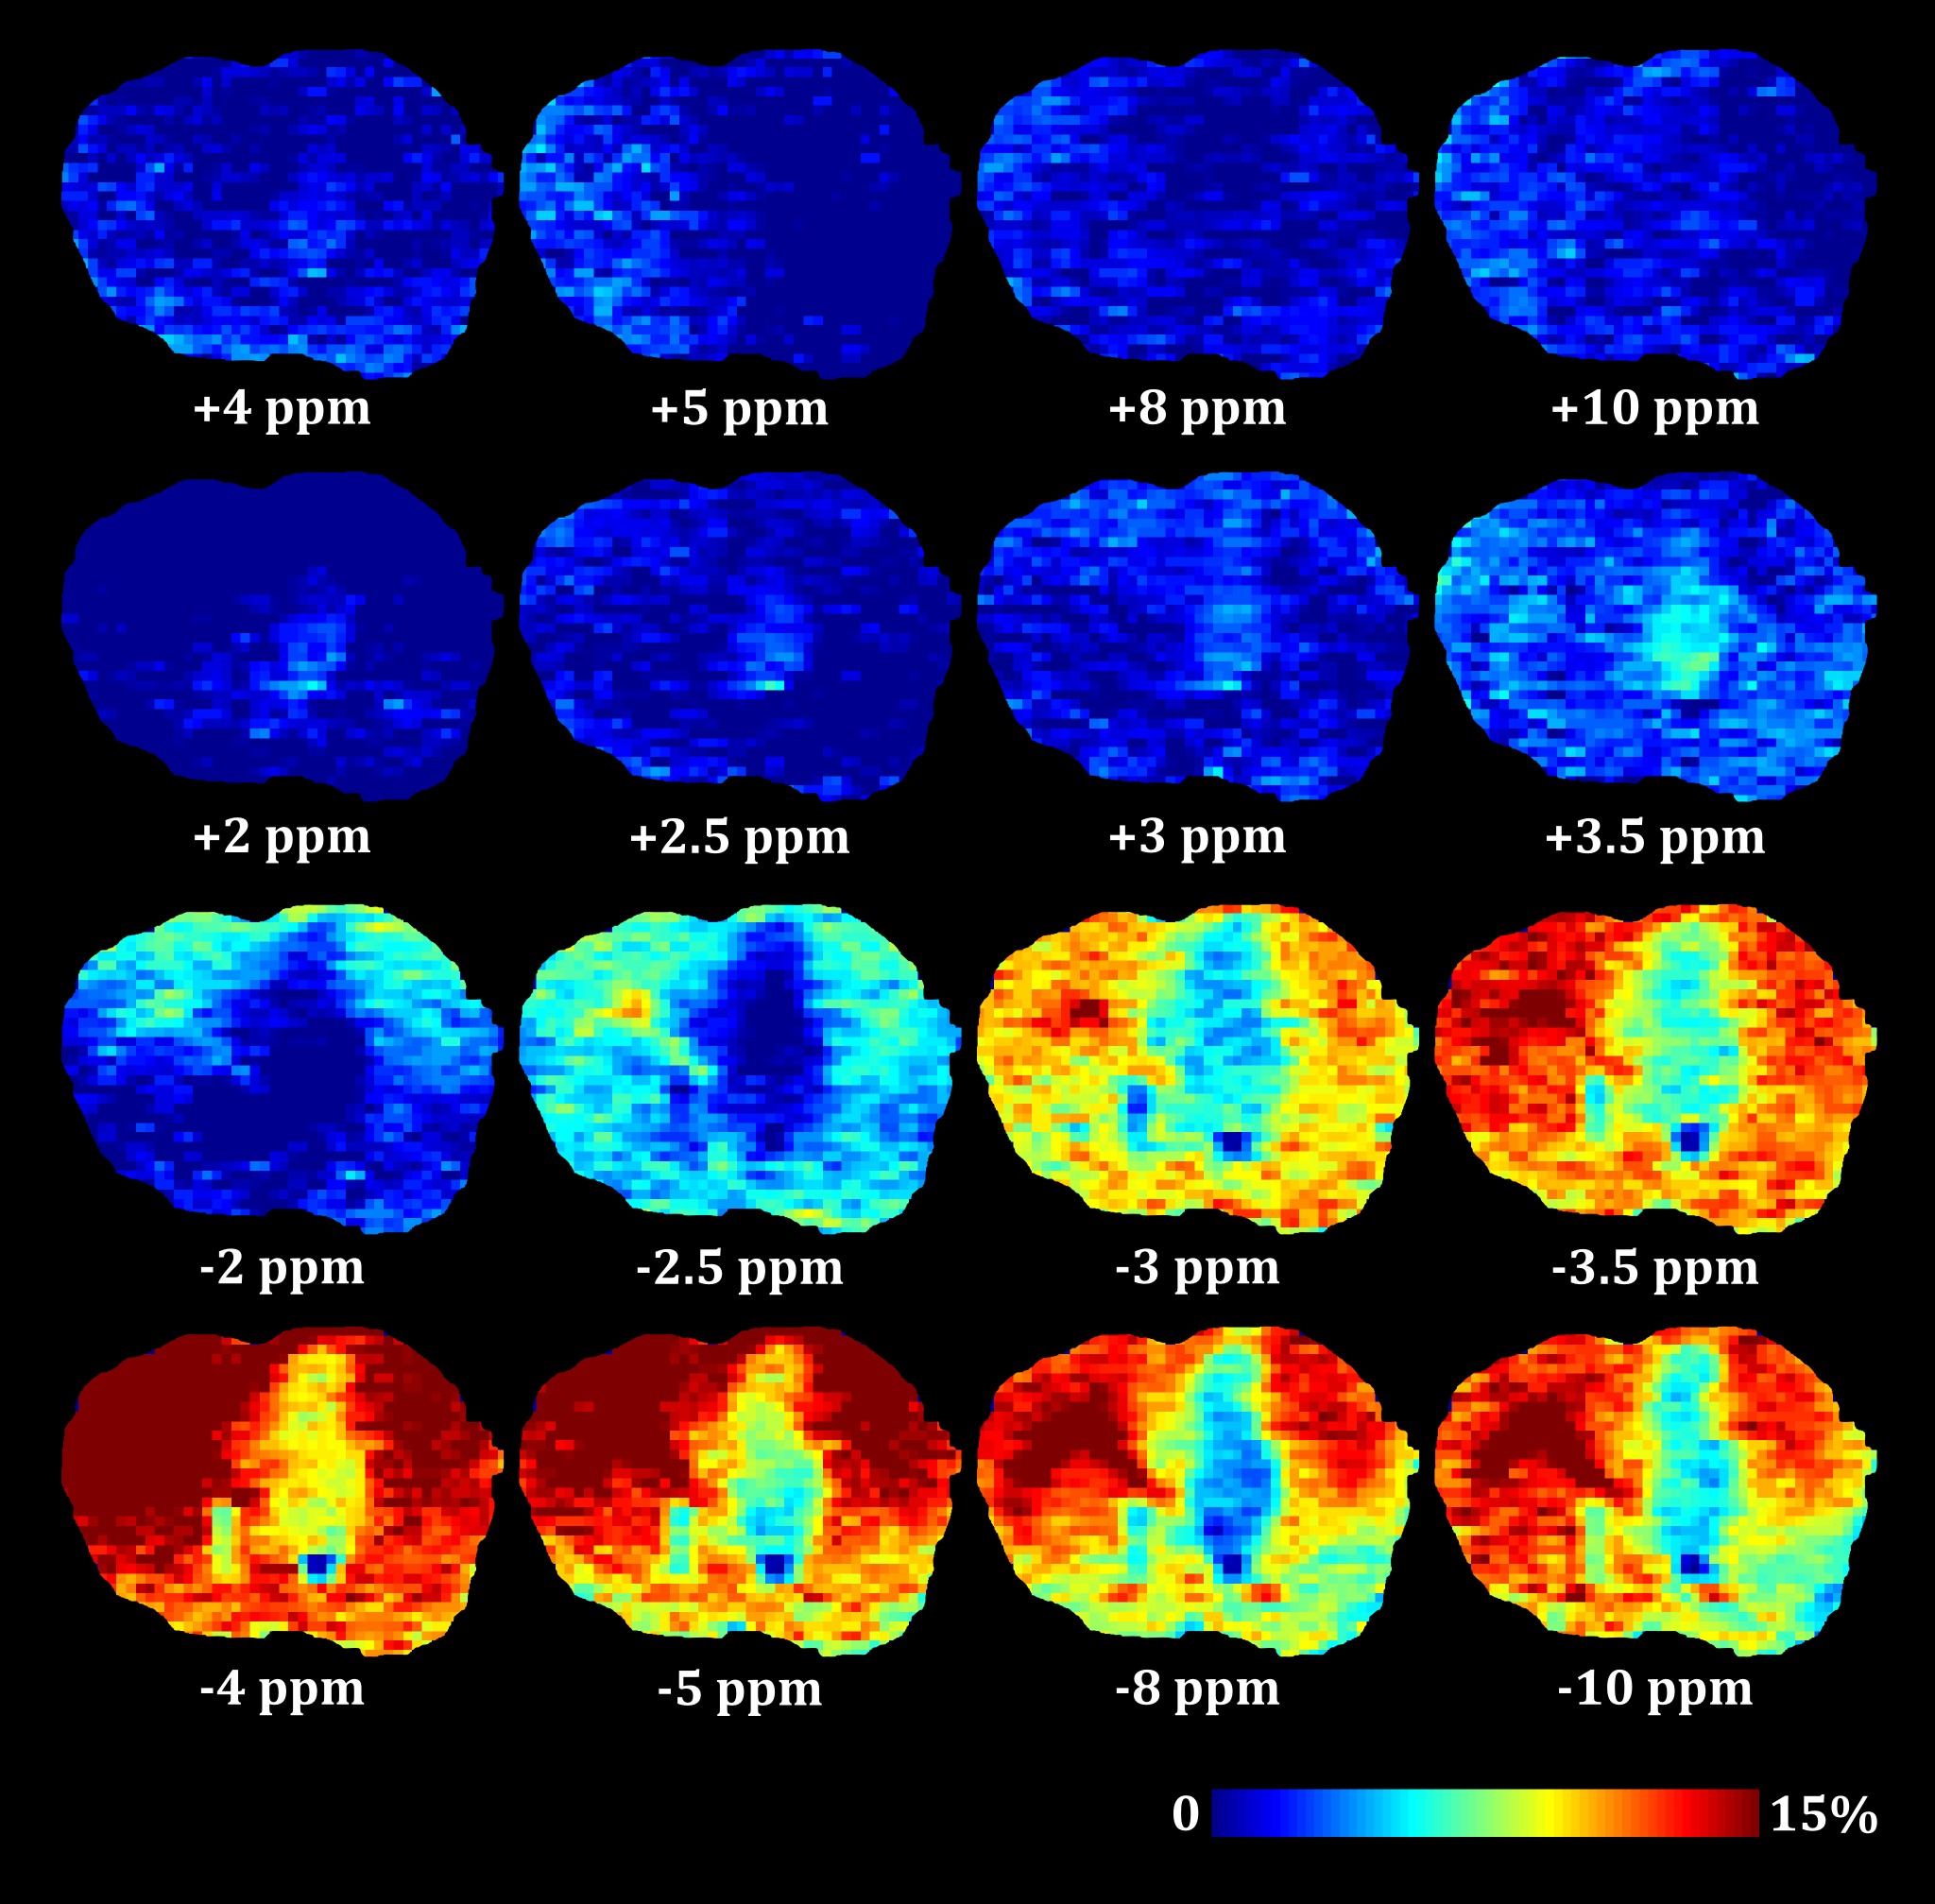
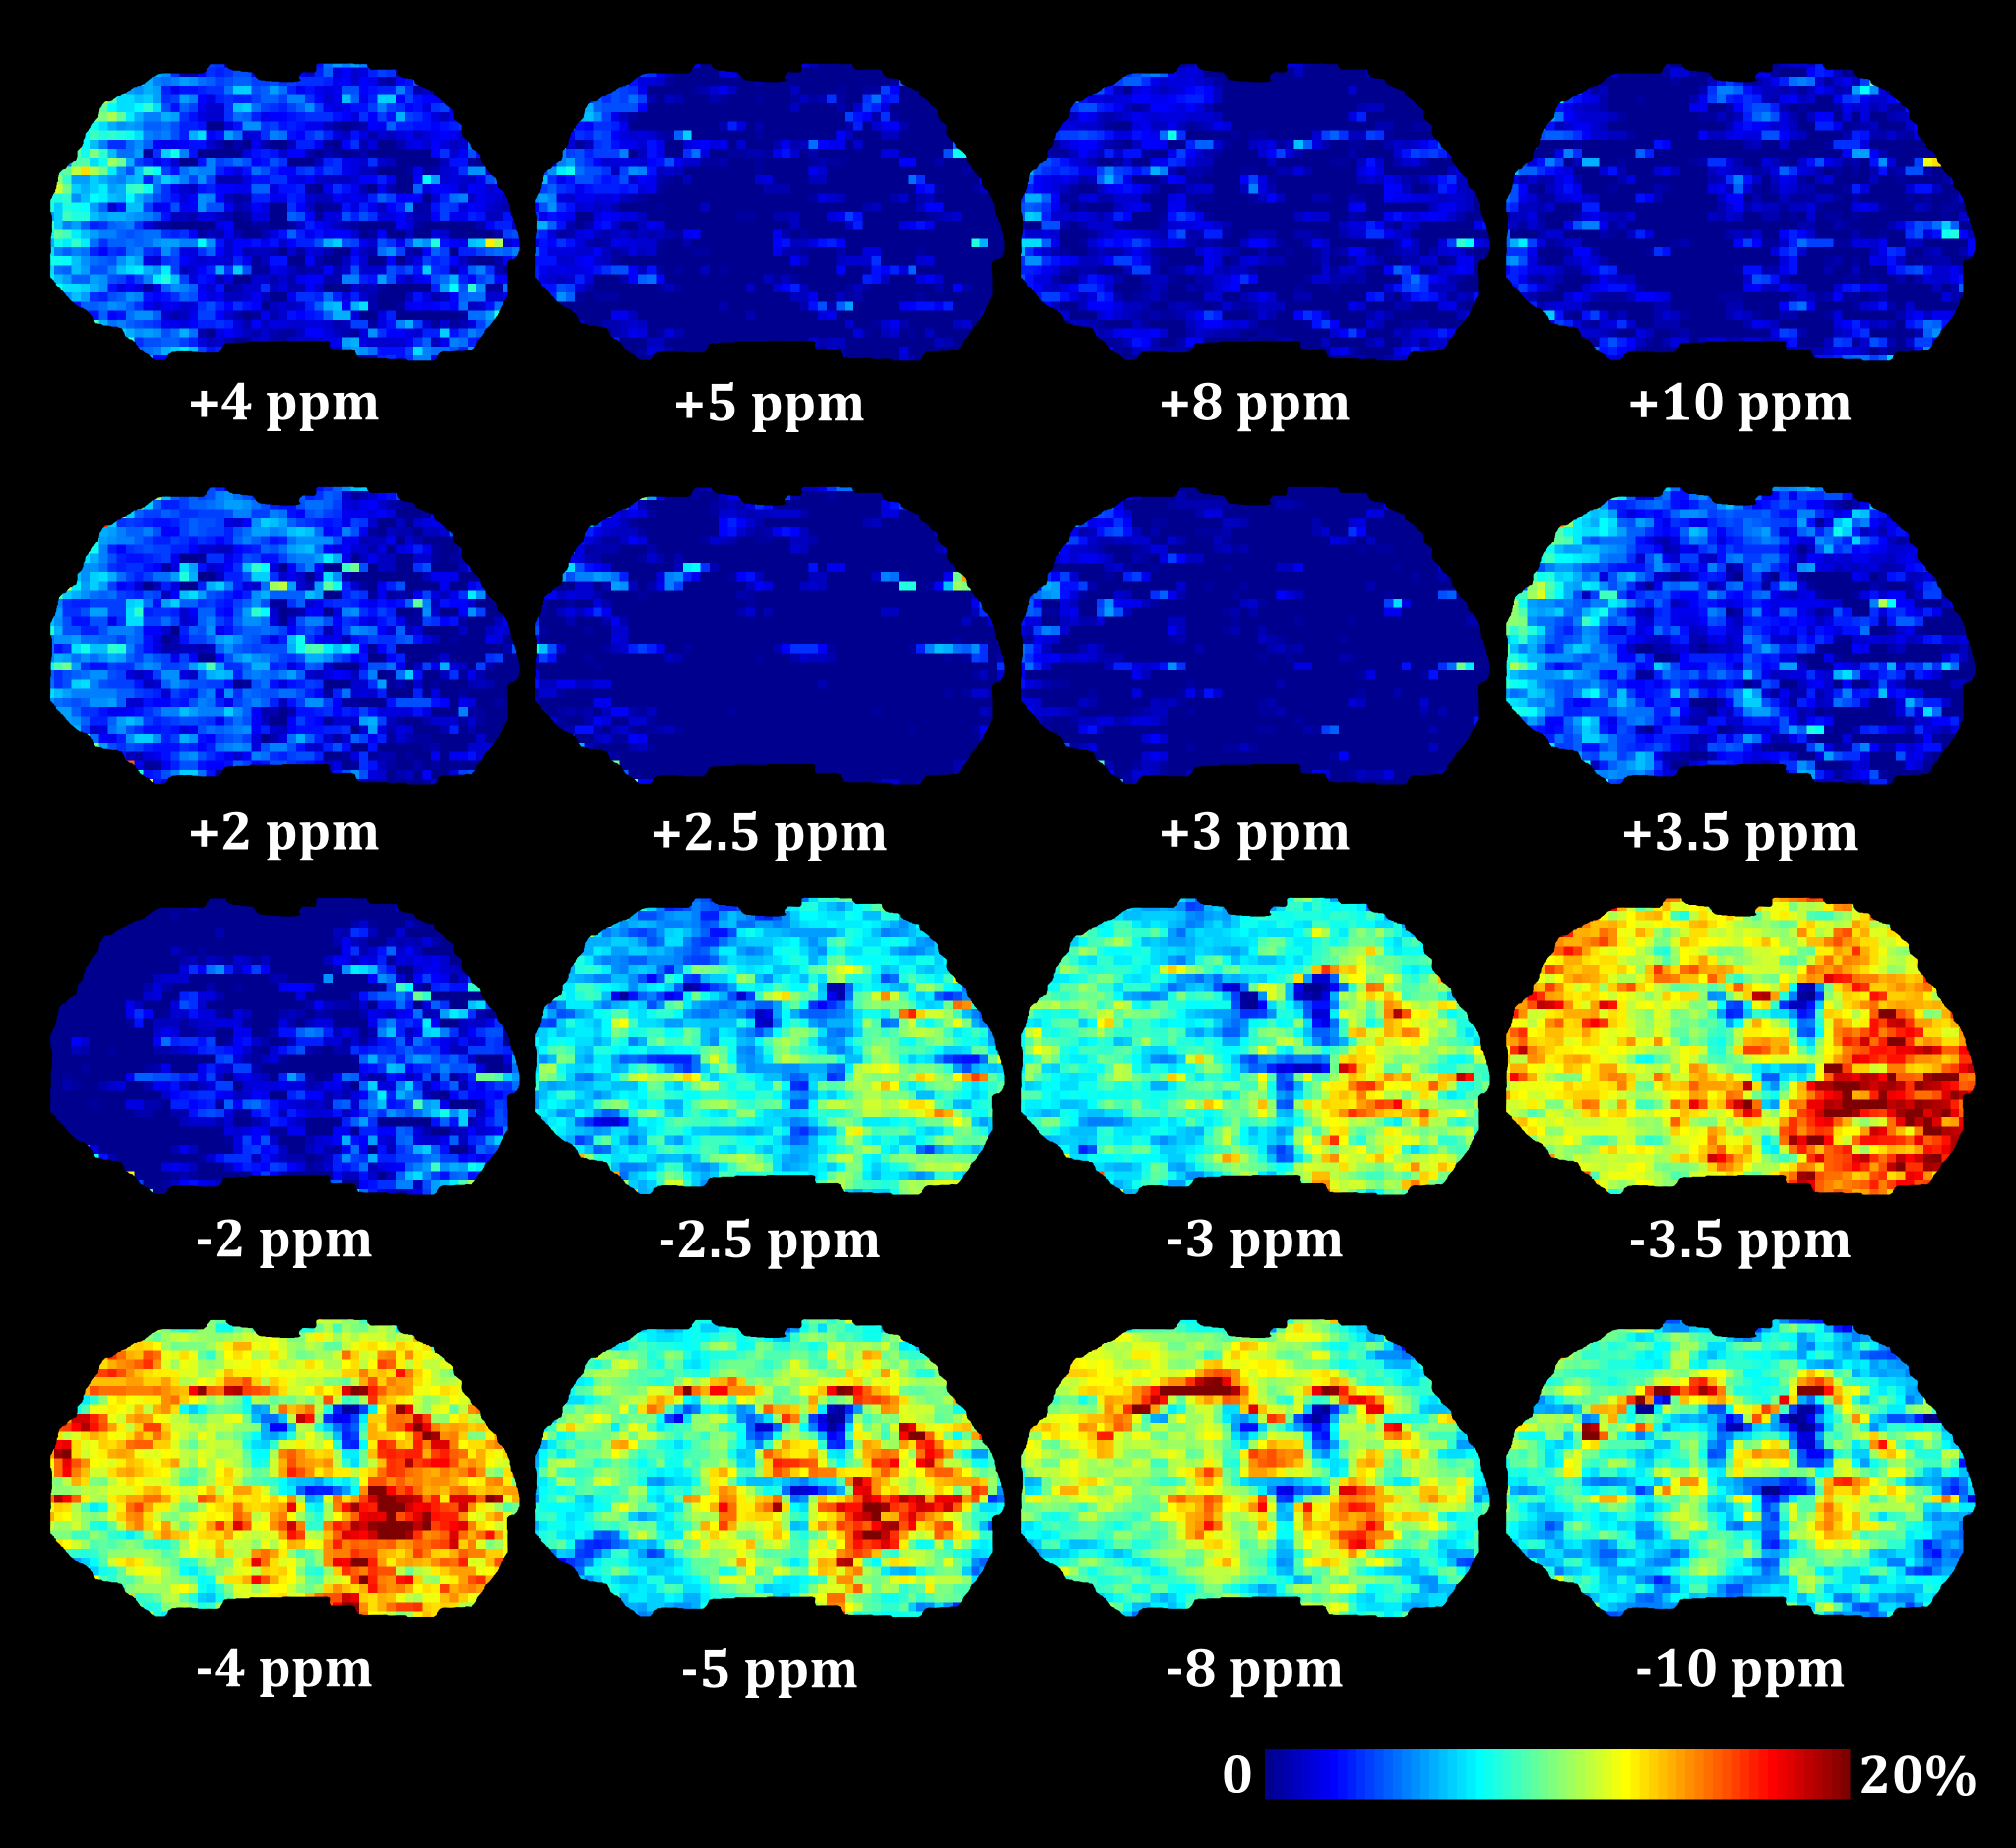
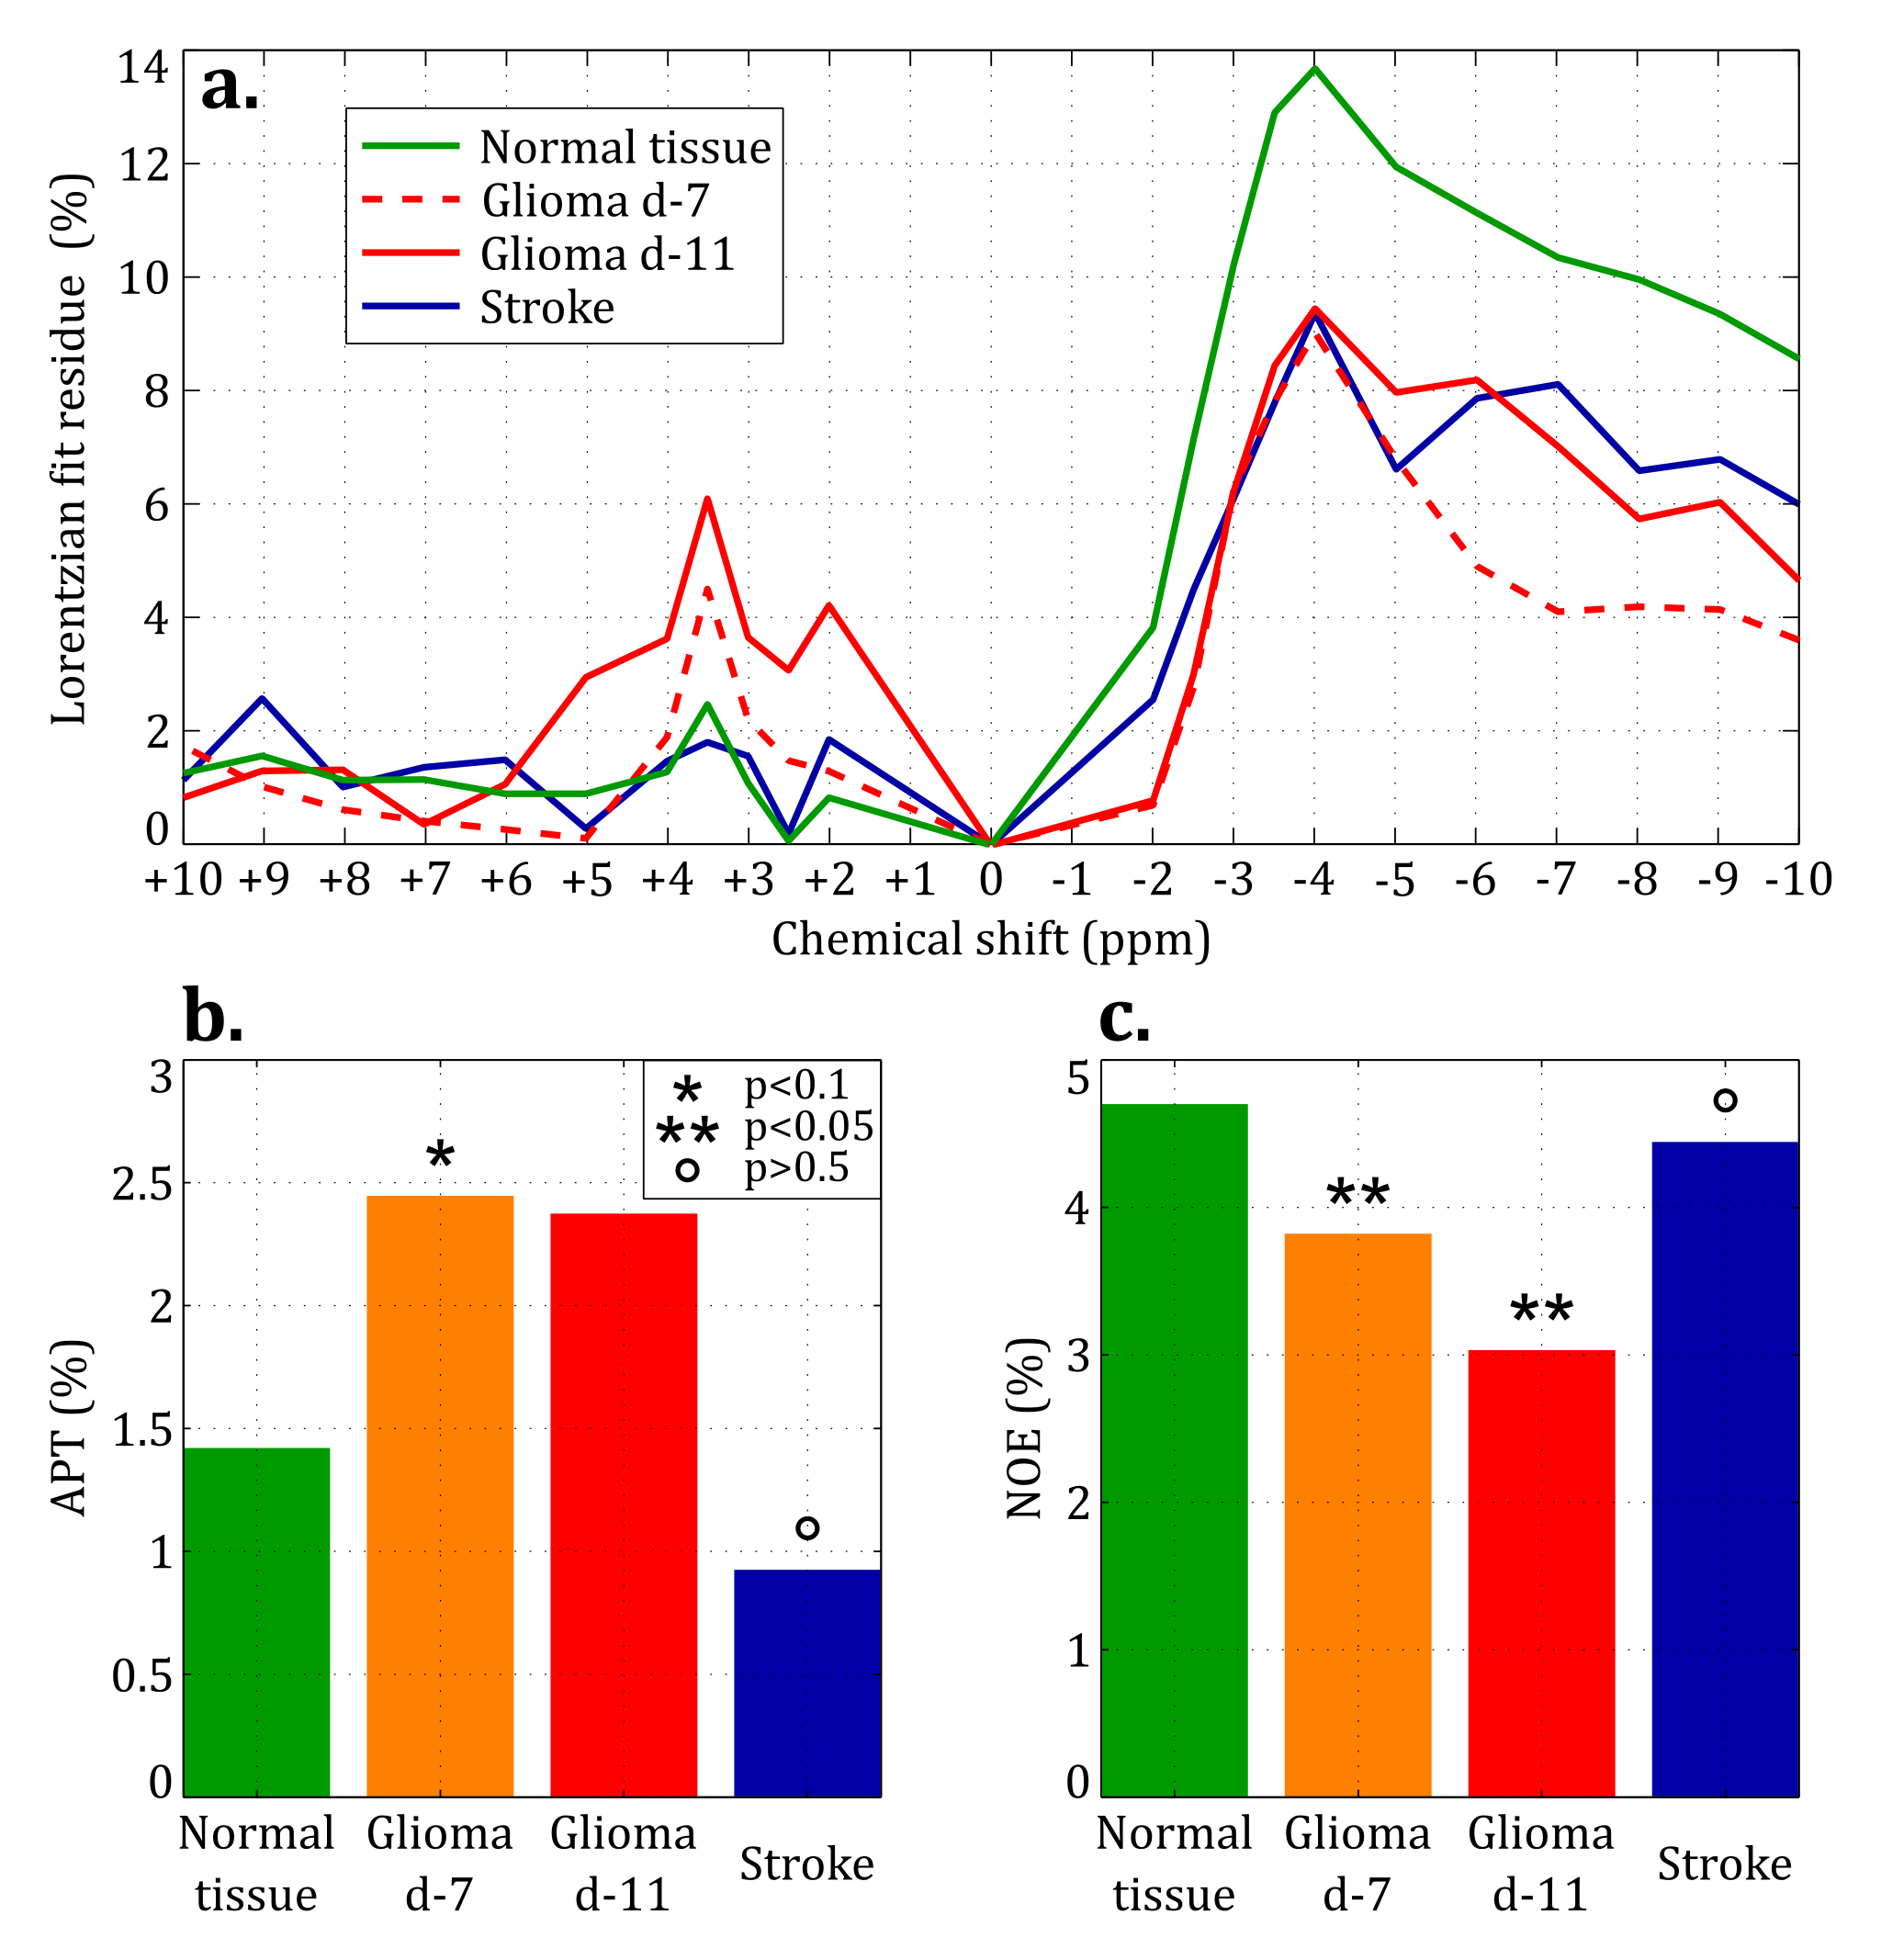
MTR maps from the glioma rat model showed an intense negative contrast highlighting the tumor tissue (Fig. 1 and 2) whereas very low contrast was observed on ischemic tissues. Glioma tissue was observed with a maximum CEST contrast for an average frequency of 3.32±0.57ppm while no statistically significant saturation frequency was found for ischemic tissue (6.35±2.17ppm). Quantitative CEST maps obtained using the LFD method are shown in Figures 3 and 4 respectively for a day-11 glioma rat and a MCAO rat. Figure 5 shows a summary of the quantitative results obtained using the LFD method (Fig. 5a) and the three-offset technique (Fig. 5b) for normal brain, glioma and ischemic tissue.Discussion & Conclusion
A remarkably strong CEST contrast was observed for the glioma tissues at 21.1 T and originates from a decrease in MTR which can reach -15% at +3.3 ppm (Fig. 1c and 2). Using the LFD and the three-offset integration techniques, we observed that three different pools are contributing to the MTR decrease: (i) a significant +1% increase in APT at +3.5ppm (Fig. 3 and 5b), (ii) a very significant -1 to -2% decrease in NOE at -3.5ppm (Fig. 3 and 5c) and (iii) a global -5% drop in MT observable at -10 ppm (Fig. 3 and 5a). Our findings are in agreement with literature where both APT increase8 and NOE decrease1,8,9 – only at high fields – have been reported in glioma tissue. On the contrary, CEST-weighted imaging provided poor contrast when applied to the ischemic rat model. The LFD analysis did not reveal any CEST contributions specific to ischemic tissue (Fig. 4) and APT/NOE levels were not significantly different from normal brain tissue (Fig. 5b and 5c). Ischemic tissue was reported in literature to show a slight decrease in APT11 which can however depend on the measurement time point.12 To conclude, this impressive CEST-weighted enhancement in glioma tissue is probably magnified at ultrahigh fields by the longer T1, the larger chemical shift separation and the faster exchange rates, which potentiate one another to magnify the degree of contrast.Acknowledgements
We thank Cathy Levenson for providing 9L glioma cells and advice. This work was performed at the NHMFL which is supported by NSF DMR-1157490; support also came from the Israel Science Foundation (grant 795/13) and the Kimmel Institute of Magnetic Resonance (Weizmann Institute).References
1. Zaiss M and Bachert P. Chemical exchange saturation transfer (CEST) and MR Z-spectroscopy in vivo: a review of theoretical approaches and methods. Phys Med Biol. 2013;58:R221-R269.
2. Kogan F, Hariharan H and Reddy R. Chemical Exchange Saturation Transfer (CEST) Imaging: Description of Technique and Potential Clinical Applications. Curr Radiol Rep. 2013;1:102-114.
3. Zhou J, Payen JF, Wilson DA, Traystman RJ and van Zijl PCM. Using the amide proton signals of intracellular proteins and peptides to detect pH effects in MRI. Nat Med. 2003;9:1085-1090.
4. Zhou J, Tryggestad E, Wen Z, Lal B, Zhou T, Grossman R, Wang S, Yan K, Fu DX, Ford E, Tyler B, Blakeley J, Laterra J and van Zijl PCM. Differentiation between glioma and radiation necrosis using molecular magnetic resonance imaging of endogenous proteins and peptides. Nat Med. 2011;17:130-134.
5. Sun PZ, Zhou J, Sun W, Huang J and van Zijl PCM. Detection of the ischemic penumbra using pH-weighted MRI. J Cereb Blood Flow Metab. 2007;27:1129-1136.
6. Walker-Samuel S, Ramasawmy R, Torrealdea F, Rega M, Rajkumar V, Johnson SP, Richardson S, Gonçalves M, Parkes HG, Arstad E, Thomas DL, Pedley RB, Lythgoe MF and Golay X. In vivo imaging of glucose uptake and metabolism in tumors. Nat Med. 2013;19:1067-1072.
7. Cai K, Haris M, Singh A, Kogan F, Greenberg JH, Hariharan H, Detre JA and Reddy R. Magnetic resonance imaging of glutamate. Nat Med. 2012;18:302-306.
8. Xu J, Zaiss M, Zu Z, Li H, Xie J, Gochberg DF, Bachert P and Gore JC. On the origins of chemical exchange saturation transfer (CEST) contrast in tumors at 9.4 T. NMR Biomed. 2014;27: 406-416.
9. Zaiss M, Windschuh J, Paech D, Meissner JE, Burth S, Schmitt B, Kickingereder P, Wiestler B, Wick W, Bendszus M, Schlemmer HP, Ladd ME, Bachert P and Radbruch A. Relaxation-compensated CEST-MRI of the human brain at 7T: Unbiased insight into NOE and amide signal changes in human glioblastoma. Neuroimage. 2015;112:180-188.
10. Zaiss M, Schmitt B and Bachert P. Quantitative separation of CEST effect from magnetization transfer and spillover effects by Lorentzian-line-fit analysis of z-spectra. J Magn Reson. 2011;211;149-155.
11. Jin T, Wang P, Zong X and Kim SG. MR imaging of the amide-proton transfer effect and the pH-insensitive nuclear overhauser effect at 9.4 T. Magn Reson Med. 2013;69:760-770.
12. Li H, Zu Z, Zaiss M, Khan IS, Singer RJ, Gochberg DF, Bachert P, Gore JC and Xu J. Imaging of amide proton transfer and nuclear Overhauser enhancement in ischemic stroke with corrections for competing effects. NMR Biomed. 2015;28:200-209.
Figures