0996
Quantification of trans-endothelial water exchange and vessel geometry using contrast-enhanced MRI and alterations in a transgenic rat model of Alzheimer’s disease1Division of Neuroscience and Experimental Psychology, University of Manchester, Manchester, United Kingdom, 2The Wolfson Molecular Imaging Centre, University of Manchester, Manchester, United Kingdom, 3Division of Informatics, Imaging and Data Sciences, University of Manchester, Manchester, United Kingdom, 4Bioxydyn, Manchester
Synopsis
MRI measurements of cerebrovascular function and structure are important for understanding neurodegenerative disease mechanisms. In this study, a novel contrast-enhanced multi-flip angle multi-echo (MFAME) MRI technique capable of simultaneously quantifying vessel permeability surface area product to water (PSw), blood water population fraction (pb), and contrast agent r2* is presented, and applied to a transgenic rat model of Alzheimer’s disease (TgF344-AD). Transgenic rats exhibit higher pb and lower PSw in the hippocampus compared to wild-types, suggesting MFAME MRI may be sensitive to regional pathologic microvascular alterations in this model.
Purpose
MRI measurements of cerebrovascular function and structure are important to aid understanding of neurodegenerative disease mechanisms and for use as imaging biomarkers sensitive to the action of novel targeted therapeutics. In particular, sensitive measurements of blood-brain-barrier (BBB) damage appears important1,2. This work presents a rapid contrast-enhanced multi-flip angle multi-echo MRI protocol (MFAME-MRI) for combined measurement of mean blood water residence time (τb [s]), water permeability surface area product (PSw [mL min-1 mL-1]), blood water population fraction (pb), and in-vivo contrast agent r2* [mM s]-1 (a parameter theoretically dependent on vessel geometry)3,4. Signal sensitivity and error analyses were performed. Optimised sequences were then applied to an aged rat model of Alzheimer’s disease5 (TgF344-AD) and differences between transgenic and wild-type animals evaluated.Methods
Sensitivity and error analysis: Sensitivity of tissue MRI signals to τb , pb , and PSw (PSw = pbλ/τb, λ is the blood-tissue partition coefficient = 0.8) were evaluated using a generalized two-site exchange spoiled gradient echo signal model (2SX-SPGR)6:
$$S_{t}(TE = 0) = S_{0}\big[a_{s}\frac{sin(\theta)(1-e^{-\frac{TR}{T_{1,S}}})}{1-cos(\theta)e^{\frac{-TR}{T_{1,S}}}} + (1-a_{s})\frac{sin(\theta)(1-e^{-\frac{TR}{T_{1,L}}})}{1-cos(\theta)e^{\frac{-TR}{T_{1,L}}}}\big]$$
where S0 is a scaling constant, θ is the flip angle, TR the repetition time, T1,S and T1,L, are the apparent T1 relaxation times of short and long T1 compartments, and as is the apparent water population fraction of the short T1 compartment. Dependence of St(TE = 0) on pb and τb arises through T1,S, T1,L, and as via known analytic expressions7. Monte Carlo simulations were performed to assess the effect of image noise, transmit B1 error, and non-zero Ktrans on pb, τb, and PSw.
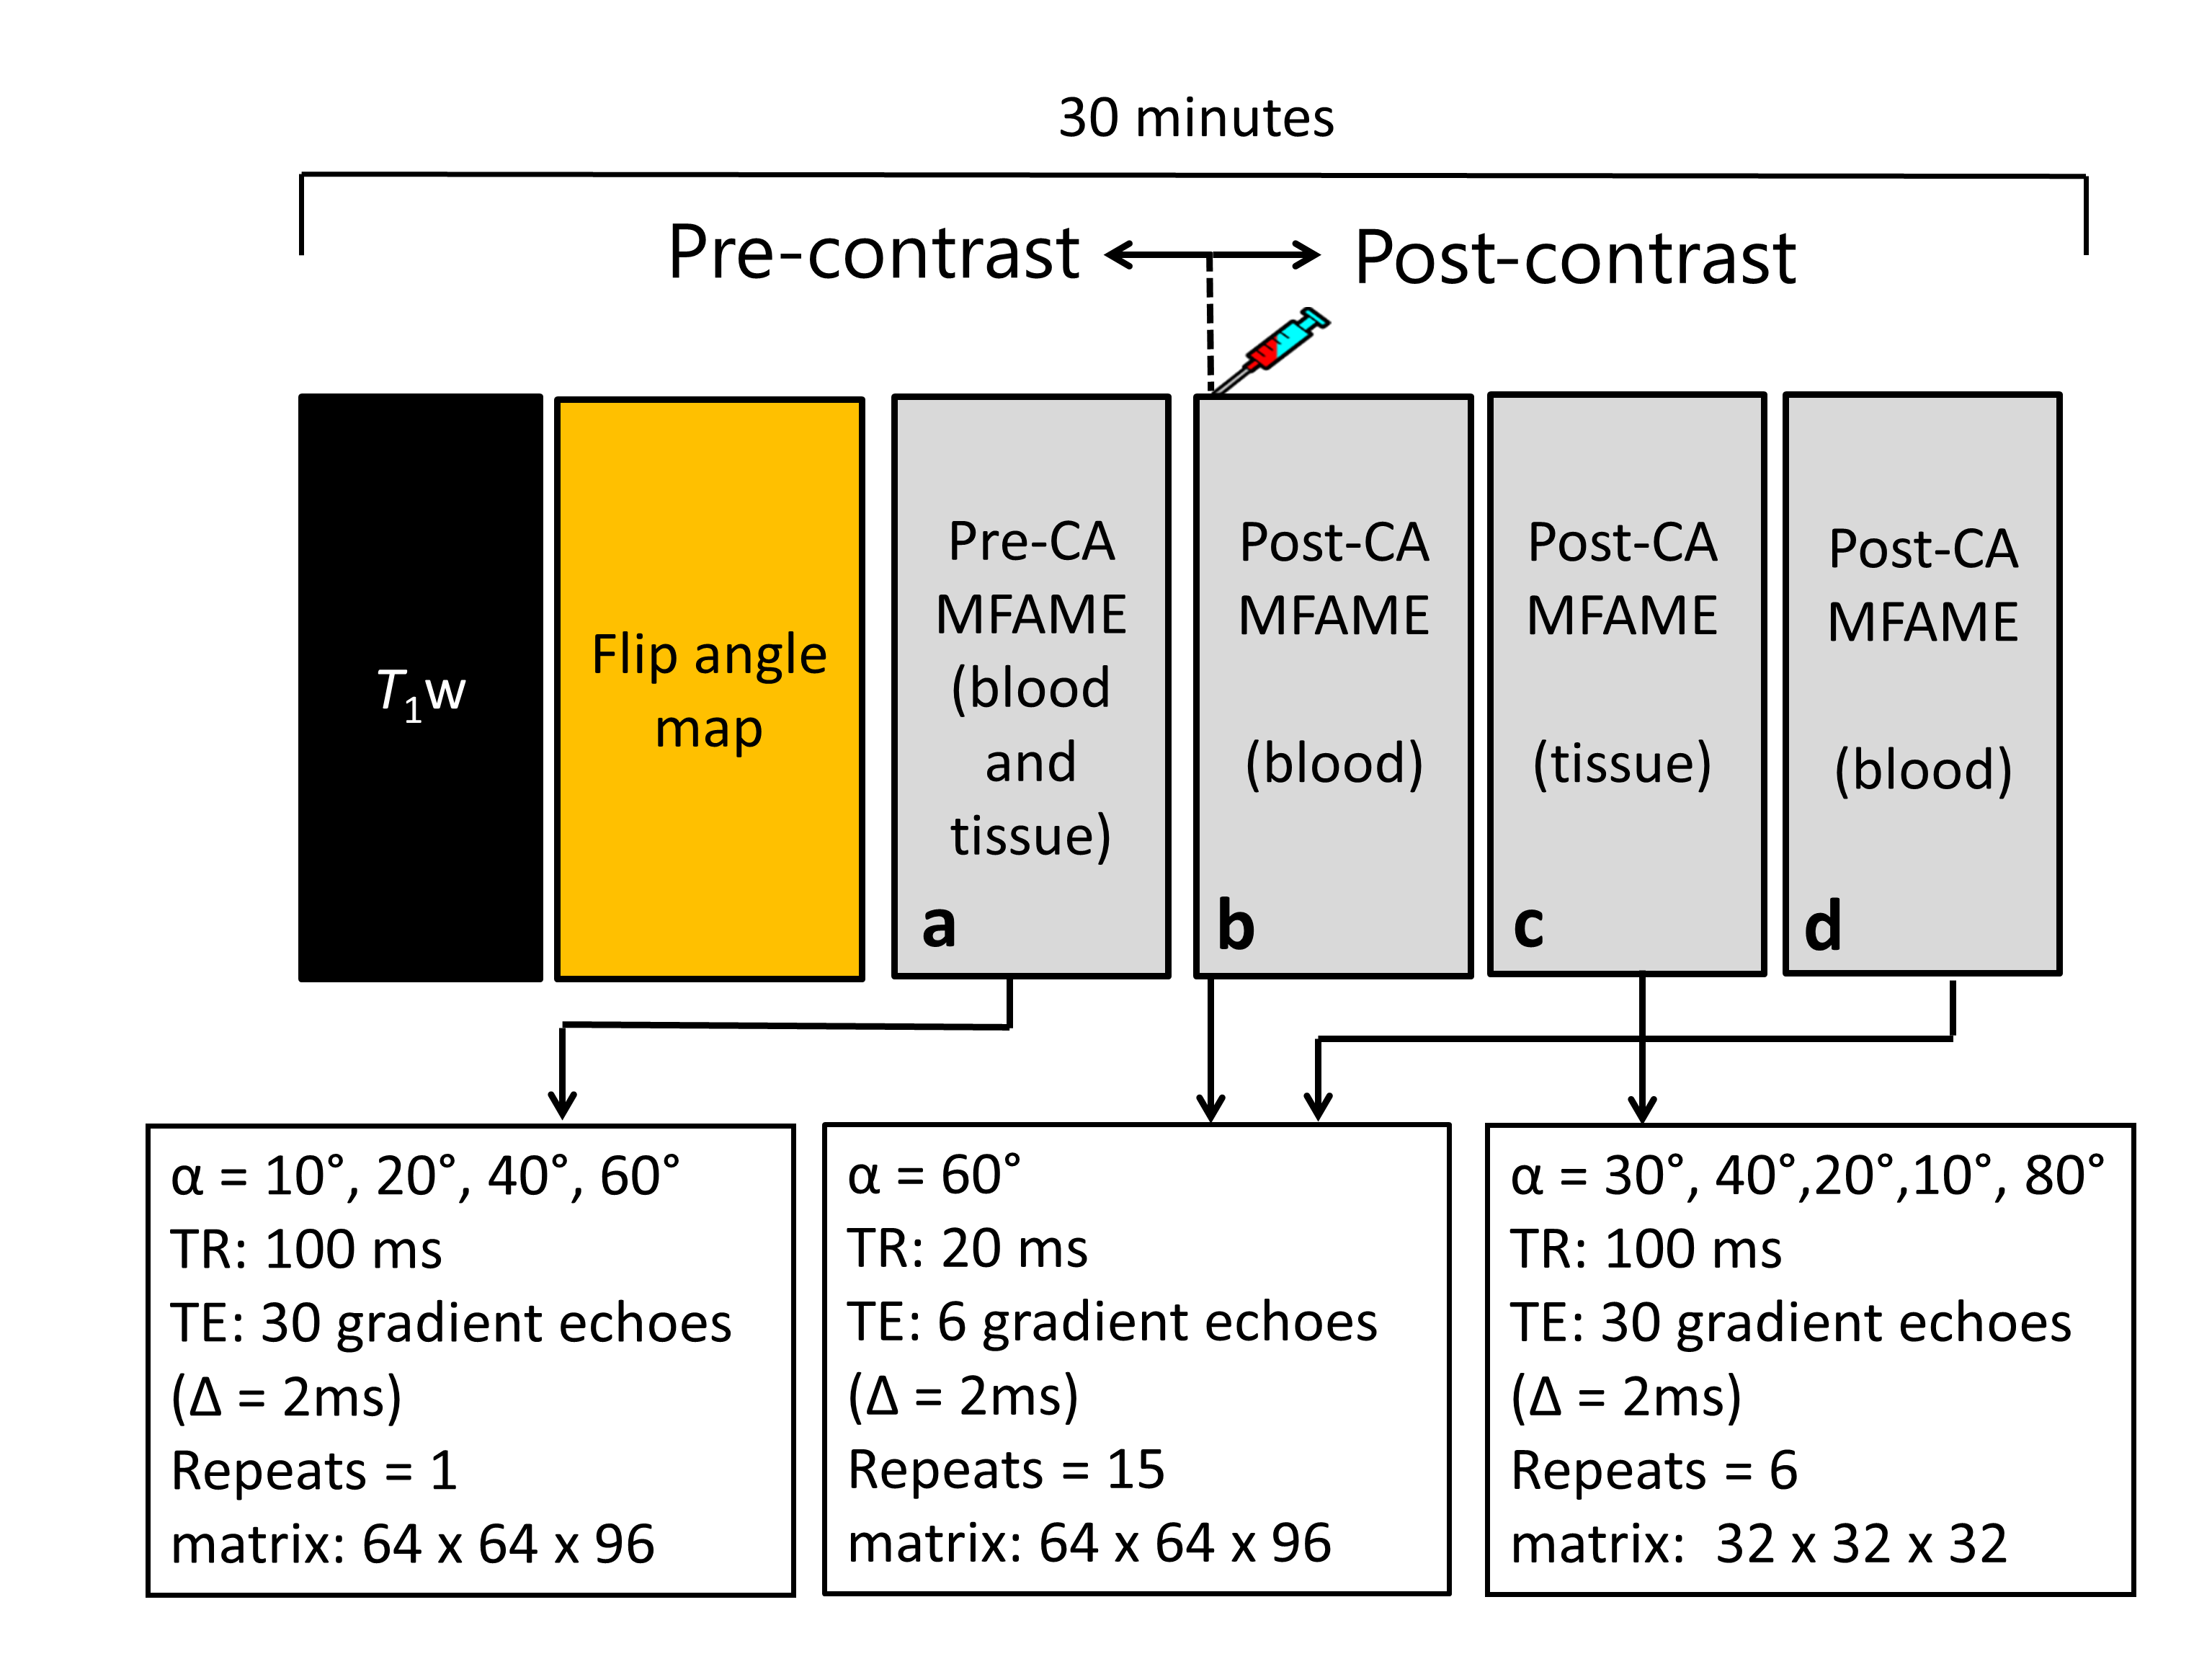
MR Imaging: Figure 1 shows the MRI protocol. A rat model of early-onset Alzheimer’s disease5 (TgF344-AD; transgenic [n = 8], wild-type controls [n = 8]) was imaged aged 18 months on a 7T Bruker BioSpec MRI scanner (Bruker Corporation, Billerica, USA. At 18 months of age, transgenic TgF344-AD rats display increased amyloid-beta, tau, and neuronal loss, relative to wild-type controls5. The manufacturer supplied rat head coil was used for signal reception. Rats were anesthetised with 2-2.5% isoflurane + 100% O2. Contrast agent (Gd-DOTA, 0.5 mmol/kg) was injected through a tail vein cannula at 1mL/min.
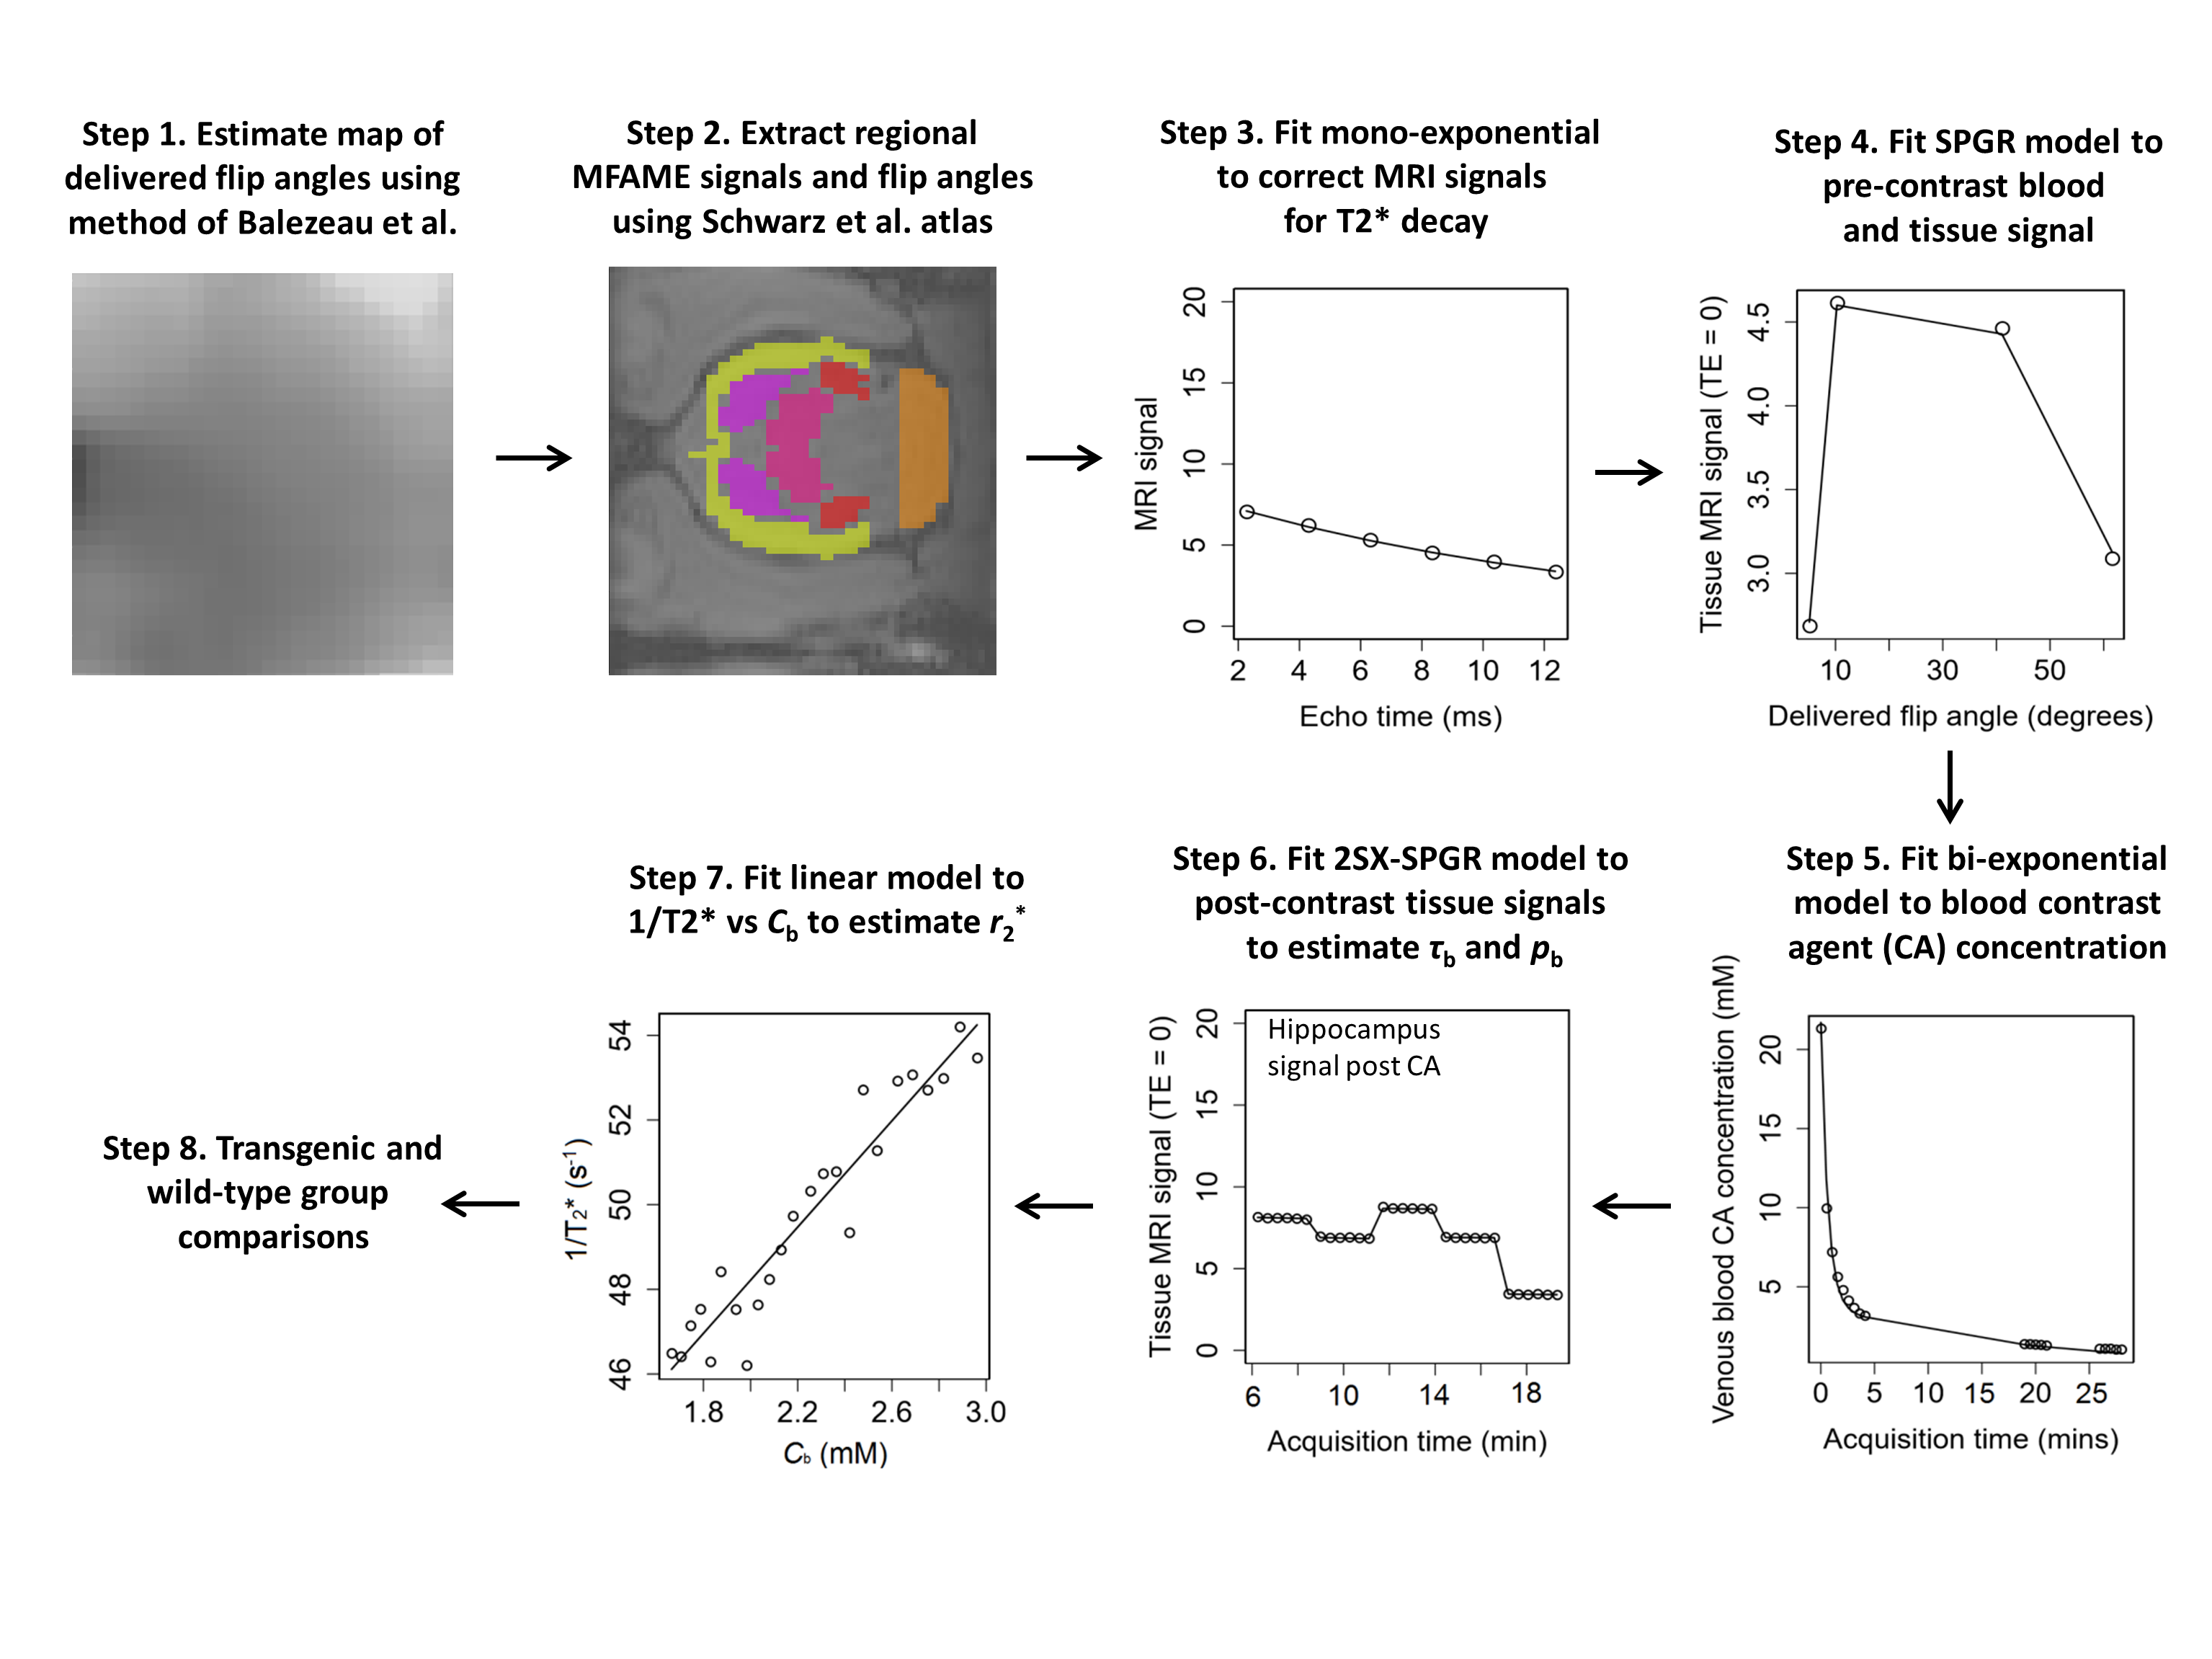
Image analysis: Figure 2 provides details of the image analysis pipeline. Briefly, flip angles were mapped to allow correction for B1 error8. Regional MRI signals were extracted from the hippocampus, cerebellum, cortex, thalamus, and striatum using the Schwarz rat brain atlas9. Blood signal was taken from the superior sagittal sinus. An exponential model was fitted to each multi-echo readout, giving estimates of T2*, and also providing decay correction to TE = 0. Native T1 of blood and tissue were estimated from pre-contrast decay-corrected signals, assuming the fast exchange limit (FXL). Blood contrast agent concentration was estimated by fitting a bi-exponential clearance model to post-contrast decay-corrected blood signal. Parameters pb and τb were estimated by fitting the 2SX-SPGR model to post contrast decay-corrected tissue signals. PSw was computed as above. Contrast agent r2* was estimated by fitting a linear model to 1/T2*(t) = r2*Cb(t). To quantify leakage of contrast agent across the BBB, Ktrans was estimated by fitting the Patlak model2 to image sets a, b and d (Figure 1). The null hypothesis of no difference in parameter estimates between transgenic and wild-type groups was tested.
Results
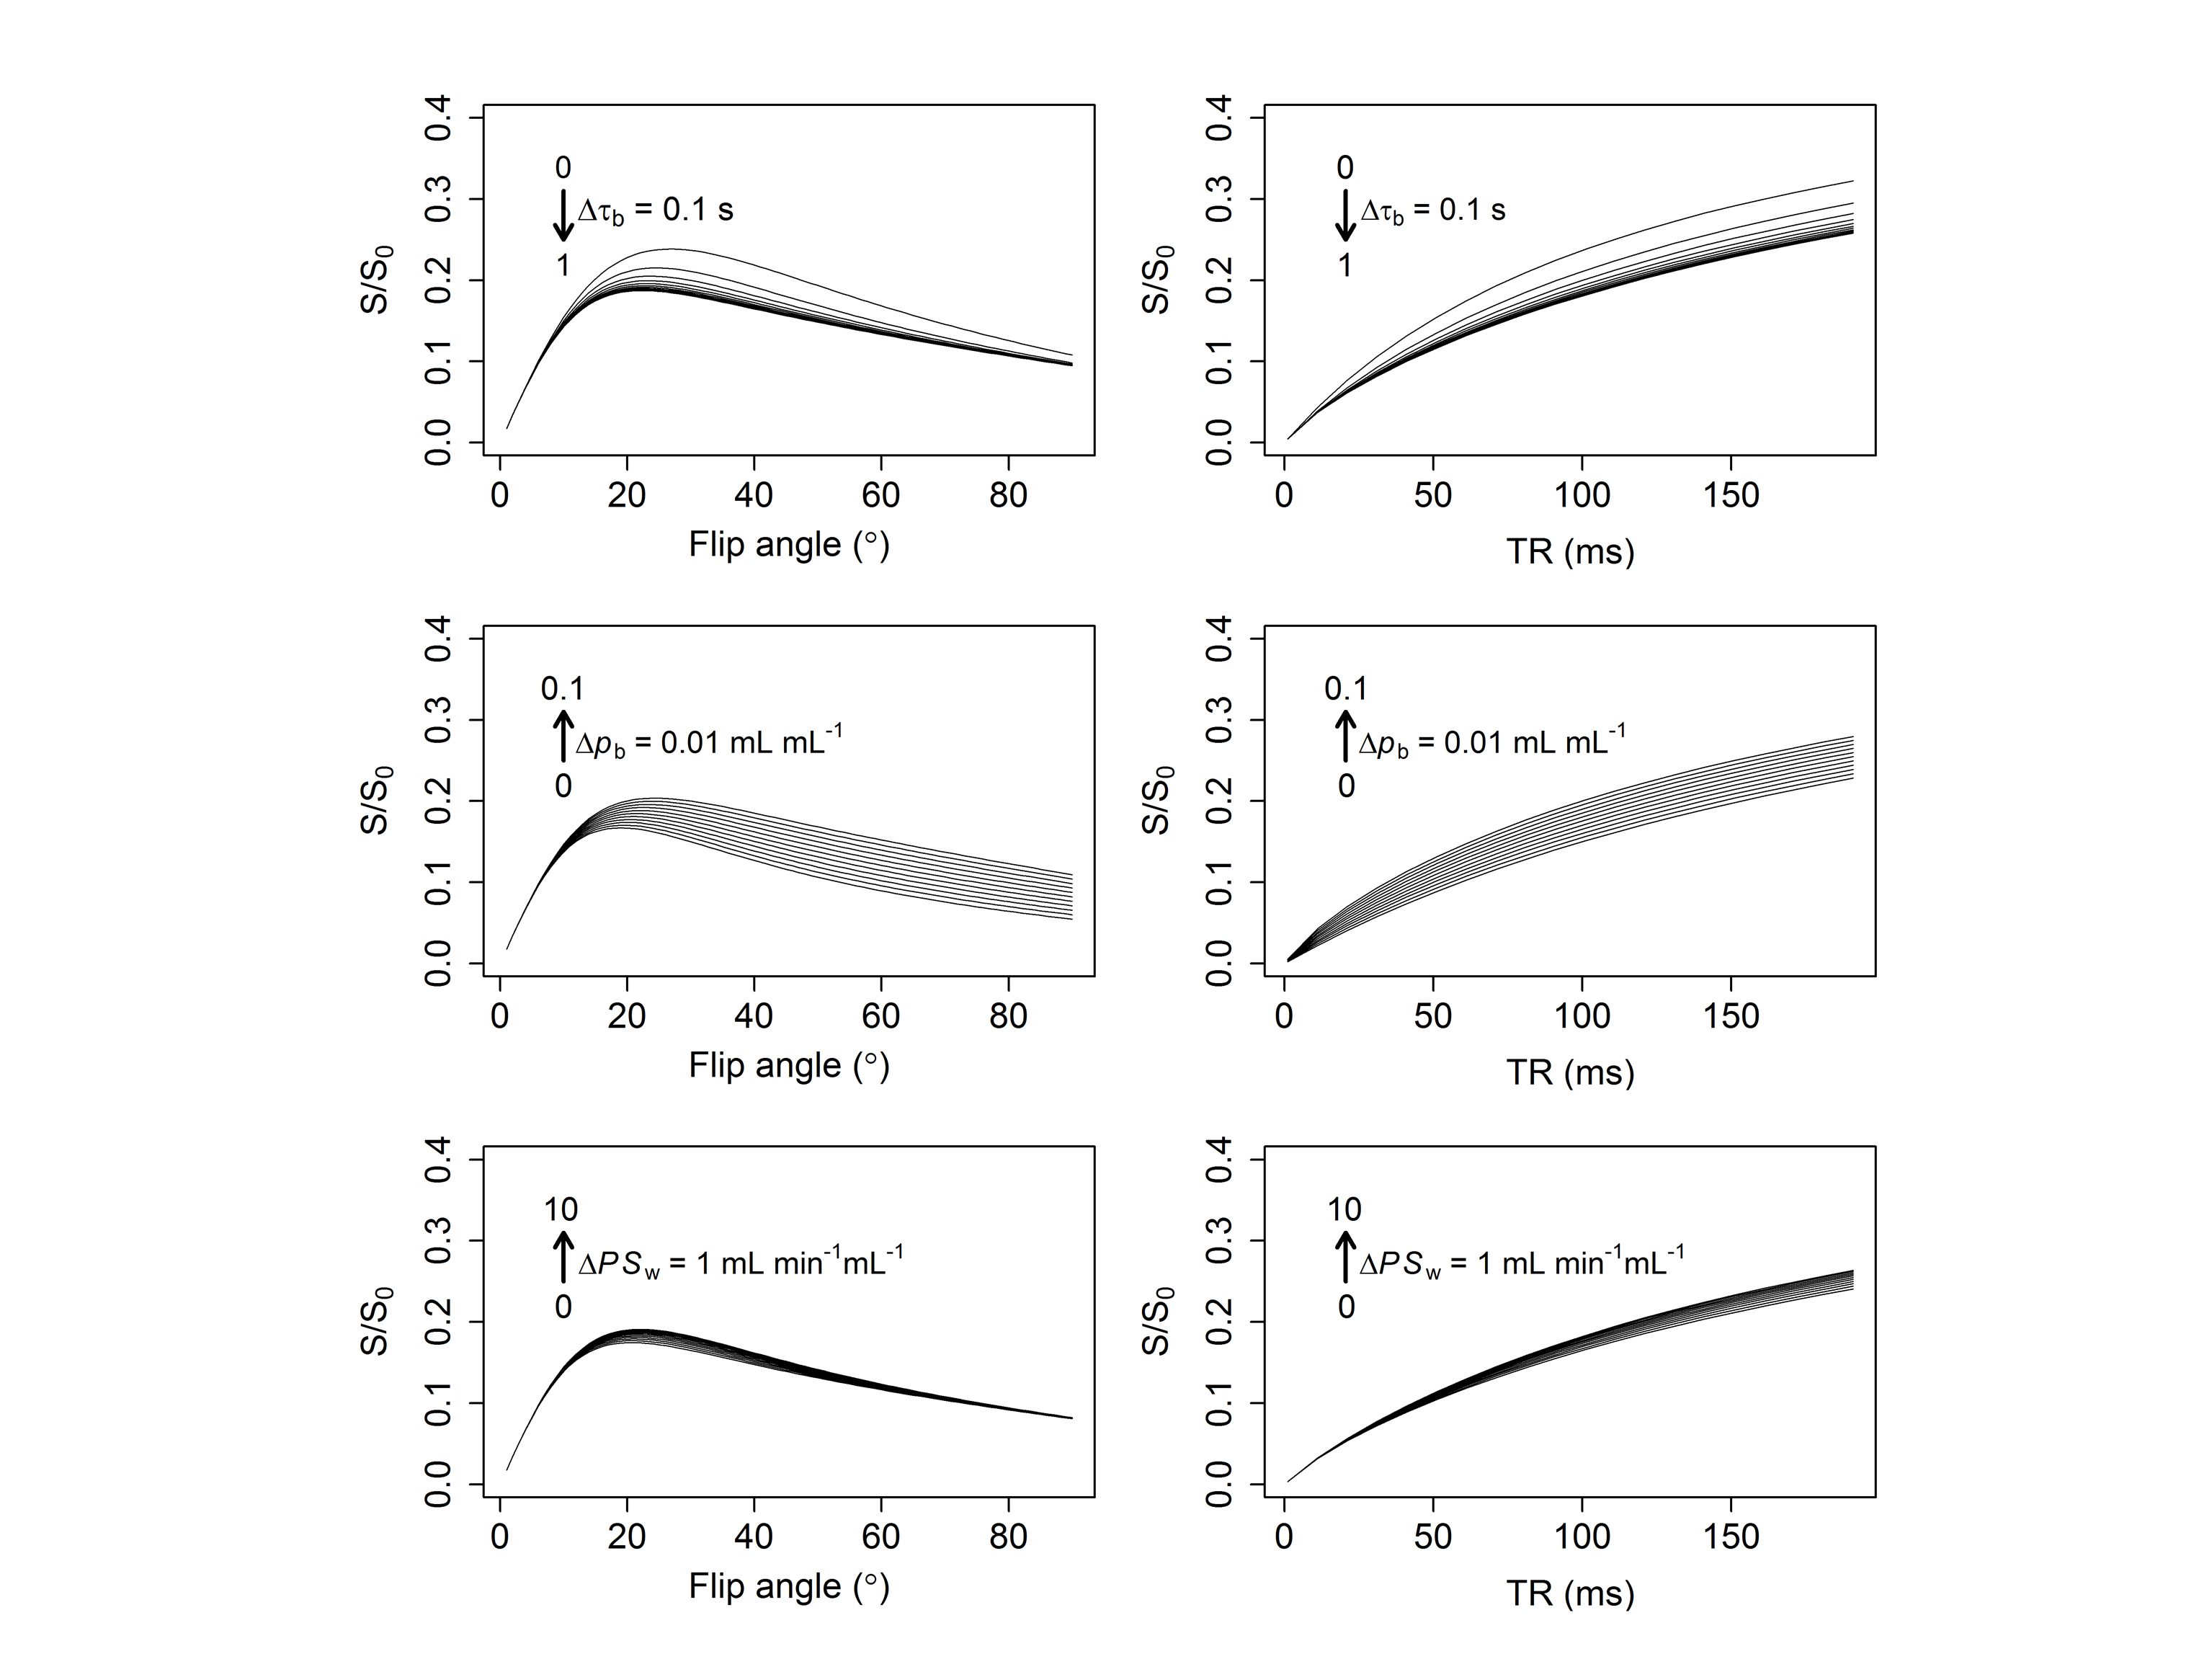
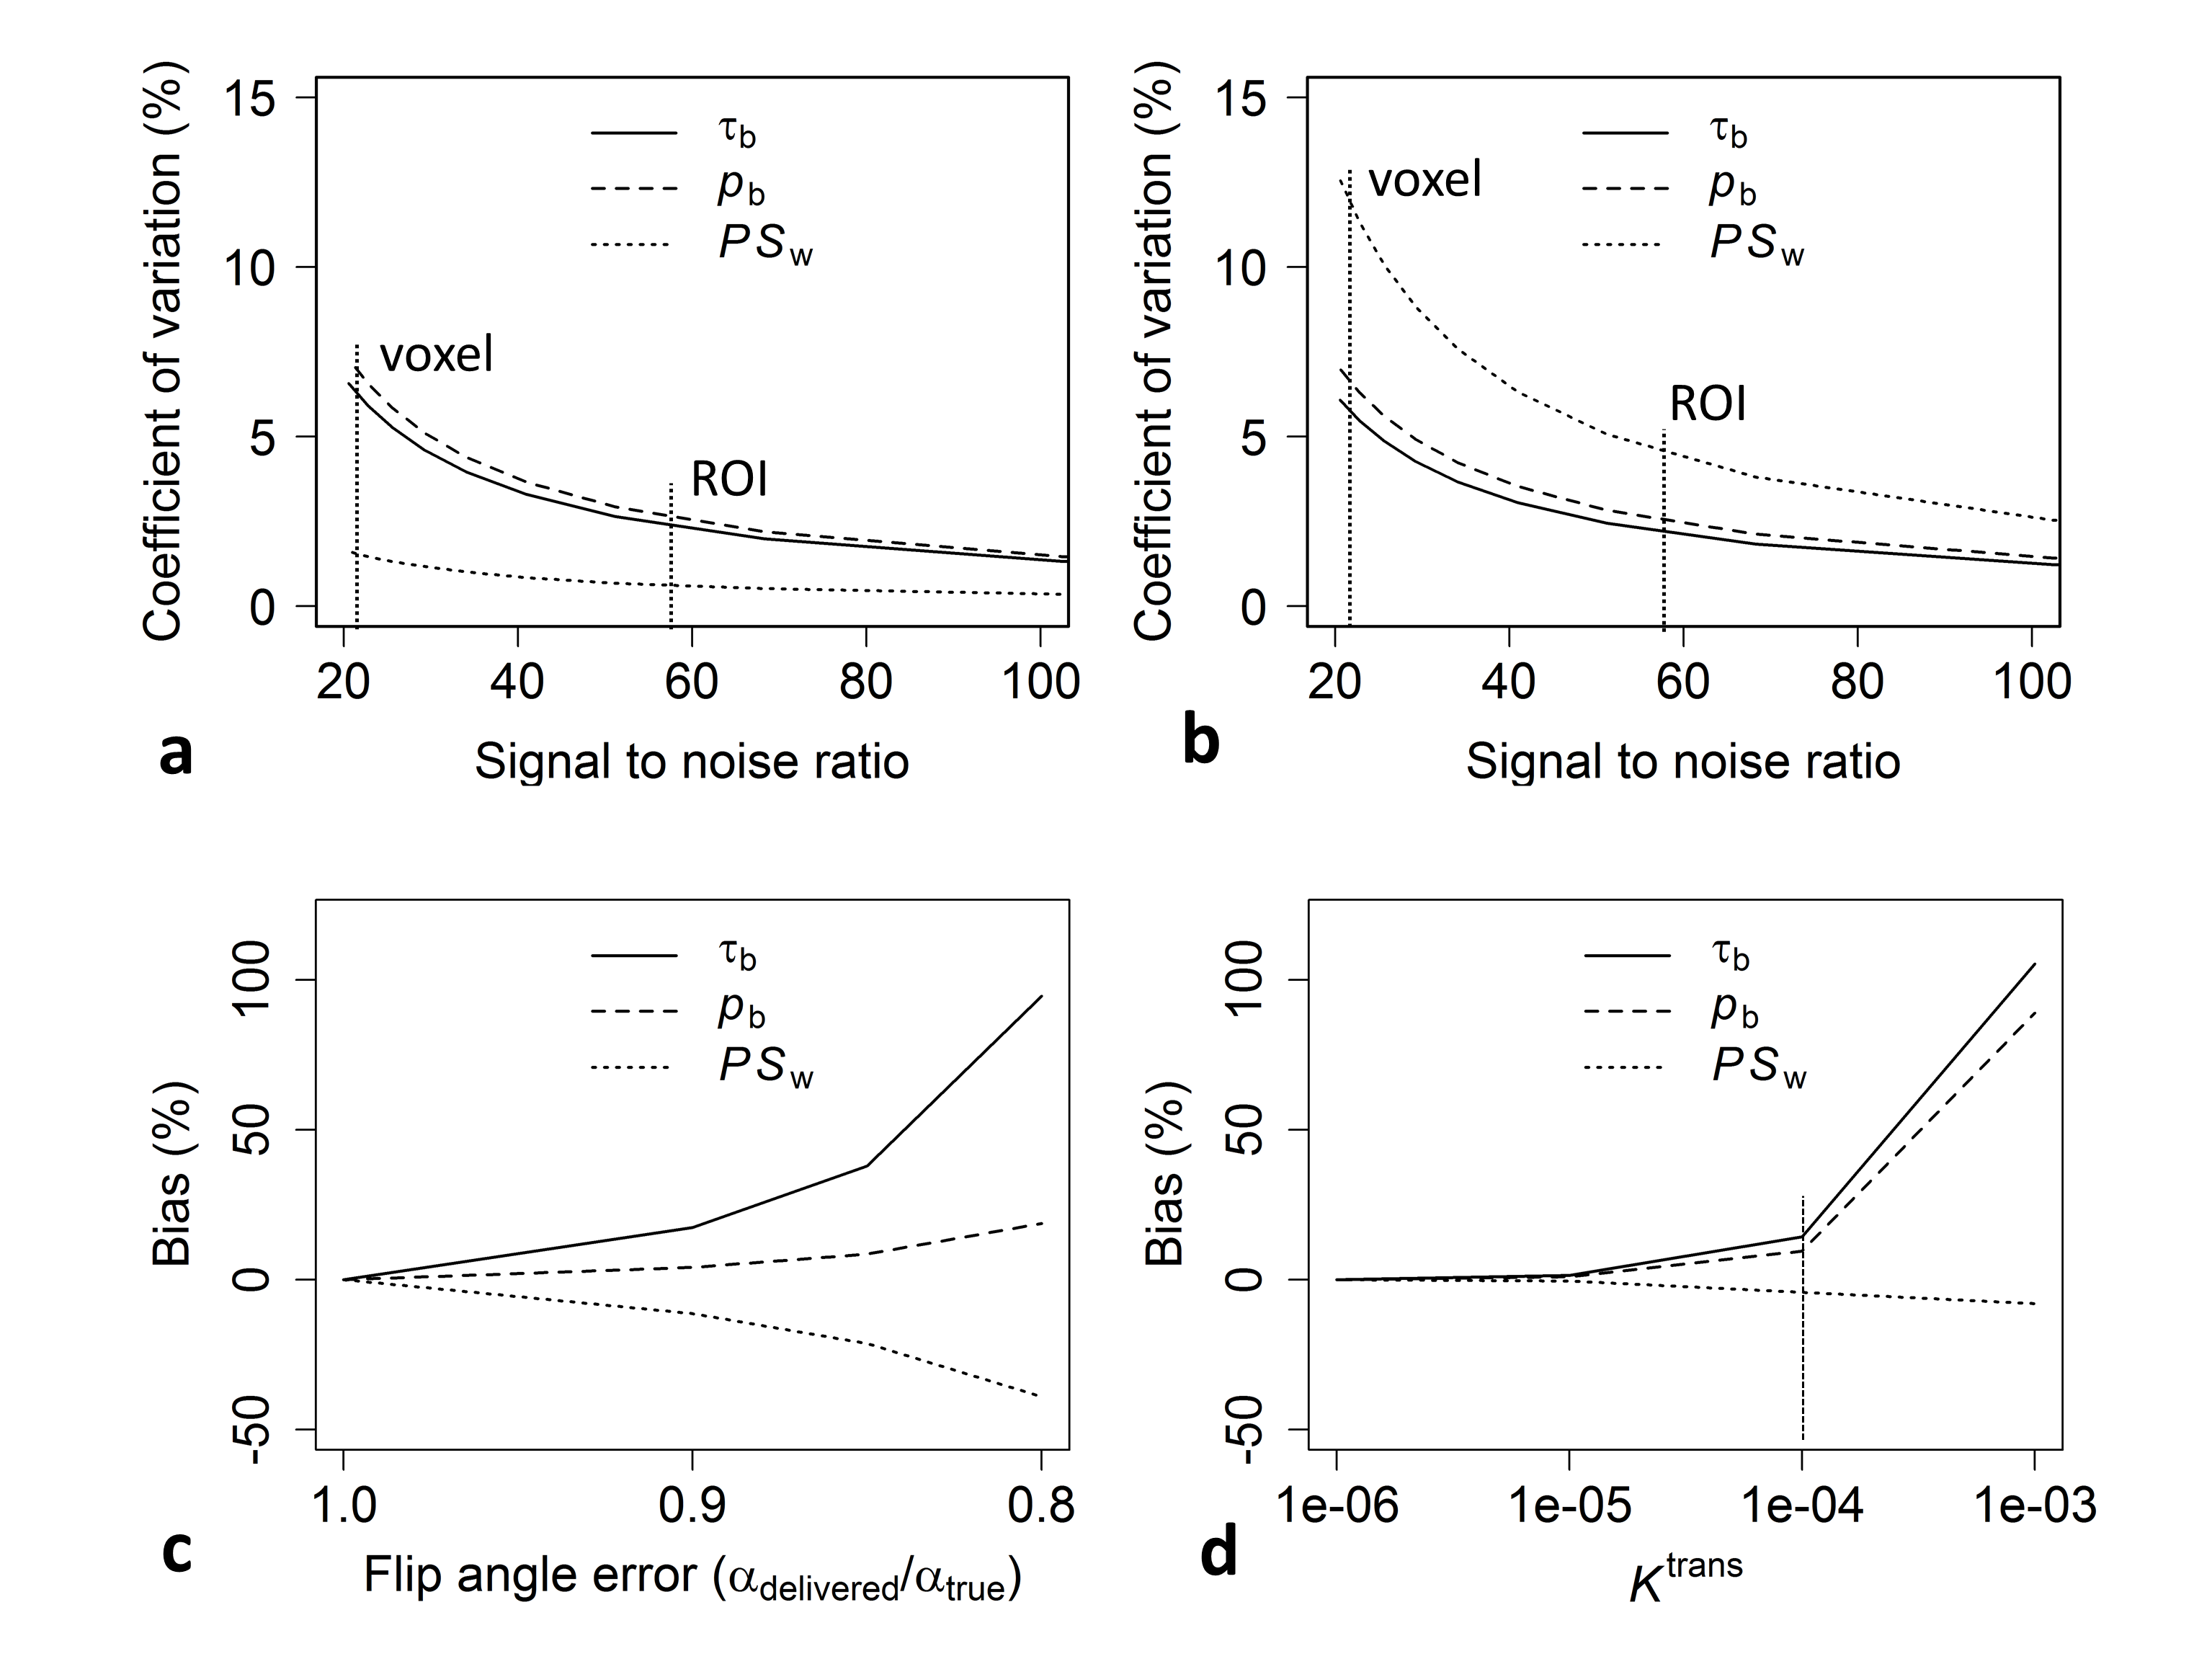
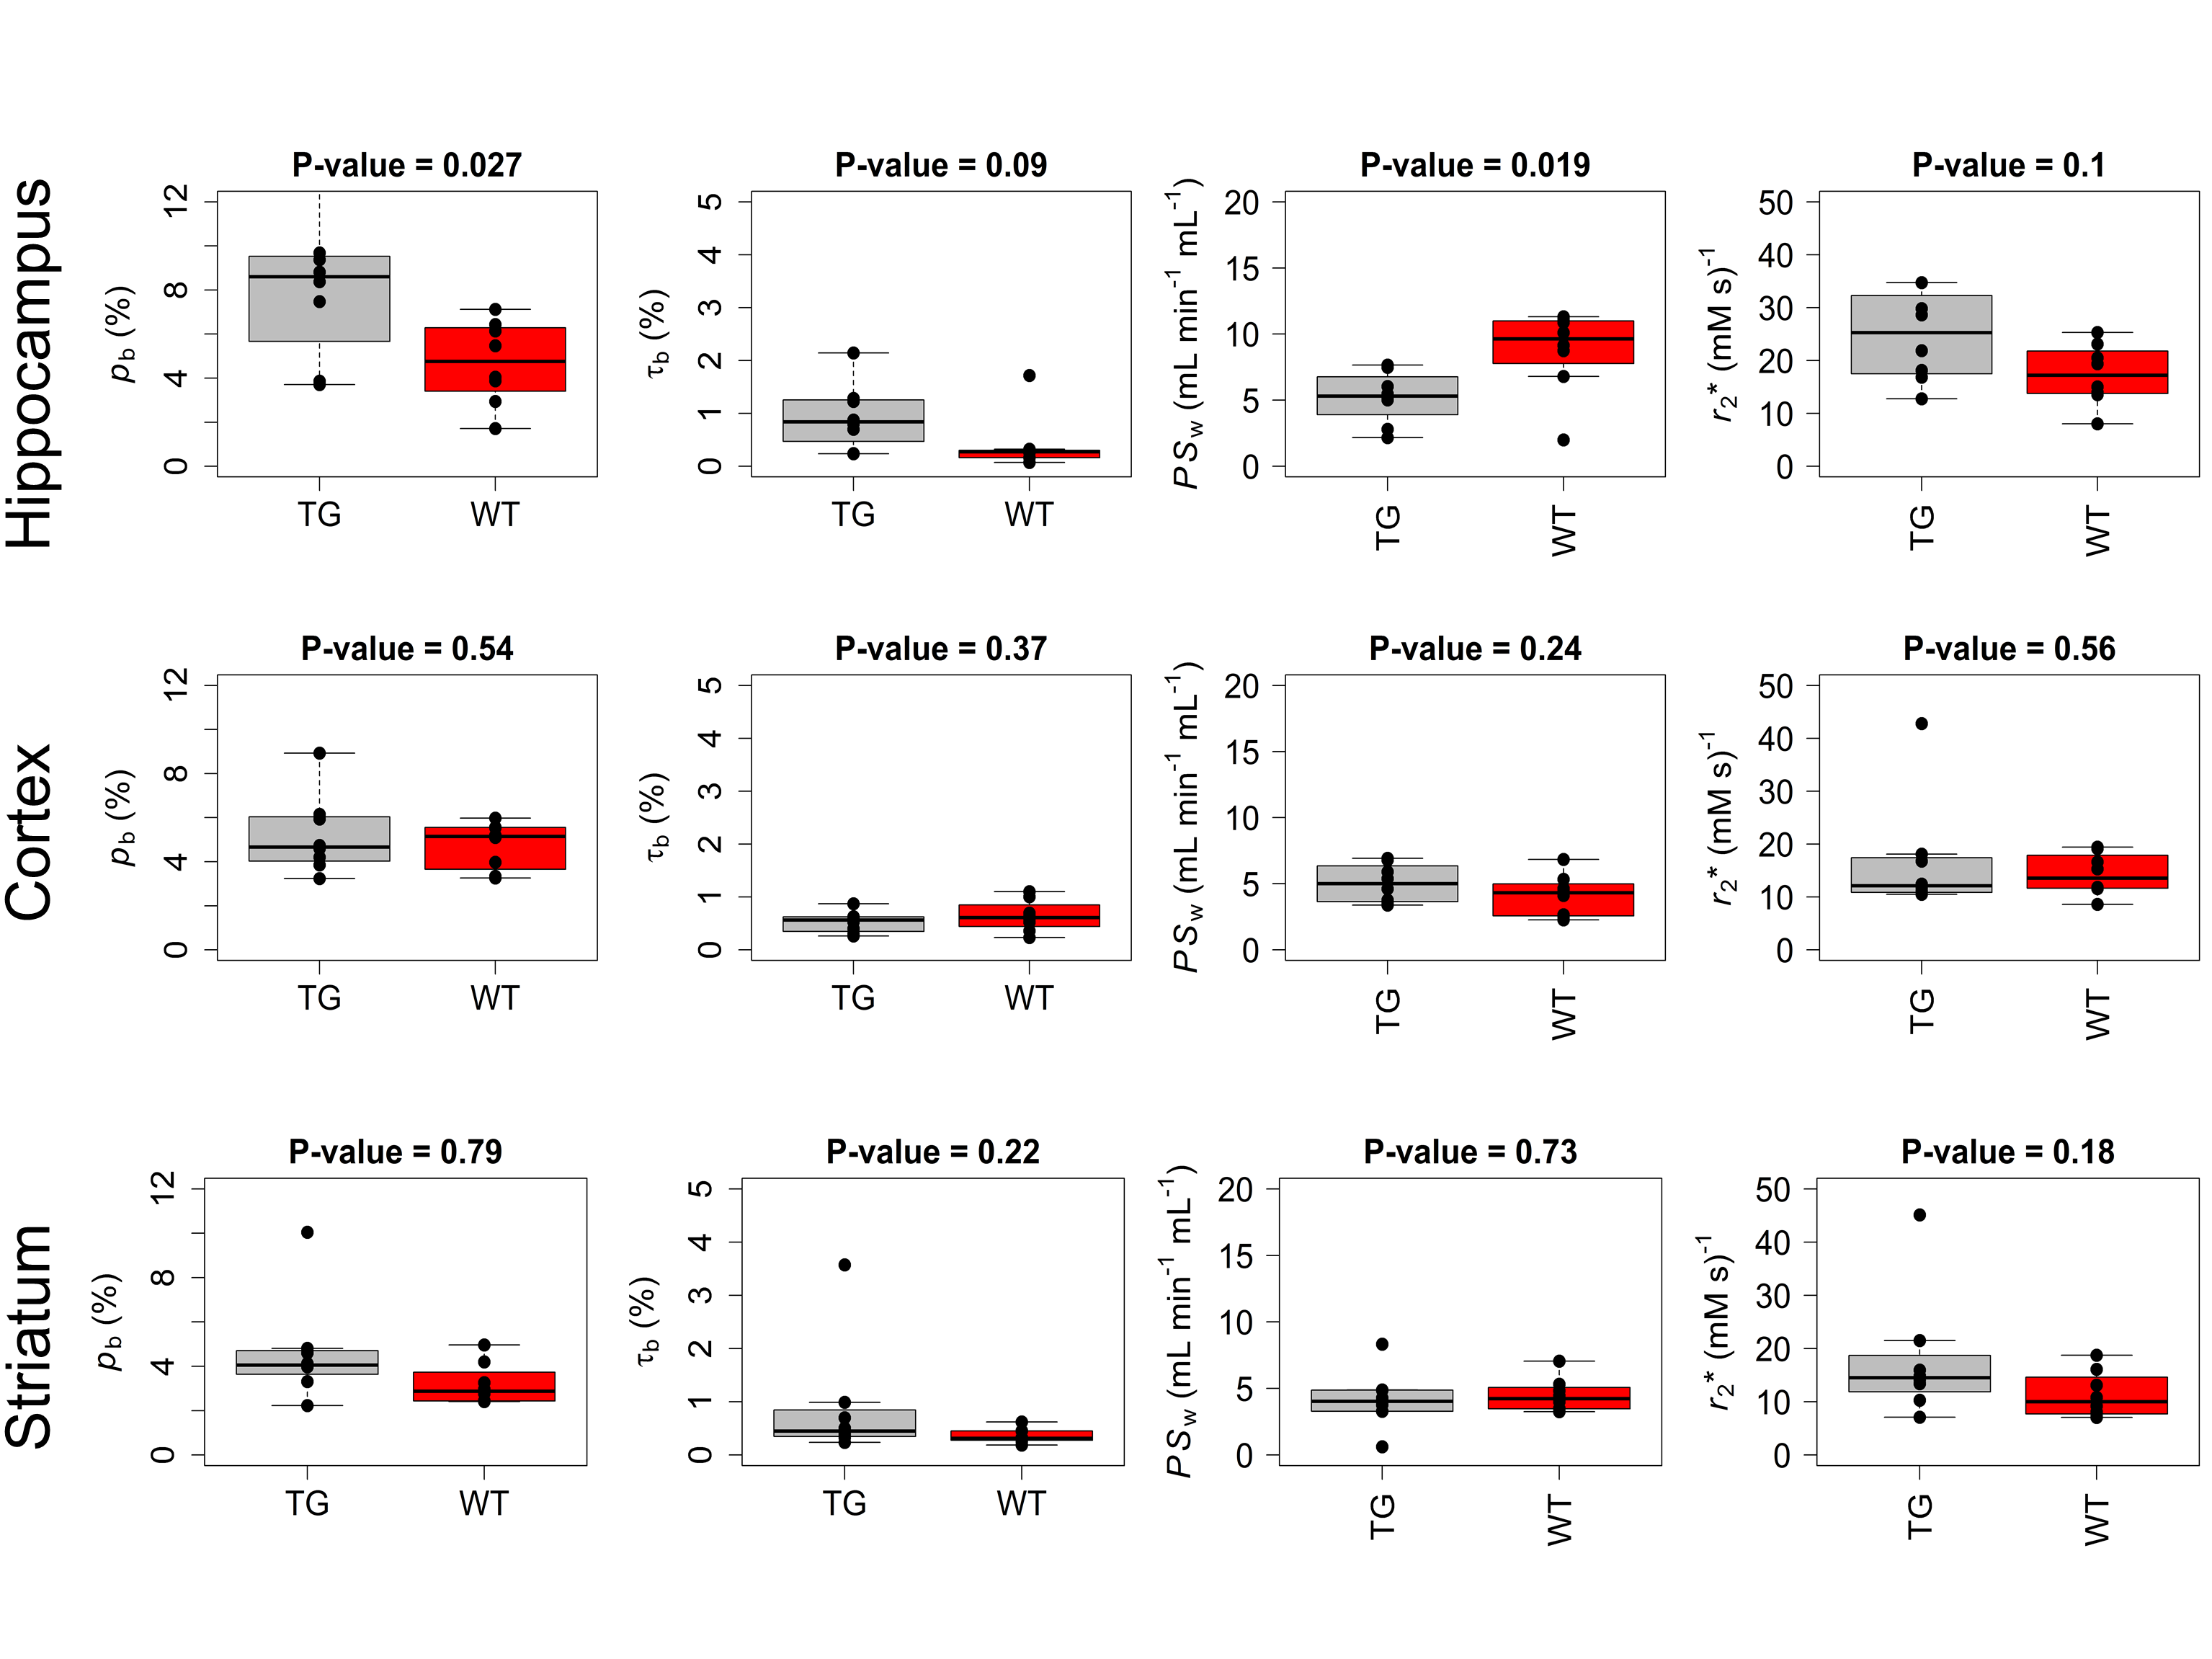
Sensitivity of tissue signal to pb, τb, and PSw, was maximal at the Ernst angle and at long TRs (Figure 3). Parameter estimate coefficient of variation for in-vivo data (both at region of interest and voxel level) was estimated to be less than 15% (Figure 4, top row). Biases in pb, τb, and PSw increased with flip angle error and Ktrans (Figure 4, bottom row). Figure 5 shows parameter estimates in selected brain regions. Transgenic rats showed significantly elevated pb (P = 0.027) and reduced PSw (P = 0.019) in the hippocampus, relative to wild-type controls (Figure 5). No group differences in r2* were observed. Ktrans was < 2 ×10⁻⁴ min-1 in all rats. Estimates of pb were in the range of previously published values for rat brain10. PSw was overestimated by a factor of 1.5-210.Conclusion
Estimates of pb, τb, and PSw were shown to be precise and accurate for sources of error investigated. Decreased PSw in the hippocampus of transgenic rats may reflect a reduction in the number of perivascular aquaporin channels11. Overestimation of PSw relative to published values could be due to animal age (i.e. age-related alterations), however it is possible that other sources of error not investigated in this study are responsible. Further work will aim to correlate PSw with aquaporin-4 expression in the hippocampus.Acknowledgements
Karen Davies for guidance and expertise during pre-clinical scanning. The Engineering and Physical Sciences Research Council for funding (grant EP/M005909/1).References
1. Wardlaw et al. Is breakdown of the blood-brain barrier responsible for lacunar stroke, leukoaraiosis, and dementia? Stroke. 2003 Mar;34(3):806-12
2. Heye et al. Tracer kinetic modelling for DCE-MRI quantification of subtle blood–brain barrier permeability. Neuroimage. 2016. 15;125:446-55
3. Sourbron et al. Bolus-Tracking MRI with a Simultaneous T1- and T2*-Measurement. Magnetic Resonance in Medicine. 2009. 62:672–681
4. Yablonskiy et al. Theory of NMR Signal Behavior in Magnetically Inhomogeneous Tissues: The Static Dephasing Regime. Magnetic Resonance in Medicine. 1994 Dec;32(6):749-63.
5. Cohen et al. A transgenic Alzheimer rat with plaques, tau pathology, behavioral impairment, oligomeric aβ, and frank neuronal loss. J Neurosci. 2013 Apr 10;33(15):6245-56
6. Buckley et al. Cellular-interstitial water exchange and its effect on the determination of contrast agent concentration in vivo: dynamic contrast-enhanced MRI of human internal obturator muscle. Magnetic Resonance in Medicine. 2008 Nov;60(5):1011-9.
7. Landis et al. Equilibrium TranscytolemmalWater-Exchange Kinetics in Skeletal Muscle In Vivo, Magnetic Resonance in Medicine, 1999, 42:467–478
8. Balezeau et al. Mapping of low flip angles in magnetic resonance, Phys Med Biol, 2011, 21;56(20):6635-47.
9. Schwarz et al. A stereotaxic MRI template set for the rat brain with tissue class distribution maps and co-registered anatomical atlas: application to pharmacological MRI. Neuroimage. 2006 Aug 15;32(2):538-50.
10. Schwarzbauer et al. Quantitative Magnetic Resonance Imaging of Capillary Water Permeability and Regional Blood Volume With an Intravascular MR Contrast Agent. Magnetic Resonance in Medicine.1997;37(5):769-77.
11. Wilcock et al. Vascular amyloid alters astrocytic water and potassium channels in mouse models and humans with Alzheimer’s disease, Neuroscience. 2009 Mar 31;159(3):1055-69
Figures