0995
Spin-lock imaging of exogenous exchange-based contrast agents to assess tissue pHZhongliang Zu1, Hua Li1, Xiaoyu Jiang1, and John C Gore1
1Vanderbilt University, Nashville, TN, United States
Synopsis
We measured spin-lock relaxation rates as a function of locking field to quantify tissue pH and the concentration of an exogenous X-ray contrast agent, iohexol, based on chemical exchange effects. Results show that spin-lock imaging can be used to detect exchange-based agents and the effects of tissue acidification.
PURPOSE
Some X-ray contrast agents that are approved for human use contain exchangeable protons that may give rise to exchange-based effects on MRI, including chemical exchange saturation transfer (CEST). However, both the amide and hydroxyl protons in such agents are not in slow exchange with water, so that high powers are required to effectively saturate these groups, resulting in non-specific direct saturation and semi-solid magnetization transfer effects. We have previously shown that spin-lock sequences at high field are also sensitive to chemical exchange1, and can be more suitable for detecting intermediate and fast exchanging groups than CEST. In addition, R1p, the spin-lock relaxation rate obtained by comparing signals at a fixed locking power but at different locking times, is well estimated by linearly adding individual exchange contributions, whereas CEST signals from different exchanging pools have mutual interactions2. Moreover, the variation of R1p with locking power (the R1p dispersion) can be used to estimate exchange parameters and emphasize the effects of protons of a specific exchange rate. Here we demonstrate the ability of spin-lock imaging to detect iohexol in tumor bearing rat brains.METHODS
We adopt the theoretical model of Chopra et al.3 in which $$$R_{1p}=(R_2+\frac{R^\infty_{1p}\omega^2_1}{S^2_p})/(1+\frac{\omega^2_1}{S^2_p})$$$, and Sp, R2, and $$$R^\infty_{1p}$$$ may be regarded as parameters in the fitting of R1p vs. the spin-lock amplitude (w1). In realistic cases,$$$S^2_p \approx k^2_{sw}+\triangle\omega^2_s$$$, where ksw is the exchange rate of protons with chemical shift $$$\triangle\omega_s$$$. An R1p contrast is defined then as $$$\triangle R_{1p}=R_{1p}(low)-R_{1p}(high)$$$ where R1p(low) and R1p(high) are the R1p values acquired with low and high w1. A series of iohexol samples served as test solutions to evaluate the dependence of $$$\triangle R_{1p}$$$ and Sp on pH and concentration. Four samples were made with 30 mM iohexol and pH was titrated to 6.6, 7.0, 7.2, and 7.4, respectively. Three samples were made with 15, 30, and 45 mM iohexol (pH = 7.0), respectively. Four rats bearing 9L tumors were also studied before and after administration of the agent. Spin-lock signals were acquired with locking amplitudes from 100 to 3162 Hz on a 9.4 T Varian small animal scanner. For iohexol administration, spin-lock signals were acquired at different times before and after injection of 2 mL 1.3 M iohexol solution. R1p was calculated for each voxel, and $$$\triangle R_{1p}$$$ was calculated by comparing values at power of 100 and 3162 Hz. Sp was obtained by fitting the R1p dispersion to Chopra’s equation. To increase SNR in fitting Sp, we applied a Gaussian filter to the spin-lock images, averaged all the $$$\triangle R_{1p}$$$ images acquired after injection, and omitted voxels with no significant concentration of agent.RESULTS
Fig. 1 shows the R1p dispersion, $$$\triangle R_{1p}$$$, and Sp for the four iohexol samples for different pH but constant concentration (a, c, and e), and the three iohexol samples for different concentrations but constant pH (b, d, and f). Note that $$$\triangle R_{1p}$$$ is sensitive to concentration, but not pH. In contrast, Sp is sensitive to pH, but not concentration. Fig. 2a shows the time course of the differences of $$$\triangle R_{1p}$$$ values in rat tissues before and after injection. It was found that $$$\triangle R_{1p}$$$ signals in tumors increase quickly after injection and decrease slowly up to 1 h, whereas intact brain showed little change. Fig. 2b, 2c, and 2d shows maps of water longitudinal relaxation rate (R1w) and $$$\triangle R_{1p}$$$ before and at 10 mins after injection. Note that the $$$\triangle R_{1p}$$$ contrast in tumor is enhanced after injection. Sp in tumors was fitted to be 4282 ± 786, 3384 ± 941, 4328 ± 1524, and 4614 ± 356 s-1 for the four rats. By comparing them with Sp in Fig. 1e, this corresponds to an extracellular pH ranging from 6.6 to 7.0. Fig. 3 shows the Sp maps from the four rats.DISCUSSION
It is challenging to separate the effects of agent concentration and exchange rate in CEST. Here, we show that spin lock can be used to derive quantities such as $$$\triangle R_{1p}$$$ and Sp, which depend separately on these two parameters. In the fitting of Sp, although we used a single-pool fit to a two-pool system, the Sp of iohexol should depend on the $$$\triangle\omega_s$$$ and ksw of the two exchanging groups, so the derived value represents a form of average. Fig. 1d and 1f indicate that Sp can provide concentration-independent pH-weighted imaging.CONCLUSION
We show that spin lock can be applied to study the effects of exogenous agents with exchanging groups, and exchange dependent contrast may have some advantages over conventional relaxation agents and CEST.Acknowledgements
No acknowledgement found.References
1. Cobb JG, Xie JP, Li K, et al. Exchange-mediated contrast agents for spin-lock imaging. Magn Reson Med. 2012;67(5): 1427-1433. 2. Zaiss M, Bachert P. Exchange-dependent relaxation in the rotating frame for slow and intermediate exchange - modeling off-resonant spin-lock and chemical exchange saturation transfer. NMR Biomed. 2013;26(5):507-518. 3. Chopra S, McClung RED, Jordan RB. Rotating-frame relaxation rates of solvent molecules in solutions of paramagnetic ions undergoing solvent exchange. J Magn Reson. 1984; 59:361-372.Figures
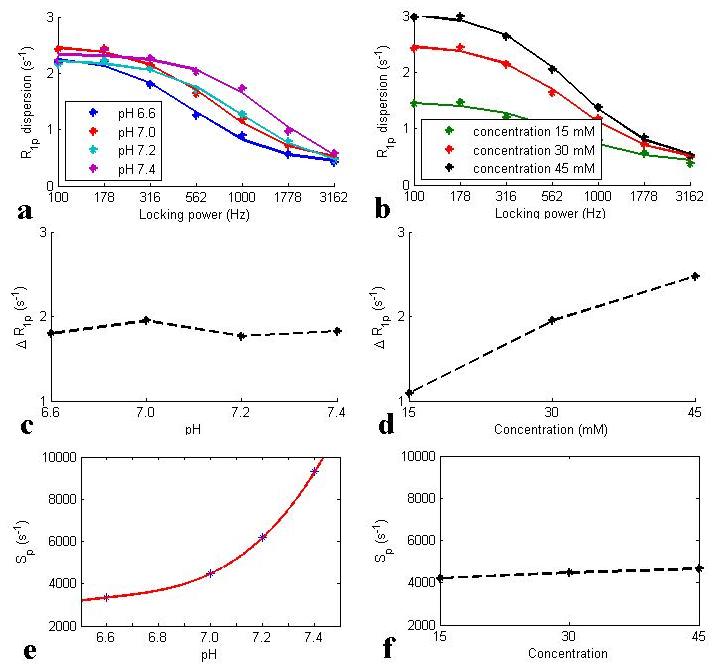
Figure 1: Measured
R1p dispersion, $$$\triangle R_{1p}$$$, and Sp on the four iohexol samples with a
variety of pH but constant agent concentration (a, c, and e) and the three
iohexol samples with a variety of agent concentration but constant pH (b, d,
and f), respectively. Dots in all subfigures are measured data, solid lines in
(a and b) are the fitted curves using Chopra’s model, and the red line in (e)
is the spline interpolation of the measured data.
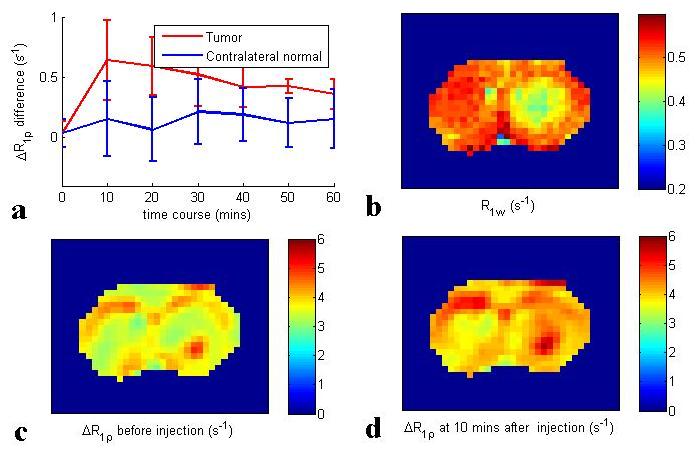
Figure 2: (a) mean time course of $$$\triangle R_{1p}$$$ difference from four
rat brains, (b) R1w map, (c) $$$\triangle R_{1p}$$$ map before injection, and (d) $$$\triangle R_{1p}$$$
map at 10 mins
after injection. Error bars in (a) are the standard deviations across four
subjects.
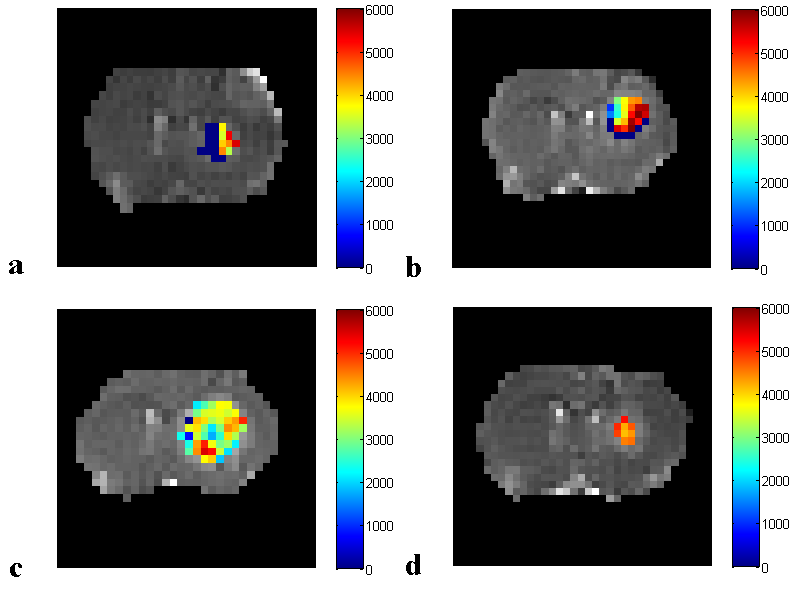
Figure 3: Sp map from the four tumor bearing rat brains. Dark blue represents the omitted
voxels which have no significant concentration of agent ($$$\triangle R_{1p}$$$ difference acquired
with w1 of 100 Hz < 0.3 s-1)