0993
Asymmetries of the balanced SSFP profile allow to probe microstructure anisotropy at 9.4 Tesla1Biomedical Magnetic Resonance, University of Tübingen, Tübingen, Germany, 2Dept. of High-Field Magnetic Resonance, Max Planck Institute for Biological Cybernetics, Tübingen, Germany, 3Graduate Training Centre of Neuroscience, University of Tübingen, Tübingen, Germany
Synopsis
The bSSFP signal profile exhibits tissue-dependent asymmetries that can be used as a novel contrast mechanism and have been hypothesized to relate to the tissue microenvironment. In this work, we investigate this effect at ultra high-field using phase-cycled bSSFP at an isotropic resolution of 1.2 mm. As in the original publication, we also observe strong asymmetries in white matter and a comparison to DTI data reveals that the largest asymmetries occur in white matter tracts oriented orthogonal to the main magnetic field.
Introduction
It has been shown previously that the bSSFP signal profile exhibits tissue-dependent asymmetries that can be used as a novel contrast mechanism and may relate to the tissue microenvironment [1, 2]. The asymmetries are especially strong in white matter and seem to relate to its tract structure [2] and to the spatial anisotropy that locally produces a characteristic and asymmetric pattern of the water frequency distribution [3]. It has also been observed that the extent of the asymmetry is heterogeneous within white matter and that the highest asymmetry is found in tracts oriented perpendicular to the main magnetic field [2]. The focus of this work is to investigate this effect in more detail using bSSFP at ultra high-field.Methods
3D bSSFP phase-cycling data with a 1.2 mm isotropic resolution were acquired at 9.4T on a healthy volunteer (TR = 4 ms, nominal FA = 6°/12°, matrix size = 160x128x80, FoV = 192x154x96 mm3, GRAPPA R=2x2). A custom-built head coil [4] was used for signal transmission/reception (16 transmit / 31 receive channels). 128 dummy pulses were run in combination with a small phase increment (6.66°) in between different phase-cycles to ensure the steady-state condition. A total of 60 phase-cycles were distributed over a range of 400°. The data were frequency corrected on a voxel-wise basis as proposed in [2]. Since only a minor phase drift was observed during the acquisition time of 10 min, phase offsets that overlapped within a modulo range of 360° were averaged (resulting in 54 phase-cycles). bSSFP anisotropy index (AI) maps were calculated from the signal peaks on positive ($$$h_p$$$) and negative ($$$h_n$$$) frequency offsets from the banding according to [2]:
$$AI=\frac{(h_p-h_n)}{(h_p+h_n)}$$
For comparison, a whole-brain DTI dataset was acquired with the same subject on a 3T system (multi-slice EPI, 1.2 mm iso., 64 diffusion directions, b-values: 0 and 1000 s/mm²). DTI data were registered to the bSSFP images.
Results
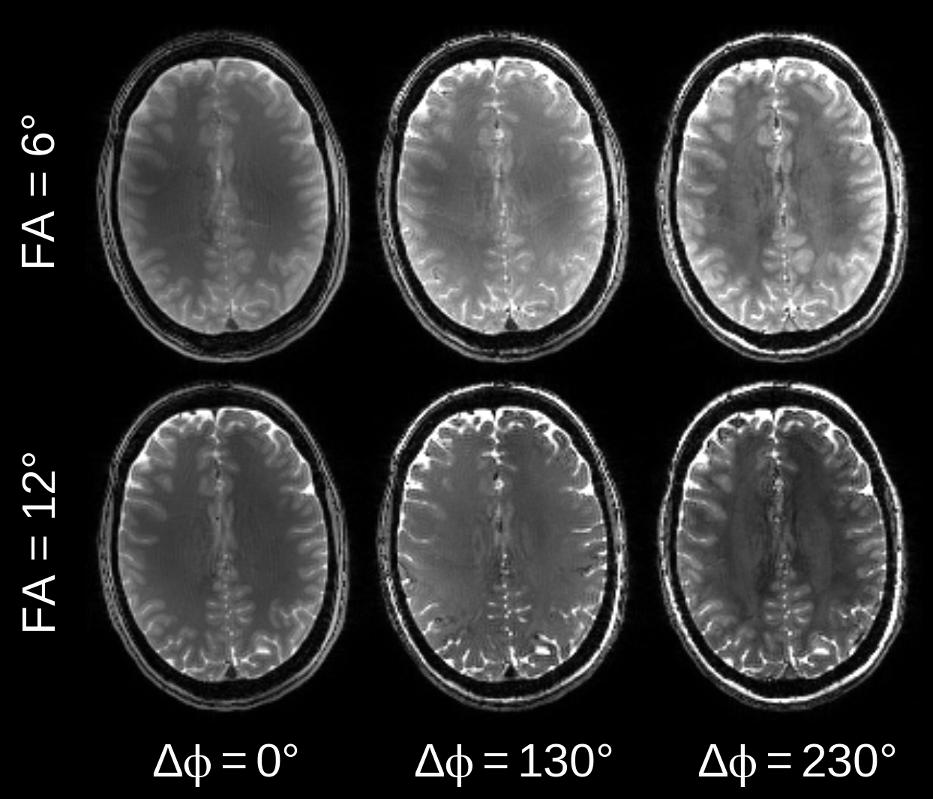
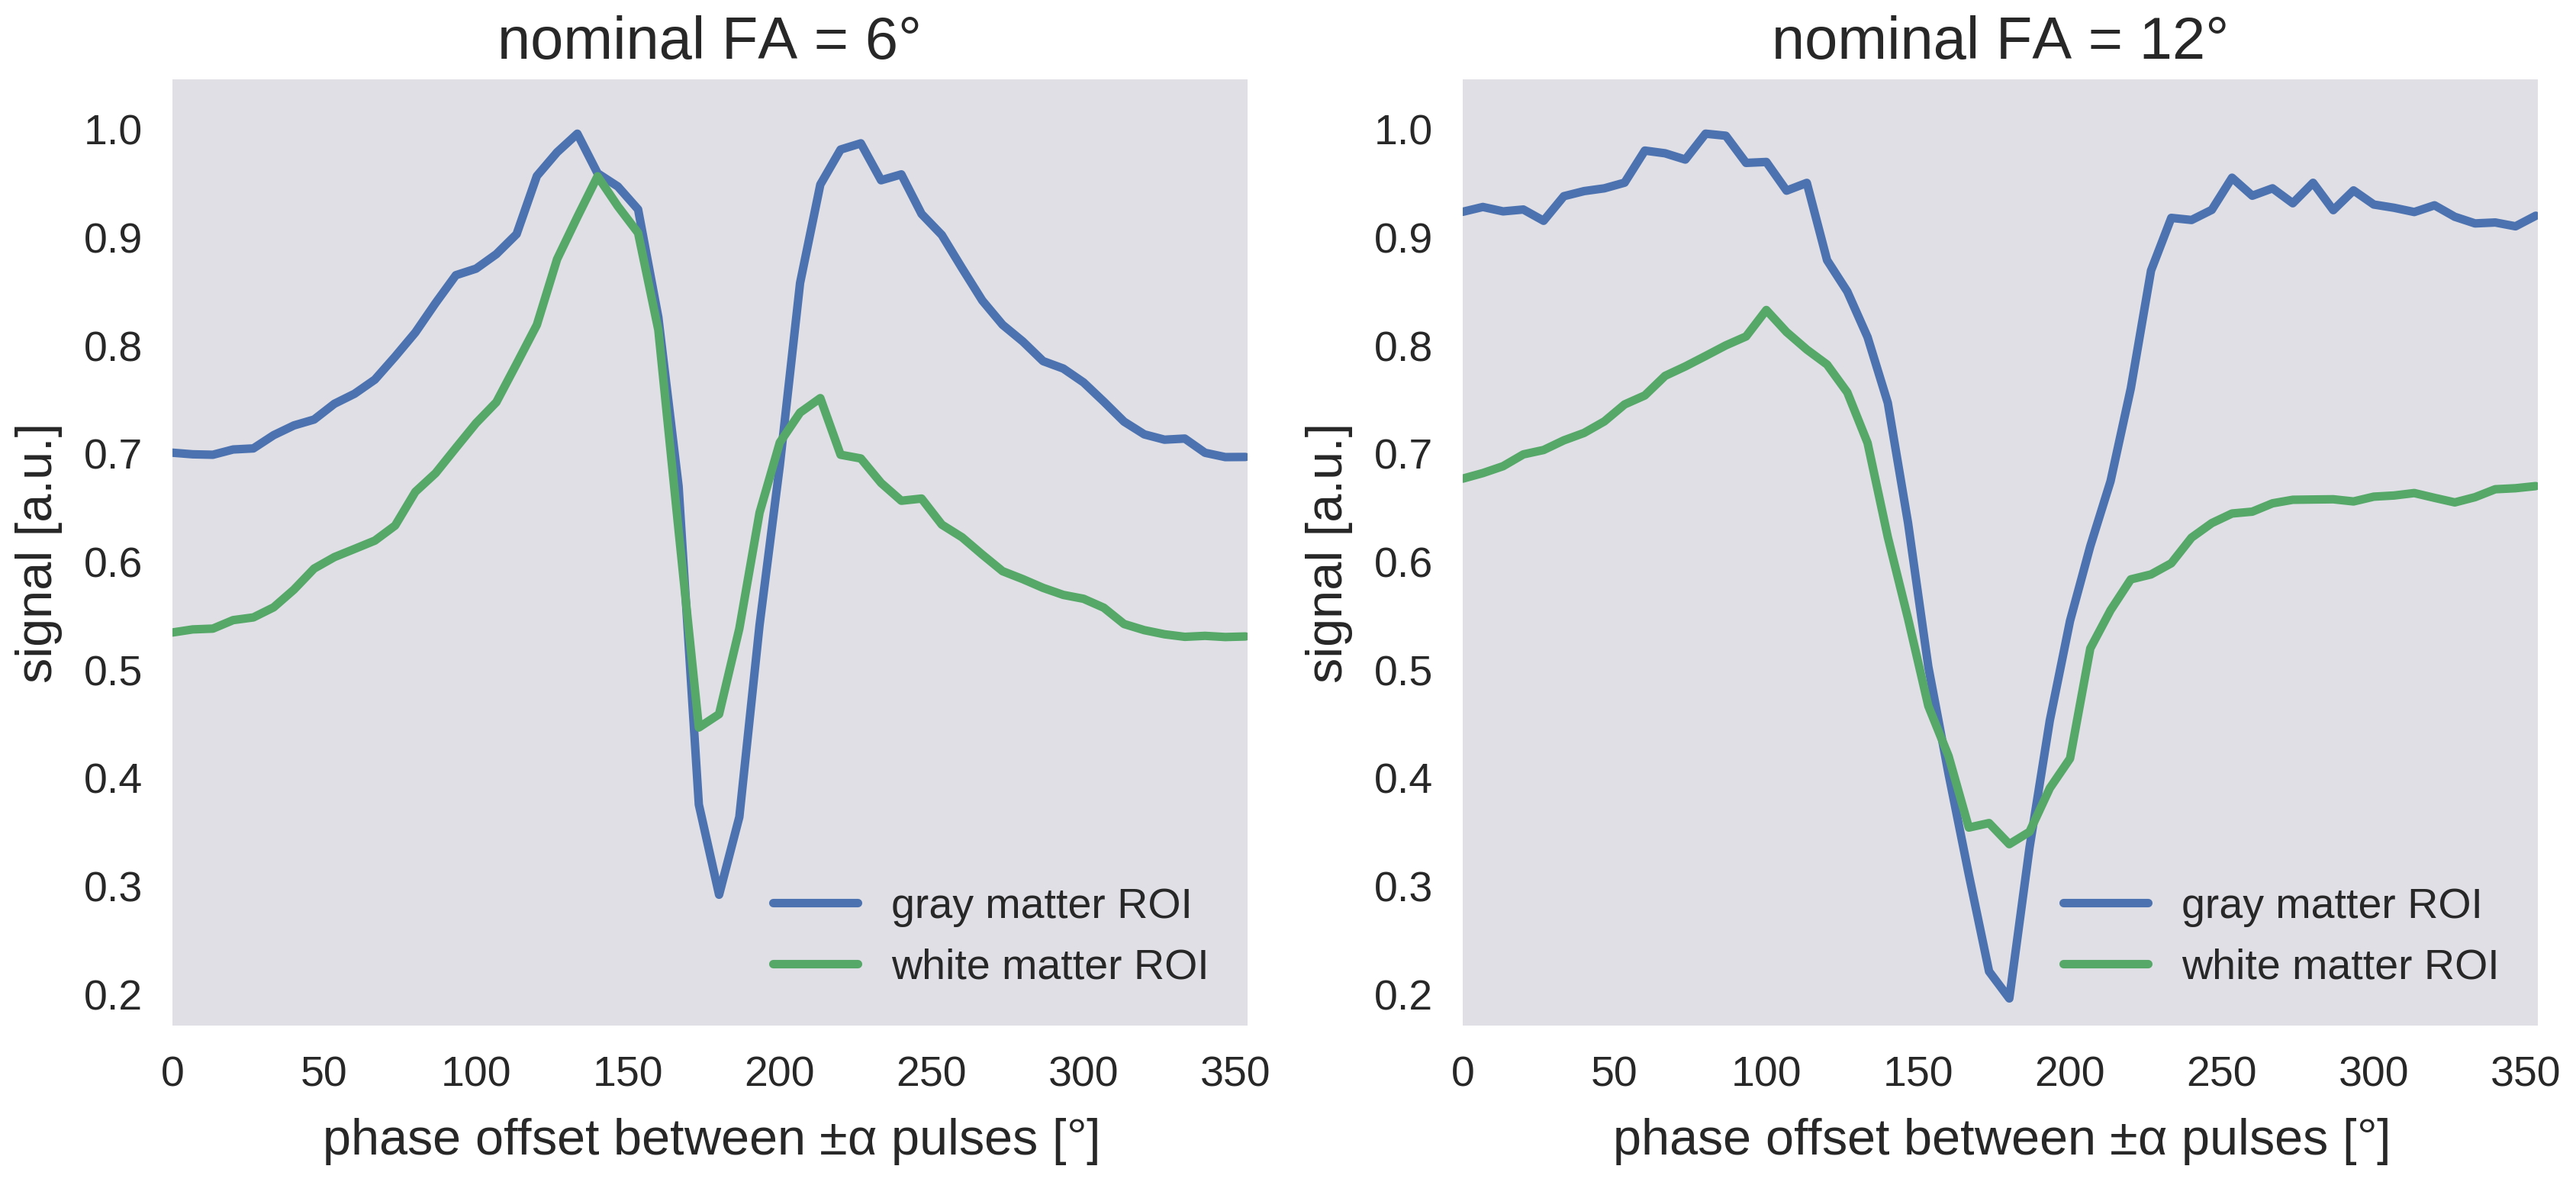
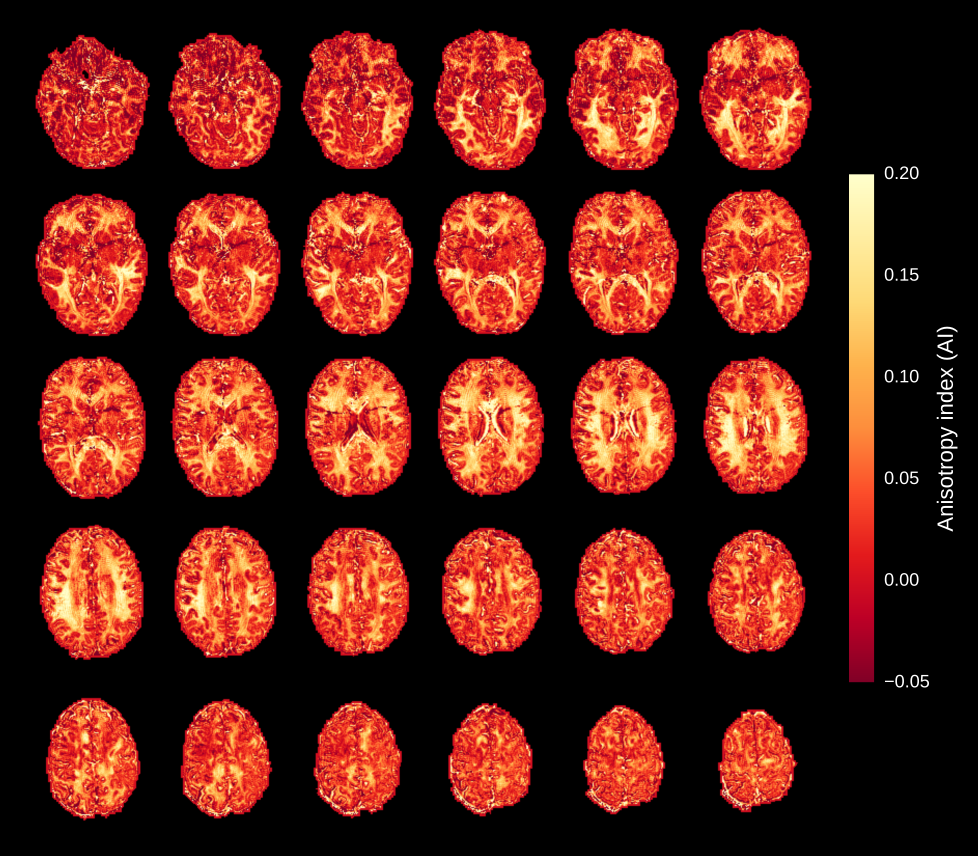
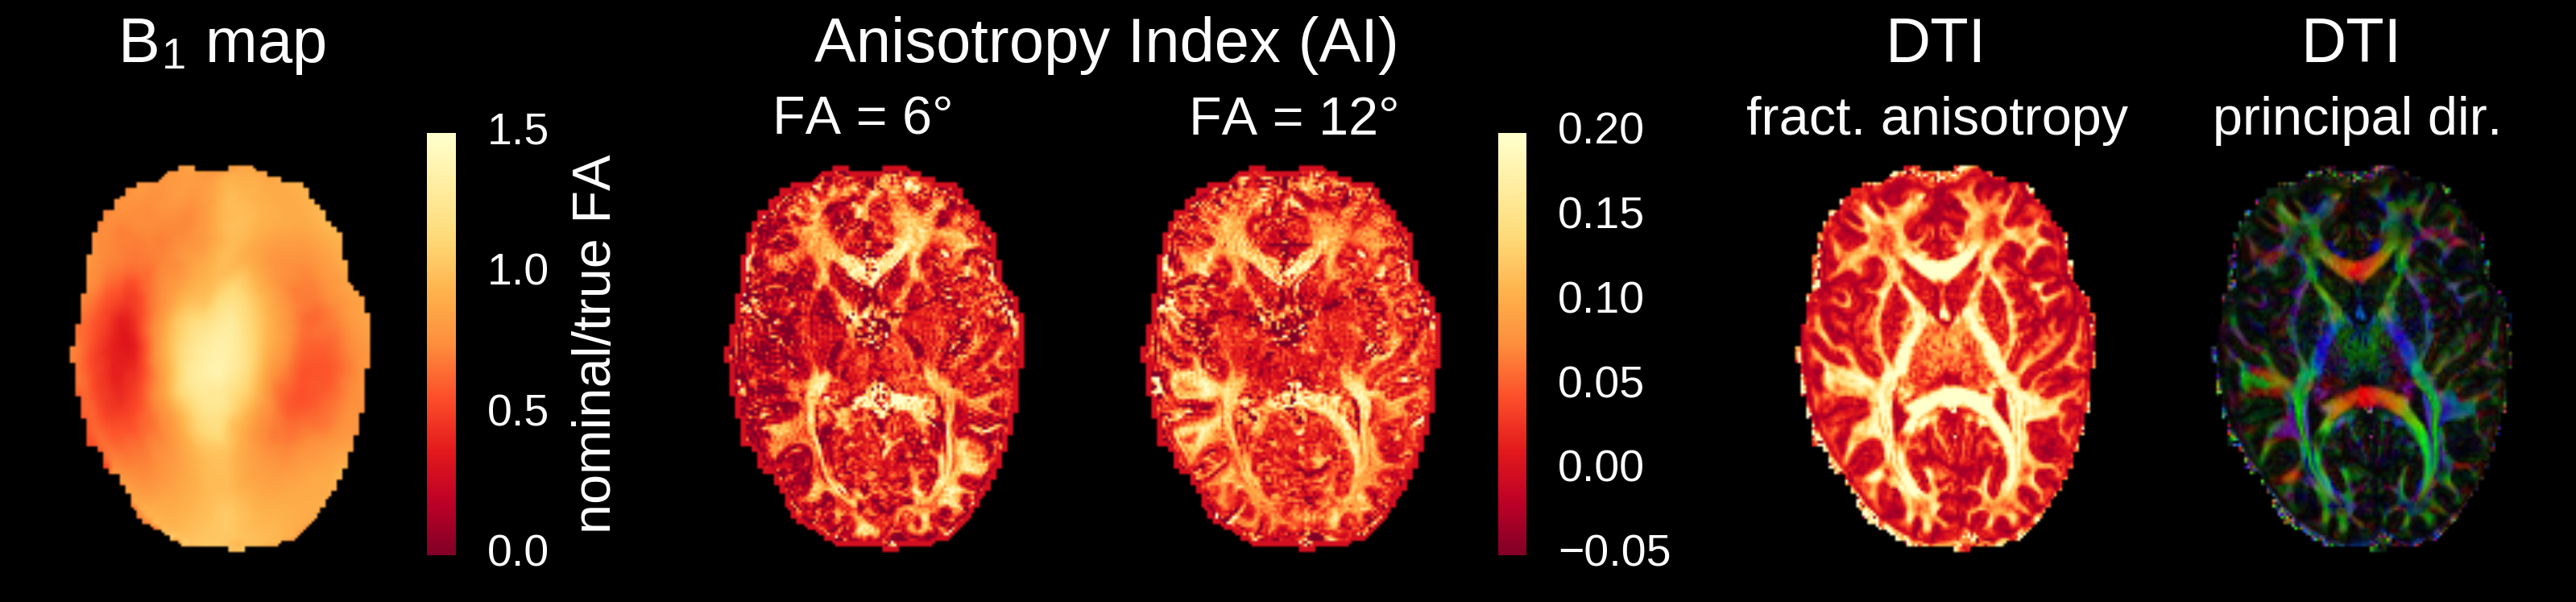
Figure 1 illustrates the frequency-dependent gray-white matter contrast change that is caused by the strong asymmetry of the bSSFP profile in white matter. Depending on the phase offset or the local frequency, the gray-white matter contrast either decreases or increases. Measured bSSFP signal profiles for gray and white matter ROIs are shown in Figure 2. Anisotropy index maps for 30 exemplary slices (out of 80) are displayed in Figure 3. A single-slice comparison of the bSSFP anisotropy index maps with DTI fractional anisotropy and the principal diffusion direction is shown in Figure 4. White matter anisotropy appears to be smaller in the center of the slice where the principal diffusion direction is mostly parallel to the main magnetic field (inferior-superior direction, depicted in blue).Discussion & Conclusion
The observed bSSFP profile asymmetries are similar to observations from a previous publication [2]: Strong asymmetries are observed in white matter, and a comparison to DTI data reveals that the largest asymmetries occur in white matter tracts oriented orthogonal to the main magnetic field. Although the shape of the bSSFP profile highly depends on the flip angle, the measured anisotropy indices were relatively similar for the two flip angles examined (Fig. 4). Followup experiments with a larger range of flip angles are required in order to determine the optimal flip angle for anisotropy measurements. CNR and reliability may also be improved by obtaining the anisotropy metric from a parametric fit to the profile instead of from two data points (the two peaks). There are also several opportunities to reduce the overall acquisition time: Since adjacent profiles are similar and the shape of the profiles are smooth, techniques such as sparse sampling or compressed sensing have the potential to speed-up the acquisition. Furthermore, future work will focus on deriving the local frequency distribution that is responsible for the asymmetry by deconvolution of the measured profile with a symmetrized version of it. Ultimately, it may be possible to infer characteristic properties of white matter from the data such as nerve bundle diameter distribution and bundle density.Acknowledgements
No acknowledgement found.References
1. Miller KL. Asymmetries of the balanced SSFP profile. Part I: theory and observation. Magn Reson Med 2010; 63:385–95
2. Miller KL. Asymmetries of the balanced SSFP profile. Part II: white matter. Magn Reson Med 2010; 63:385–95.
3. Chen WC, Foxley S, Miller KL. Detecting microstructural properties of white matter based on compartmentalization of magnetic susceptibility. NeuroImage. 2013; 70:1-9.
4. G Shajan, Kozlov M, Hoffmann J, Turner R, Scheffler K, Pohmann R. A 16-channel dual-row transmit array in combination with a 31-element receive array for human brain imaging at 9.4 T. Magn Reson Med 2014; 71:870-79.
Figures