0992
On the decay of SSFP configurations1Radiological Physics, University of Basel Hospital, Basel, Switzerland, 2Department of Biomedical Engineering, University of Basel, Basel, Switzerland, 3Department of Diagnostic Radiology, Klinikum rechts der Isar, Technical University Munich, Munich, Germany
Synopsis
In this work, we explore the decay of negative and positive steady state configurations as a mean to assess the tissue microstructure. Steady state configurations are retrieved up to a high order from an exhaustive sampling of the frequency response profile of low-angle balanced SSFP scans. Subsequently, the decay of configurations (termed DECO) is analyzed using a single-pole matrix pencil analysis yielding positive and negative DECO images. Any asymmetry in the configuration decay is directly linked to asymmetric frequency content within a voxel and is captured in the DECO difference image.
Purpose
The aim of this work is to explore steady state configuration imaging to investigate tissue microstructure. To this end, we propose to sample the frequency response of balanced SSFP (bSSFP) for subsequent imaging and analysis of the "decay of configurations", termed DECO
Theory
Here we make use of a seminal concept for motion-insensitive SSFP imaging introduced by Zur et al. in 1990 [1]. To this end, we acquired a series of N = 360 two-dimensional bSSFP images with different RF phase increments $$$\varphi_j = j$$$ [°] (for $$$j = 0, 1, ... N-1$$$). SSFP configurations or modes can then be retrieved from a $$$N$$$-point discrete Fourier transform of the sampled bSSFP frequency response for subsequent DECO image analysis.
Generally, the decay of positive and negative configurations follows, with increasing order $$$n$$$, a complex exponential behavior and the magnetization can be expressed as a sum over all configurations (cf. Eq. [11] by Ganter [2]) that reads for a centered echo:
$$M=E_2^{1/2}e^{i\left\langle\vartheta\right\rangle/2}\sum_{n=0}^{\infty}\left[\hat{p}\left(n+\frac{1}{2}\right)e^{in\left\langle\vartheta\right\rangle}+\frac{\Lambda}{E_2}\hat{p}\left(-\frac{1}{2}-n\right)e^{-i(n+1)\left\langle\vartheta\right\rangle}\right](-A)^nM^{(0)}$$
with the usual definition of $$$E_i \doteq \exp\left(-{\rm TR}/T_i\right)$$$ and
$$A=\frac{(a+b)/2}{a-\Lambda(a-b)/2}E_2$$$$M^{(0)}\doteq-i \frac{1-E_1}{a+b\Lambda}\sin\alpha$$$$\Lambda\doteq\frac{1}{a-b}\left[ a-E_2^2b-\sqrt{\left(a^2-E_2^2b^2\right)\left(1-E_2^2\right)} \right]$$$$a\doteq 1-E_1\cos\alpha\qquad b\doteq\cos\alpha-E_1$$
and where $$$\vartheta$$$ is the phase accumulated within one TR interval, distributed around some mean value $$$\left\langle\vartheta\right\rangle$$$ with probability density $$$p\left(\vartheta - \left\langle\vartheta\right\rangle\right)$$$ and associated characteristic function
$$\hat{p}(k) = \int_{-\infty}^{\infty} e^{ikx}p(x){\rm d}x$$
It is interesting here to note
that for a homogeneous probe with a symmetric
frequency distribution,
the decay of both positive and negative configurations has the same
characteristic time constant.
Methods
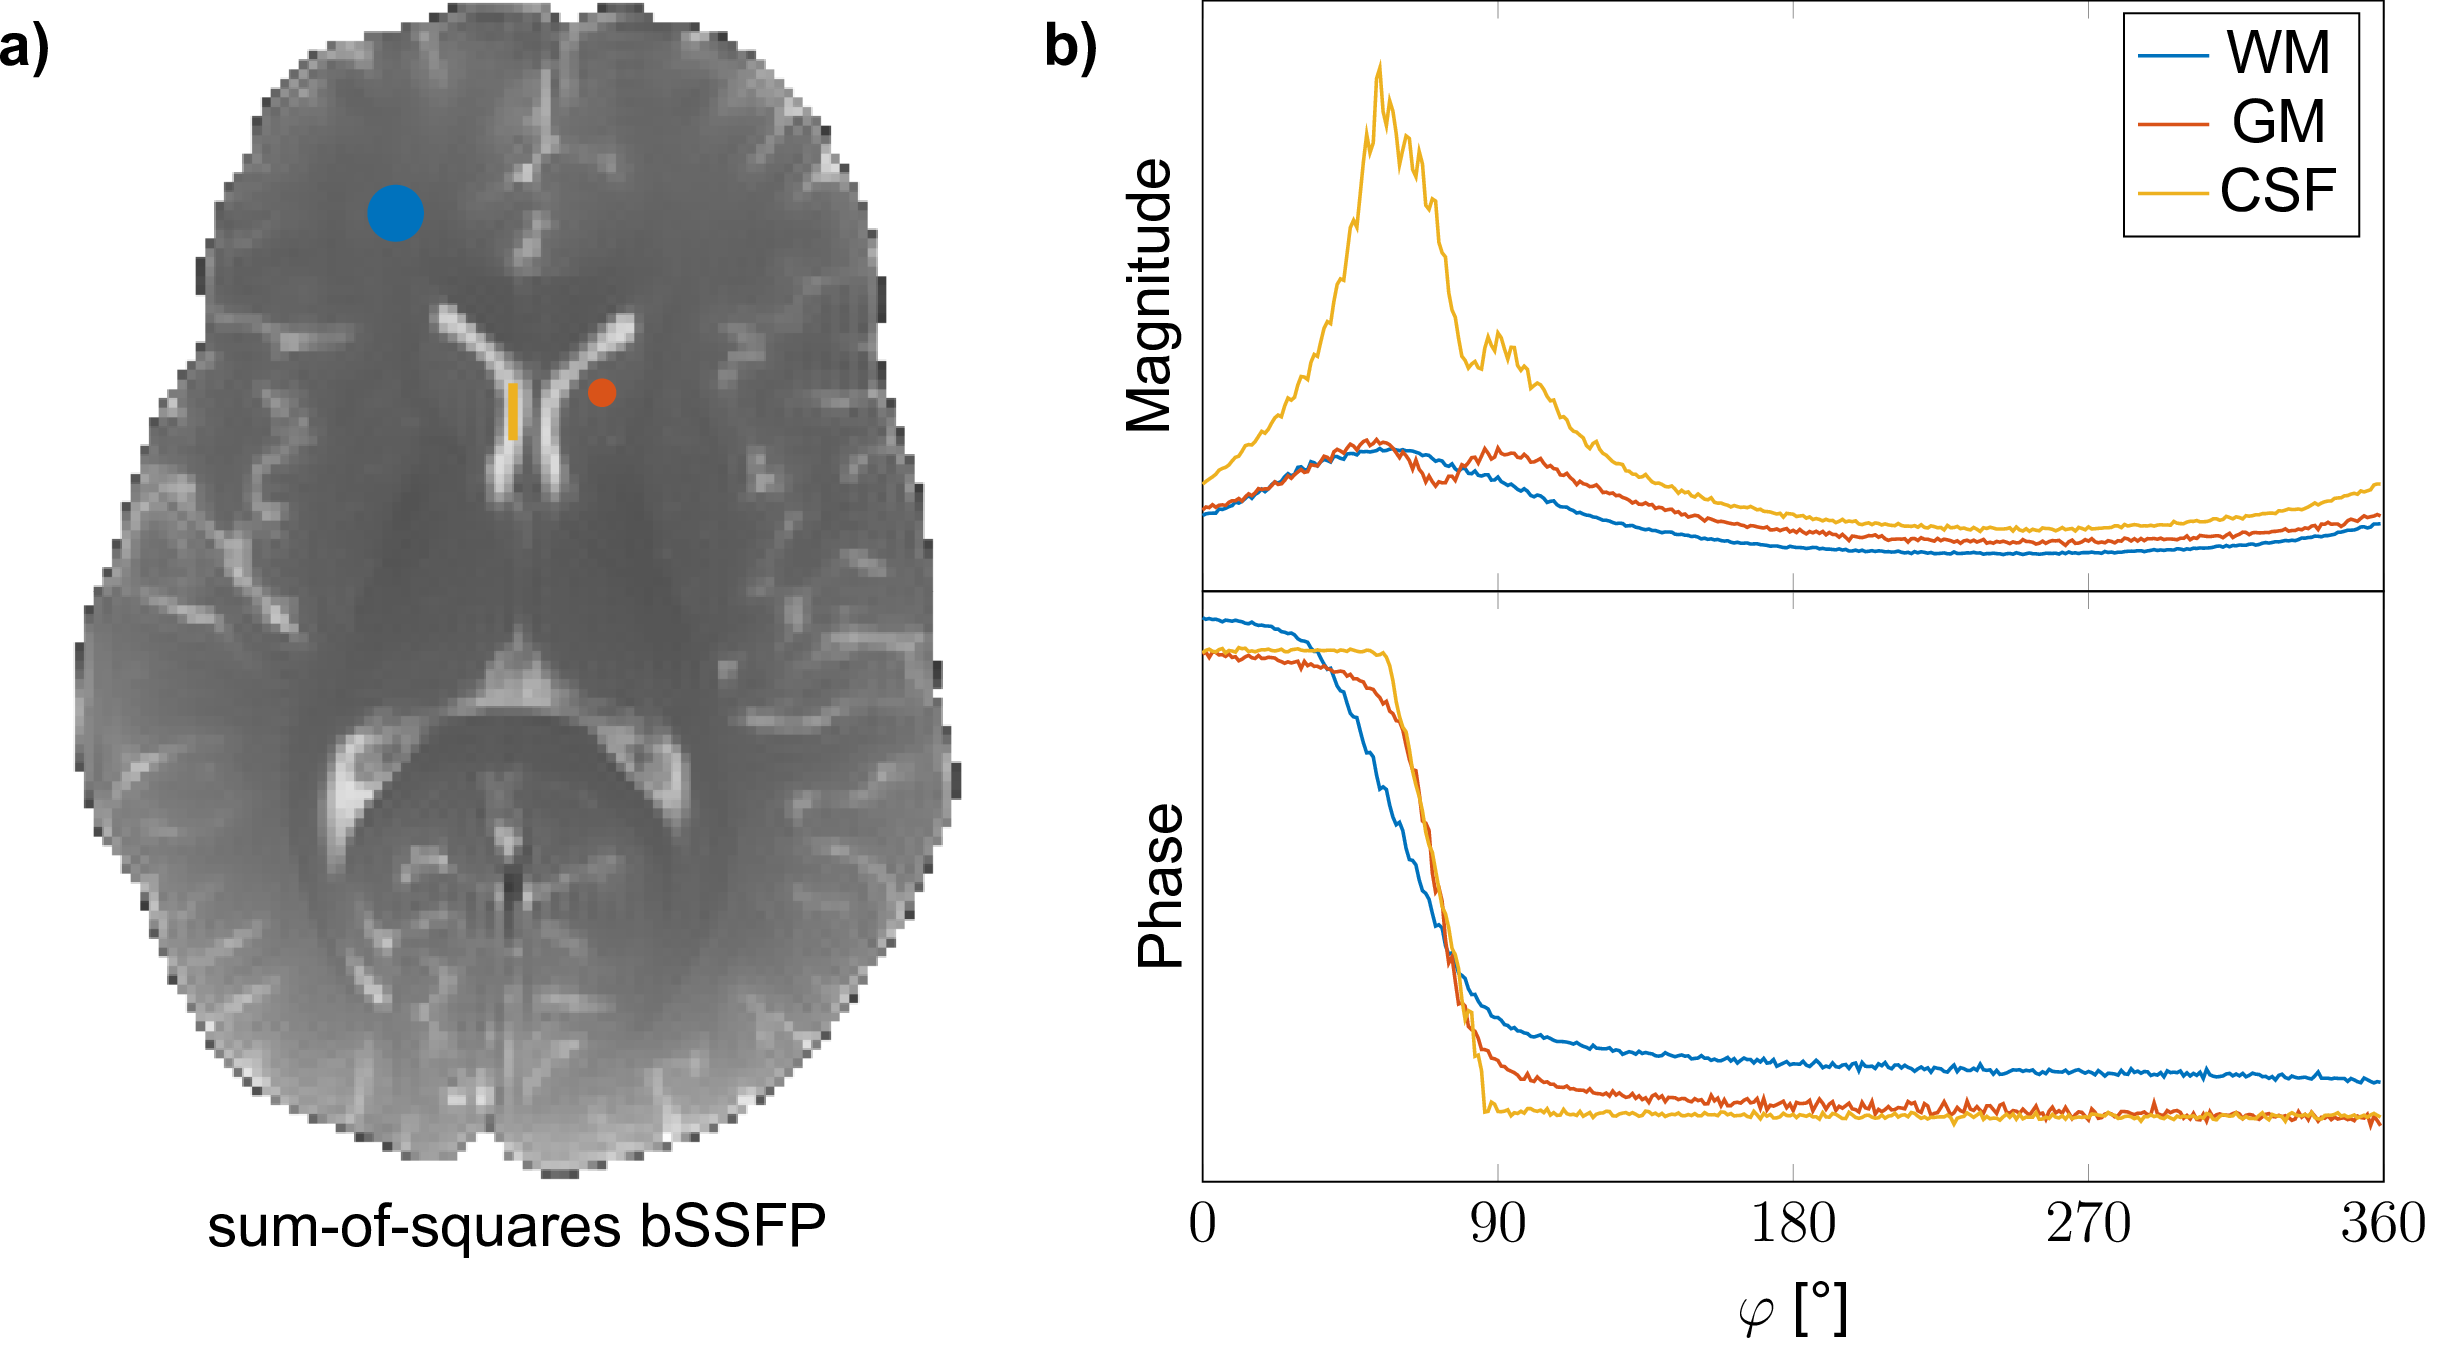
Imaging with bSSFP was performed at 3T (Siemens MAGNETOM Prisma) using a TR / TE of 5.6 / 2.8 ms, a flip angle of 5°, a matrix size of 192x192 and a resolution of 1x1mm2 (5 mm slice thickness); yielding an overall scan time of approximately 6:30 min. Scans were performed on a healthy volunteer after informed written consent was obtained. Region-of-interest (ROI) evaluation was performed for three tissue types (Figure 1a), specifically frontal white matter (WM), caudate nucleus grey matter (GM) and cerebrospinal fluid (CSF) from the left lateral ventricle. The decay rate of the configurations was estimated using a matrix-pencil approach [3] assuming a single pole.Results
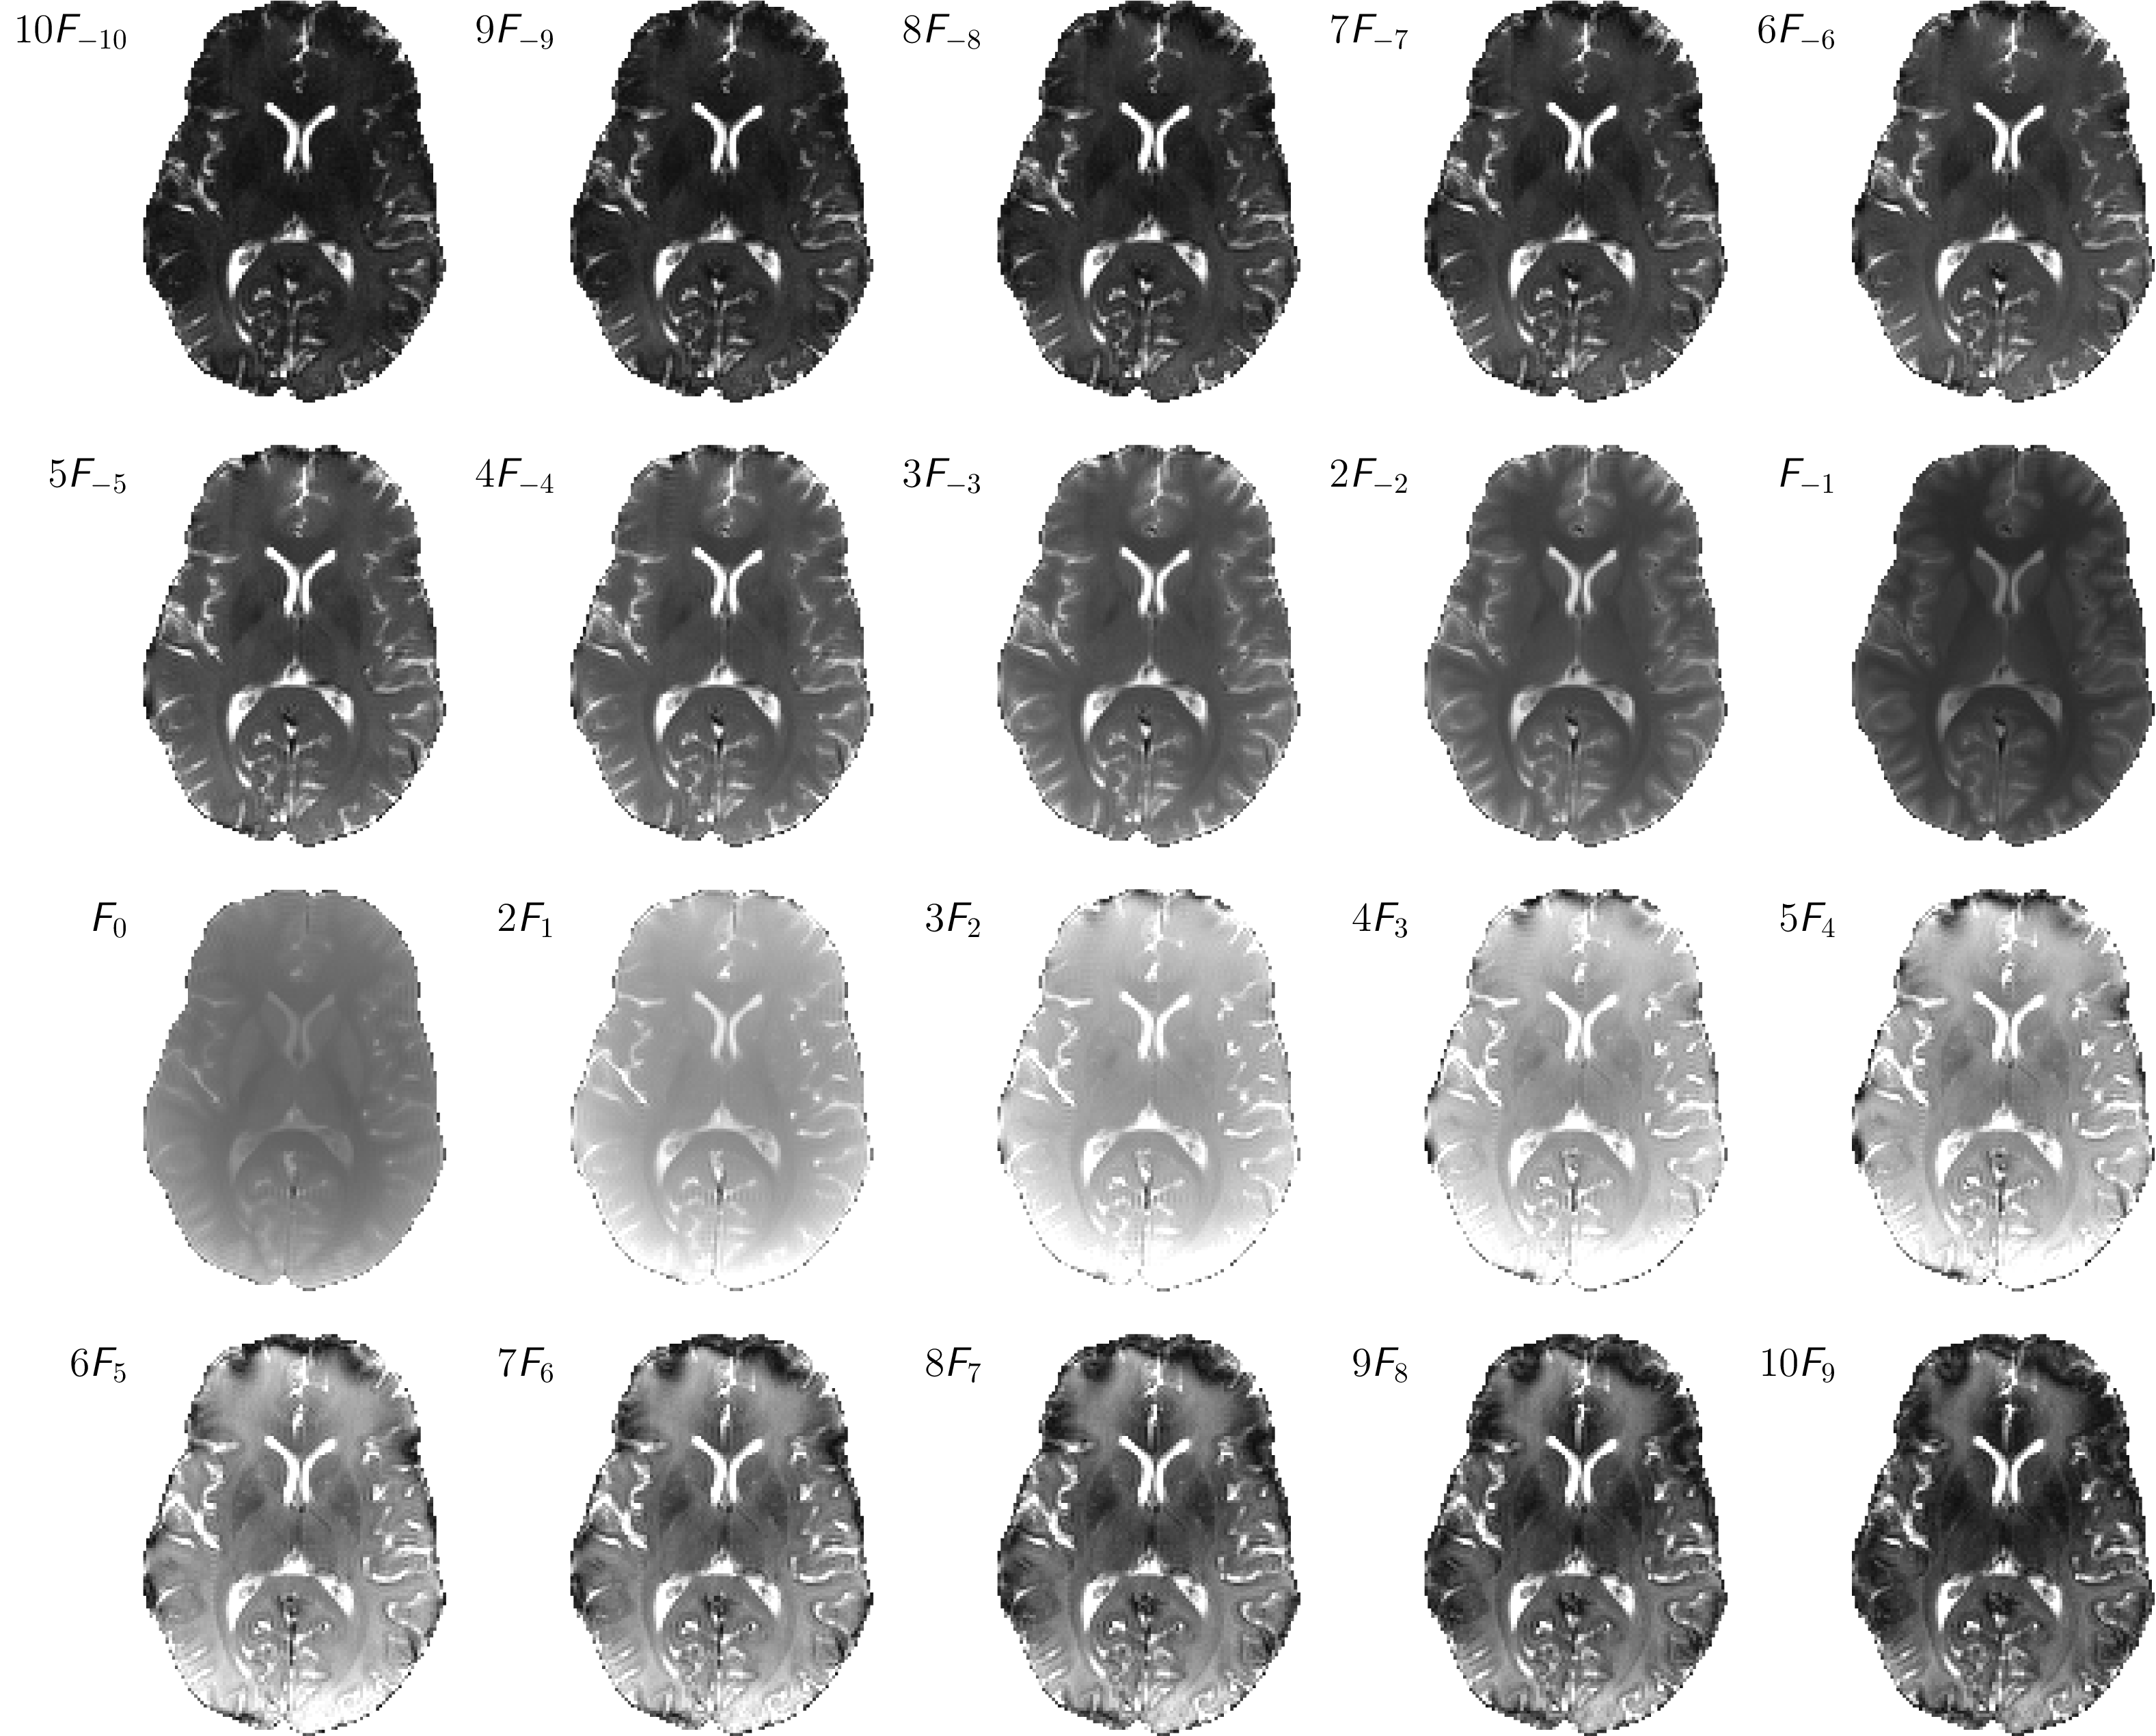
A sum-of-squares bSSFP image and the sampled complex frequency response for WM, GM and CSF are shown in Figure 1. From the image frequency-series, corresponding configuration images are derived and displayed in Figure 2 for configuration orders up to $$$\lvert n\rvert = 10$$$. Overall excellent image quality is achieved, and due to the low flip angle used, configurations can be traced to orders $$$\lvert n\rvert \gg 1$$$. Note that some susceptibility artifacts appear in the frontal part of the brain; especially for higher order positive modes, in contrast to negative modes where partial refocusing occurs.
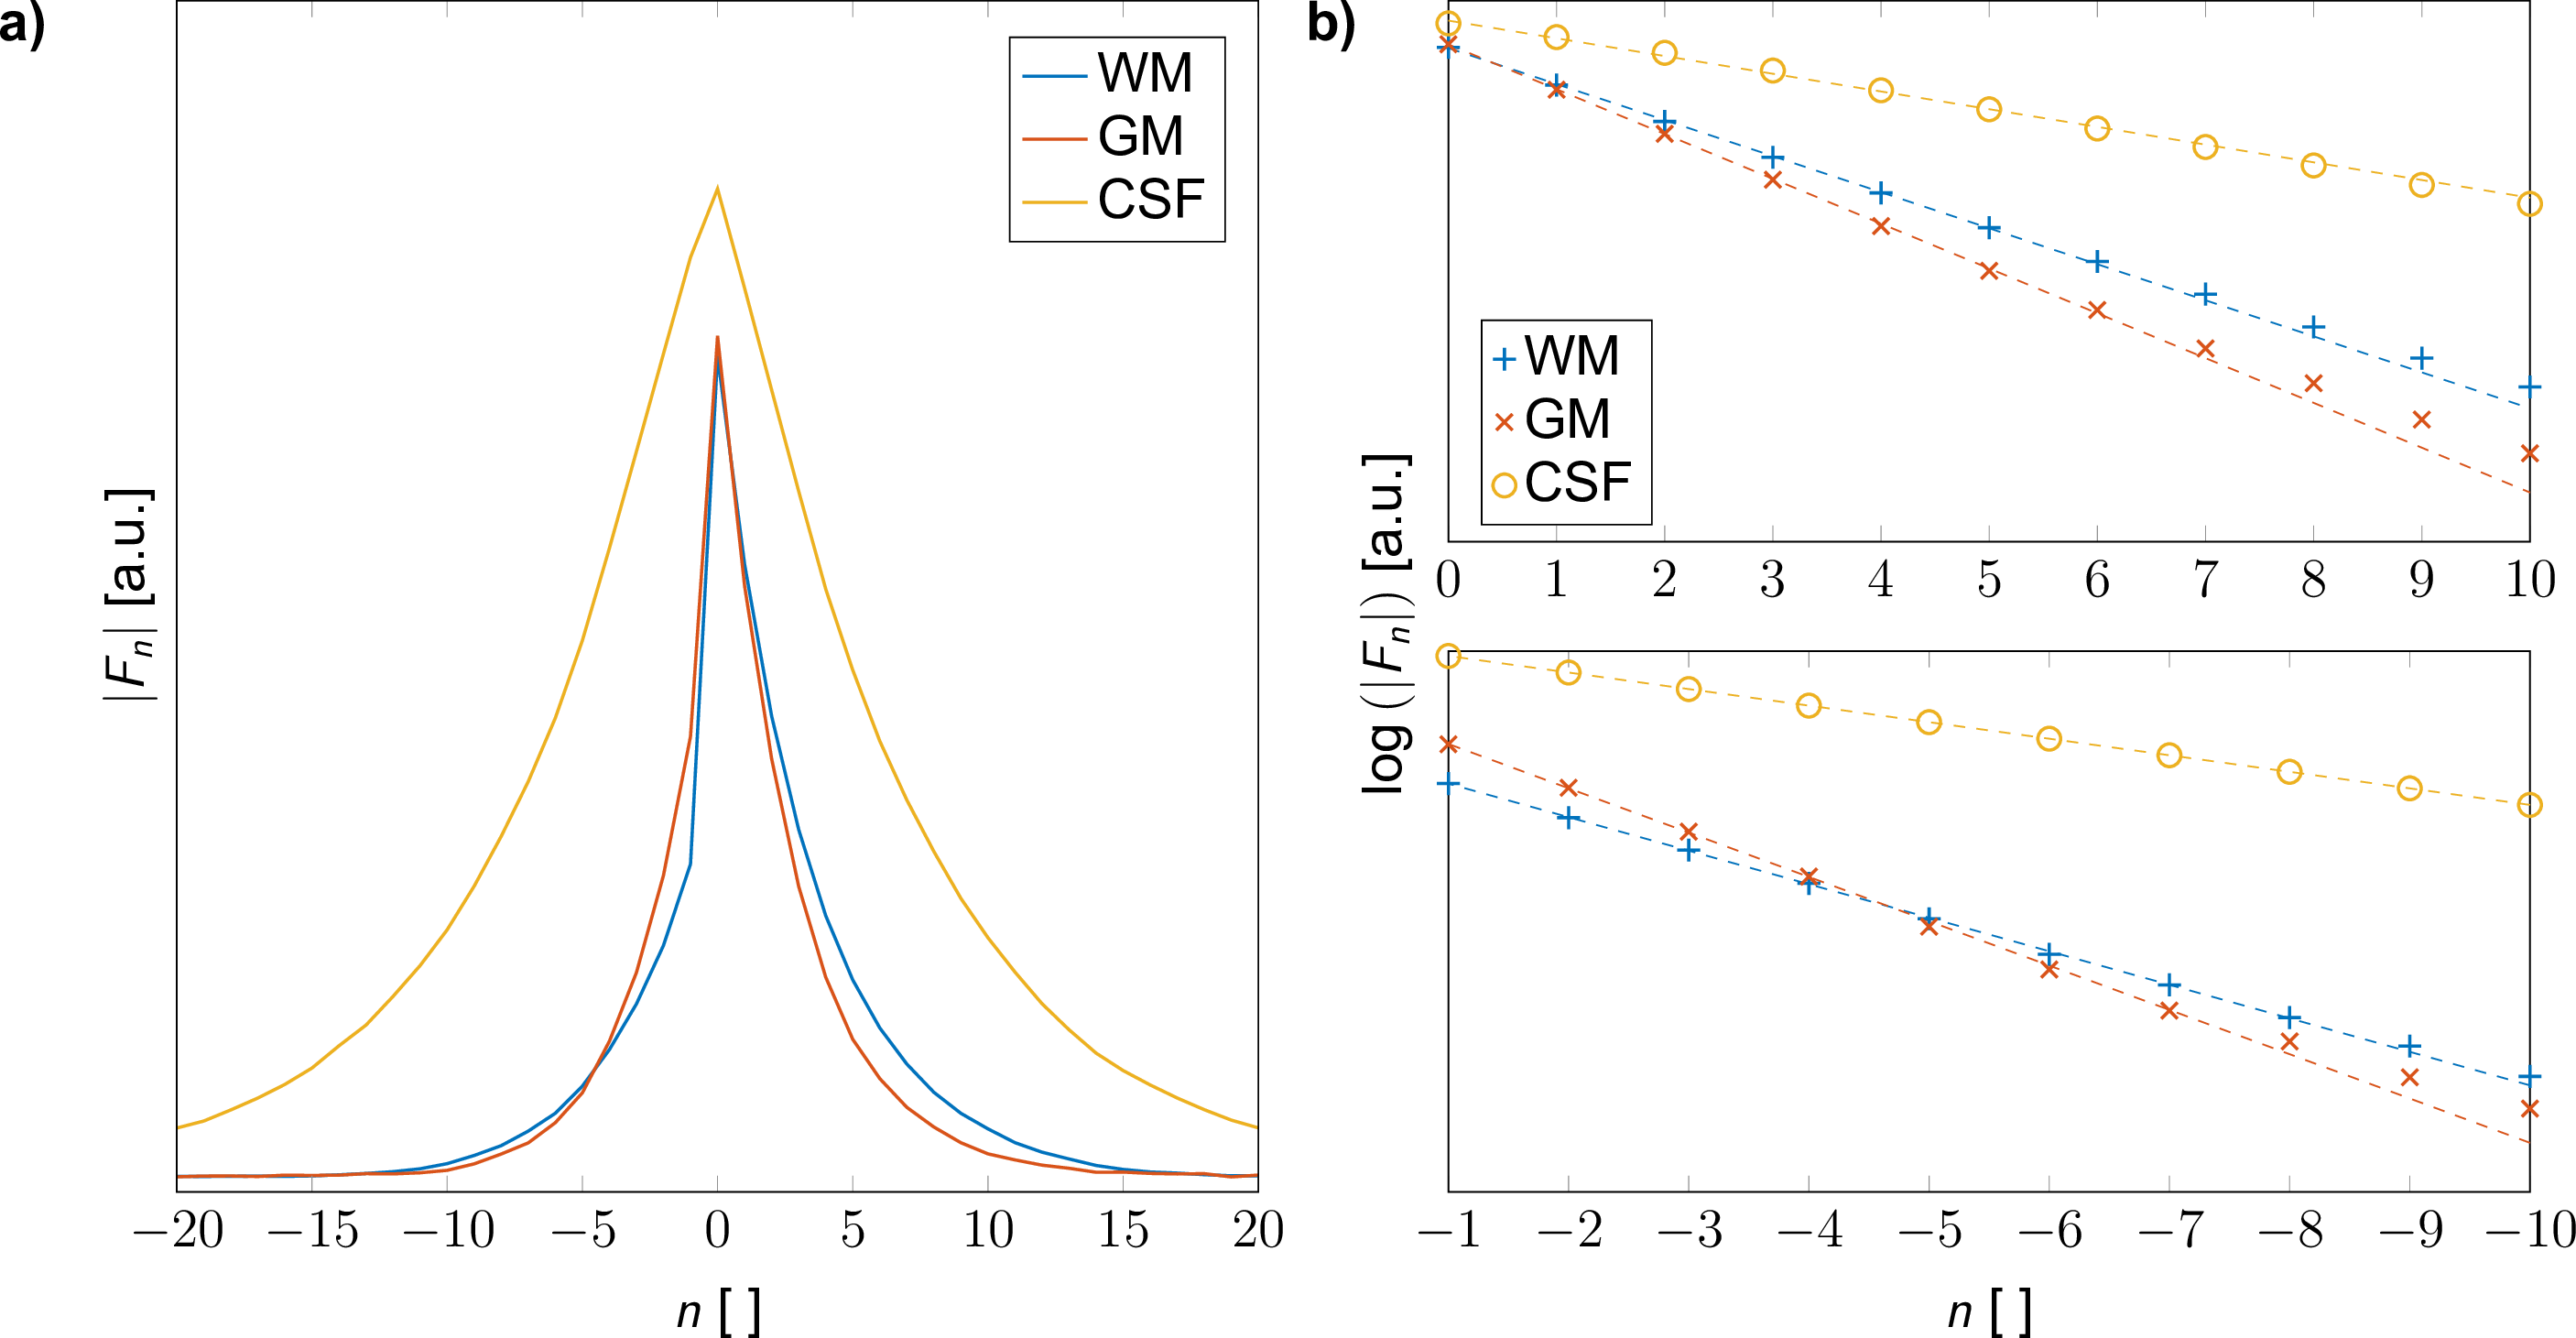
For the selected ROIs (cf. Figure 1a), the decay of the configuration amplitudes is shown in Figure 3a, revealing that no aliasing occurs, even for CSF and modes $$$F_n$$$ with order $$$|n| > 20$$$. A logarithmic plot for the positive and negative configuration amplitudes (Figure 3b) indicates a close to mono-exponential decay thus corroborating the use of a single-pole matrix pencil analysis.
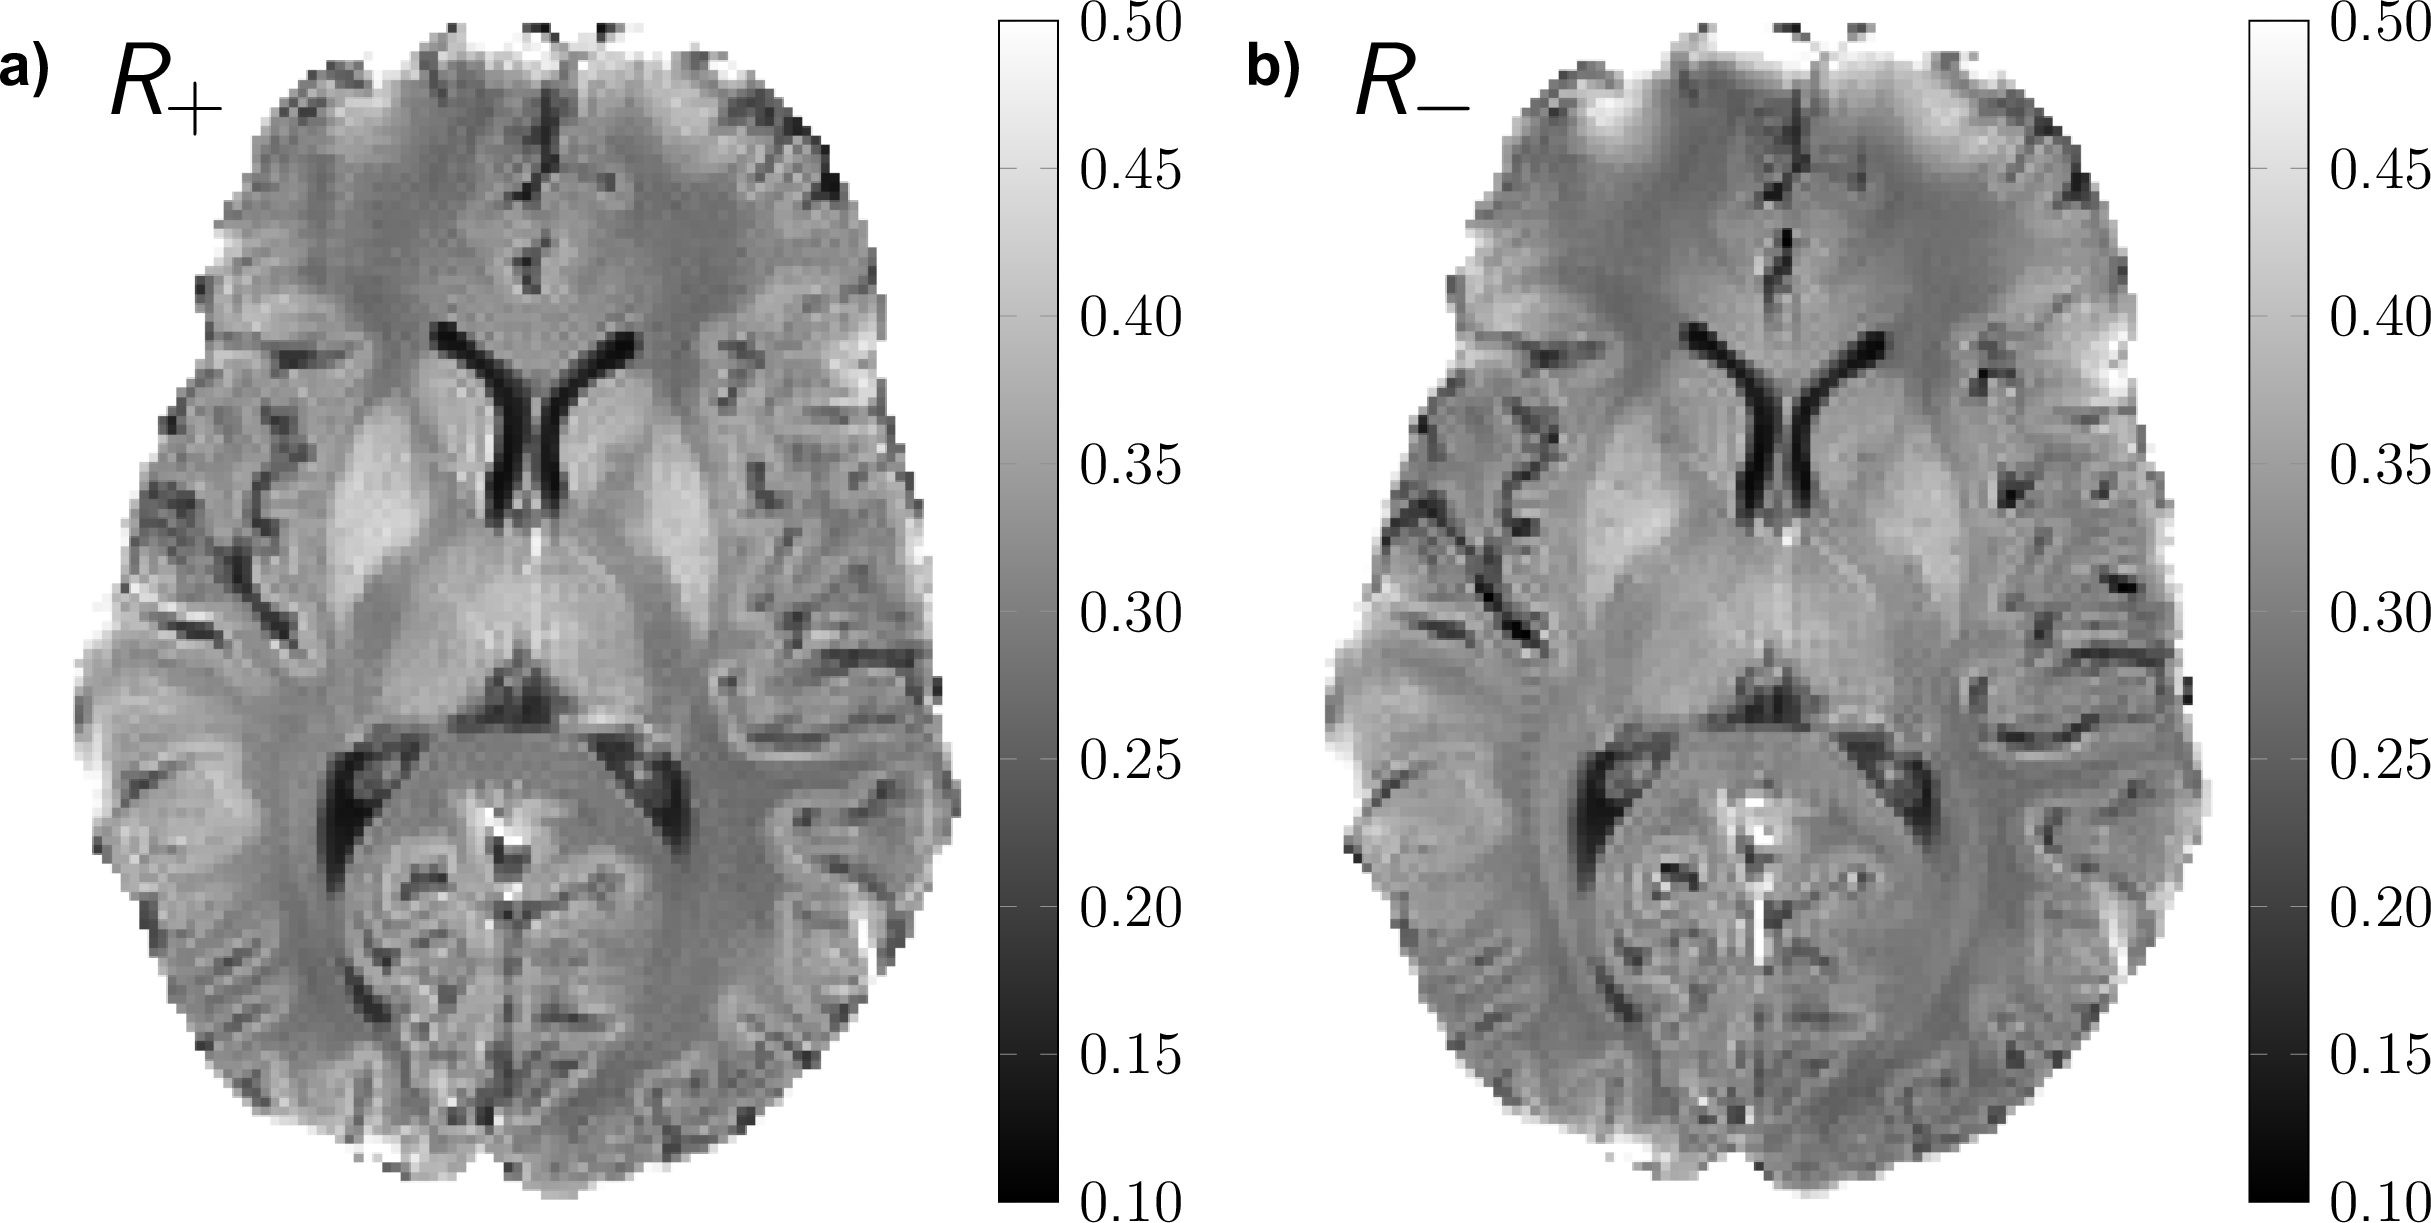
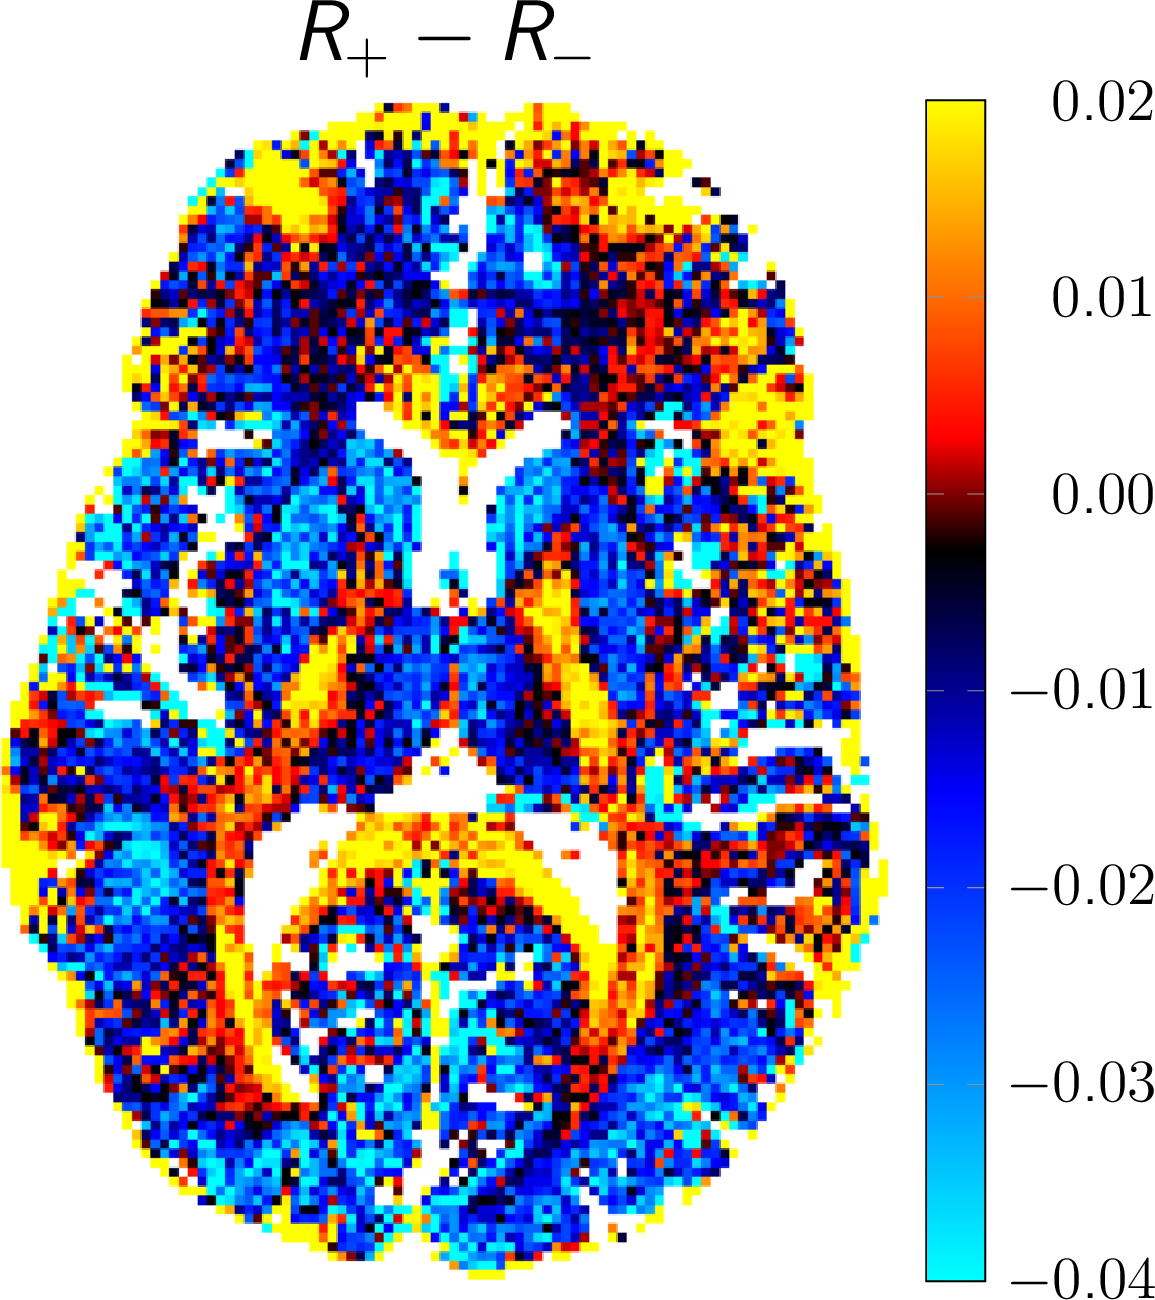
DECO images, illustrating the rate of the decay rate of positive (R+) and negative configurations (R-) from a matrix pencil analysis, are shown in Figure 4. Overall, positive configurations decay slower than their negative counterparts for gray matter, whereas positive modes decay faster than negative ones for deep white structures, such as the corpus callosum (CC). In particular, for the selected ROIs, we obtain: R±(WM) 0.27/0.28, R±(GM) 0.34/0.37 (R±(WM-CC) 0.31/0.29, R±(Putamen) 0.38/0.41). Finally, a color-coded DECO difference image is shown in Figure 5, accentuating the asymmetry in the configuration decay and revealing a non-random tissue-related contrast.
Discussion & Conclusion
For a homogeneous probe with a symmetric frequency distribution (around the on-resonance), the decay of positive and negative configurations with increasing mode order is essentially identical. Surprisingly, the decay of modes follows to a good approximation a mono-exponential decay and can thus be characterized by a single decay rate constant. Any asymmetry in the frequency distribution due to some tissue microstructure, will lead to an asymmetric bSSFP frequency profile, as already pointed out and discussed by Miller [4-5]. Here, we show that this asymmetry will generally lead to different decay rates for positive and negative configuration orders and is captured in the DECO difference image.
In conclusion, we
have introduced a new imaging method, termed DECO, that is sensitive to
intra-voxel frequency distributions caused by the underlying tissue
microstructure. Its sensitivity to subtle tissue alterations, such as the ones
commonly associated with neurodegenerative disorders, needs to be further investigated
and explored.
Acknowledgements
This research is supported by a grant from the Swiss National Science Fundation (325230_153332).References
[1] Y. Zur et al. MRM 16 (1990) 444-459
[2] C. Ganter, MRM 56 (2006) 687-691
[3] Y.-Y. Lin et al. jMR 128 (1997) 30-41
[4] K. Miller, MRM 63 (2010) 385-395
[5] K. Miller, MRM 63 (2010) 396-406
Figures