0991
Support vector machine for breast cancer classification using DWI histogram features: preliminary study1Department of Physics, Norwegian University of Science and Technology (NTNU), Trondheim, Norway, 2Department of Radiology, University of California, La Jolla, CA, United States, 3Department of Circulation and Medical Imaging, Norwegian University of Science and Technology (NTNU), Trondheim, Norway, 4Clinic of Radiology and Nuclear Medicine, St. Olavs University Hospital, Trondheim, Norway, 5Department of Cancer Research and Molecular Medicine, Norwegian University of Science and Technology (NTNU), Trondheim, Norway, 6Department of Surgery, St. Olavs University Hospital, Trondheim, Norway
Synopsis
In this work we use the machine learning method support vector machine (SVM) to classify malignant and benign tumors, as well as ER+HER2- and ER+HER2+. As feature we use histogram properties of DWI-models (RED, ADC, IVIM) parameters as features. Our study showed that SVM classifiers using combinations of features from different models have predictive power in both analyses, also it performed better than SVM using combination of parameters obtained only from one of the models. The results are encouraging because SVM with DWI parameters can potentialy hinder unnecessary biopsies.
Introduction
Different model fitting of diffusion-weighted imaging (DWI) of the breast can yield clinically relevant parameters [1-4]. In this work, the machine learning method support vector machine (SVM) uses DWI-model parameters as features, aiming to: (1) classify malignant and benign tumors and (2) distinguish human epidermal growth factor 2 (HER2) status for estrogen receptor positive (ER+) tumors. Classification is assessed separately for each diffusion model, and by combining features from all employed models.Subjects and methods
Patient Cohort
45 patients with known breast pathology gave written consent and were included: 18 benign, 27 malignant (of which 24 were ER+: 18 HER2+,6 HER2-. The study was approved by the Regional Committee for medical and Health Research Ethics.
MRI Acquisition
All patients were imaged in Siemens Skyra 3T, 16-channel breast coil. DWI was acquired using a fat-suppressed twice-refocused SE-EPI sequence with: TR/TE=9000/86ms, 90x90matrix-size, 2x2mm in-plane resolution, 2.5mm slice-thickness, and 13 b-values: 0, 10, 20, 30, 40, 50, 70, 90, 120, 150, 200, 400, 700 s/mm2 in six (n=19, scan time 11 minutes) or three (n=26, scan time 6 minutes) directions. An additional phase-reversed b0 image was acquired to enable distortion correction [5]. Finally, a clinical DCE-MRI scan was acquired.
One lesion per patient was fully segmented by 3D regions of interest (ROIs) outlined in the b700 images, guided by a post-contrast DCE image. If required, motion correction was performed by 3D rigid co-registration using a normalized cross-correlation metric.
DWI models:
1. Apparent Diffusion Coefficient (ADC): standard mono-exponential fitting (using b=200, 400, 700$$$\frac{s}{mm^{2}}$$$).
2. Intra-voxel Incoherent Motion (IVIM):
$$\frac{S}{S_{0}}=(1-f)\cdot e^{-b\cdot D}+f\cdot e^{-b\cdot (D+D^{*})}$$
True diffusivity (D) was determined from a mono-exponential fit to data at b≥400$$$\frac{s}{mm^{2}}$$$, with zero-intercept giving perfusion fraction (f) [3], and pseudodiffusivity (D*) was obtained using a Trust-region fitting method.
3. Relative Enhanced Diffusivity (RED): $$RED=\frac{ADC_{b0,b1}-ADC_{b1,b2}}{ADC_{b1,b2}}$$Here, b1, b2, b3 were 0, 200 and 700 $$$\frac{s}{mm^{2}}$$$, respectively.
Statistical analysis:
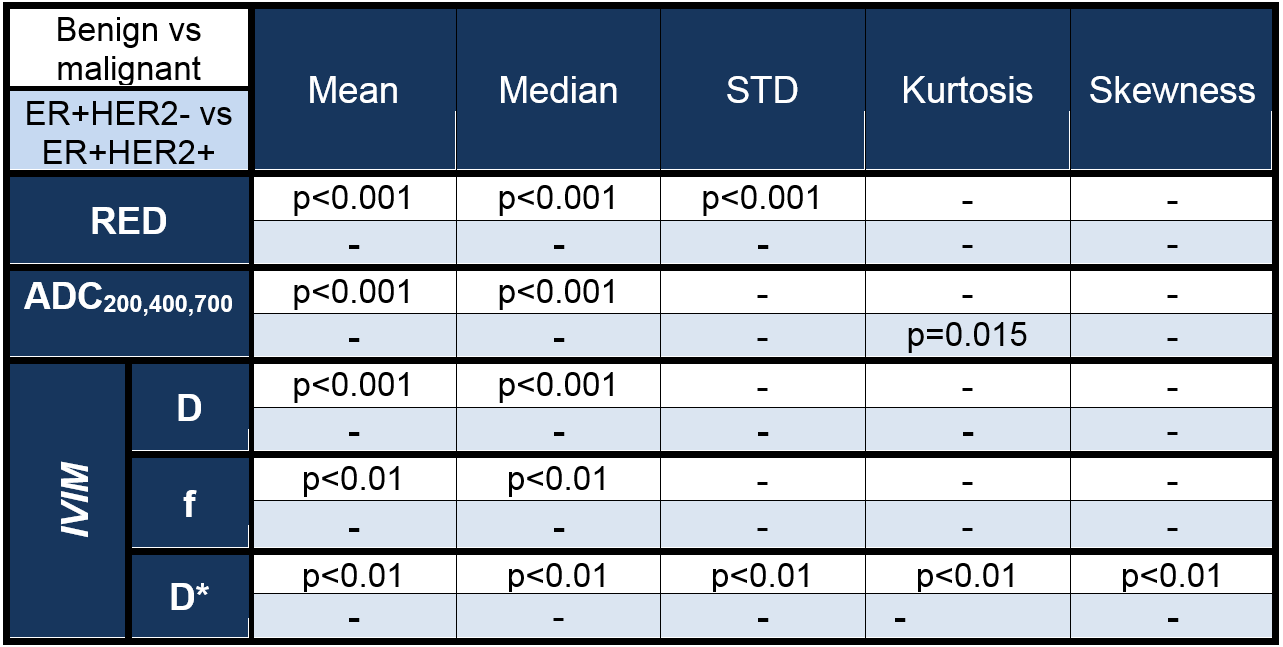
For each lesion, the ROI mean, standard deviation, median, skewness, and kurtosis were calculated for each parameter (ADC, RED, D, f, D*), providing a total of 25 features. These features were compared for malignant and benign tumors, and for ER+HER2+/ER+HER2- in malignant cases, using a Mann-Whitney test. The same features were used in SVM with radial basis function as kernel (with optimized kernel size and regularization parameter), and accuracy was assessed by leave-one-out cross-validation (LOOCV), and additionally confirmed by 10-fold cross-validation. Exploration of all feature combinations provided the best performing combinations of features based on cross-validation accuracy.
Software:
CMTK – motion and distortion correction; Matlab – data and statistical analysis; python library scikit-learn [6] – SVM.
Results
Statistical significances (Table 1) show that 14 of 25 DWI parameters successfully separated benign vs malignant tumors; only ADC200,400,700 histogram kurtosis separated HER2 status.
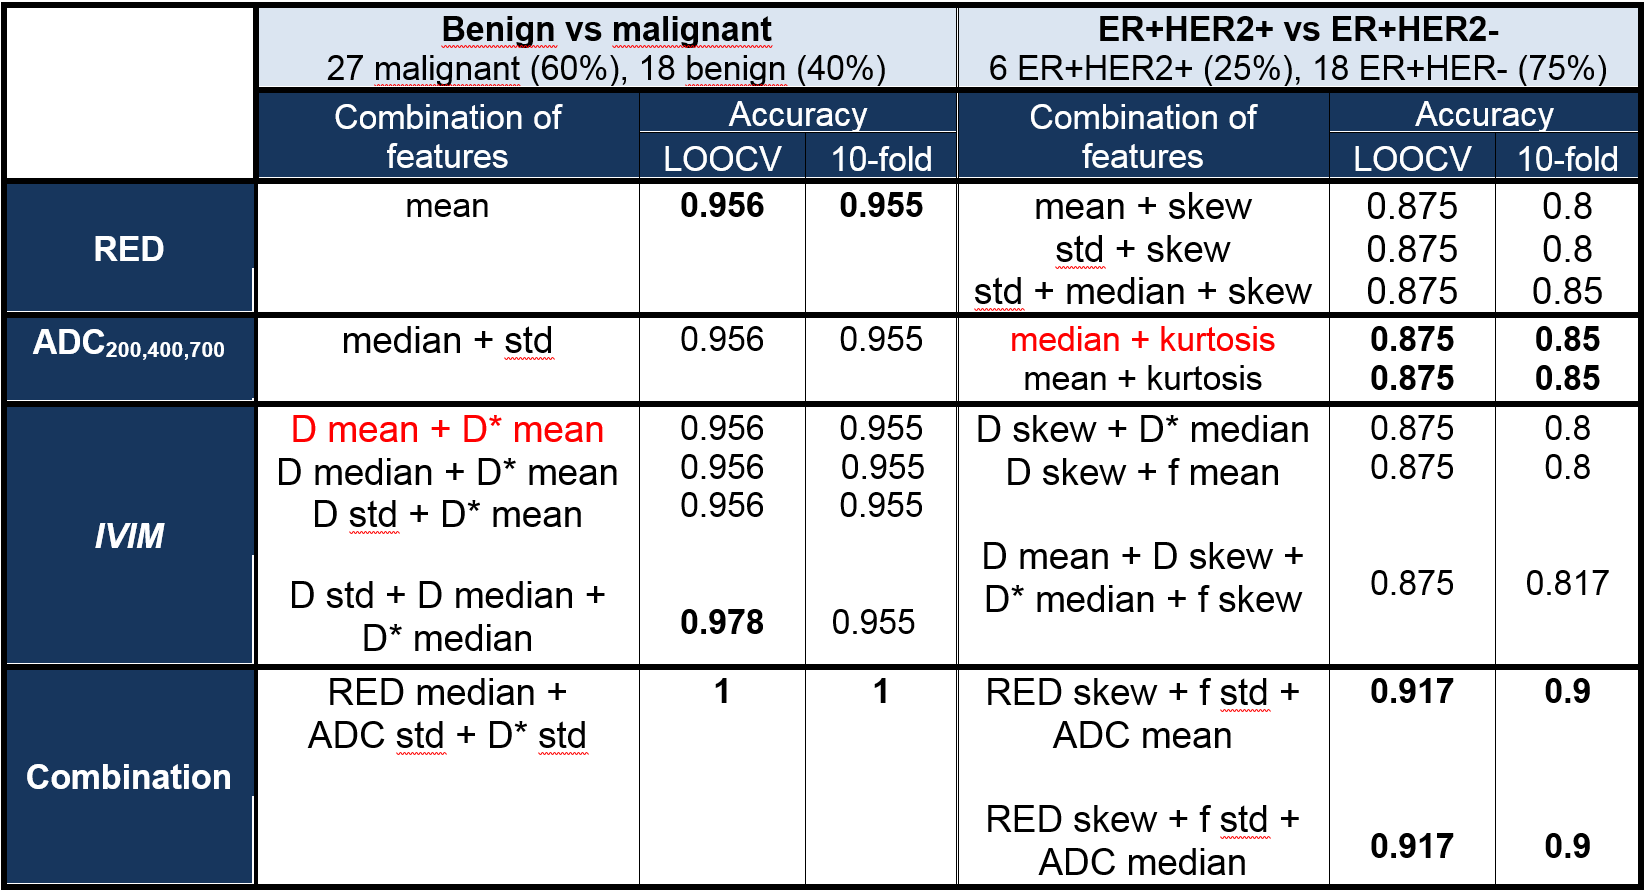
Optimal SVM classifications (separate and combined fitting strategies, Table 2) show similar classification accuracy obtained from all three models (~0.95 benign/malignant, ~0.87 ER+HER2-/ER+HER2-), with the overall highest accuracy obtained when combining features across DWI models (LOOCV accuracy 1 for benign/malignant, 0.92 for HER2±).
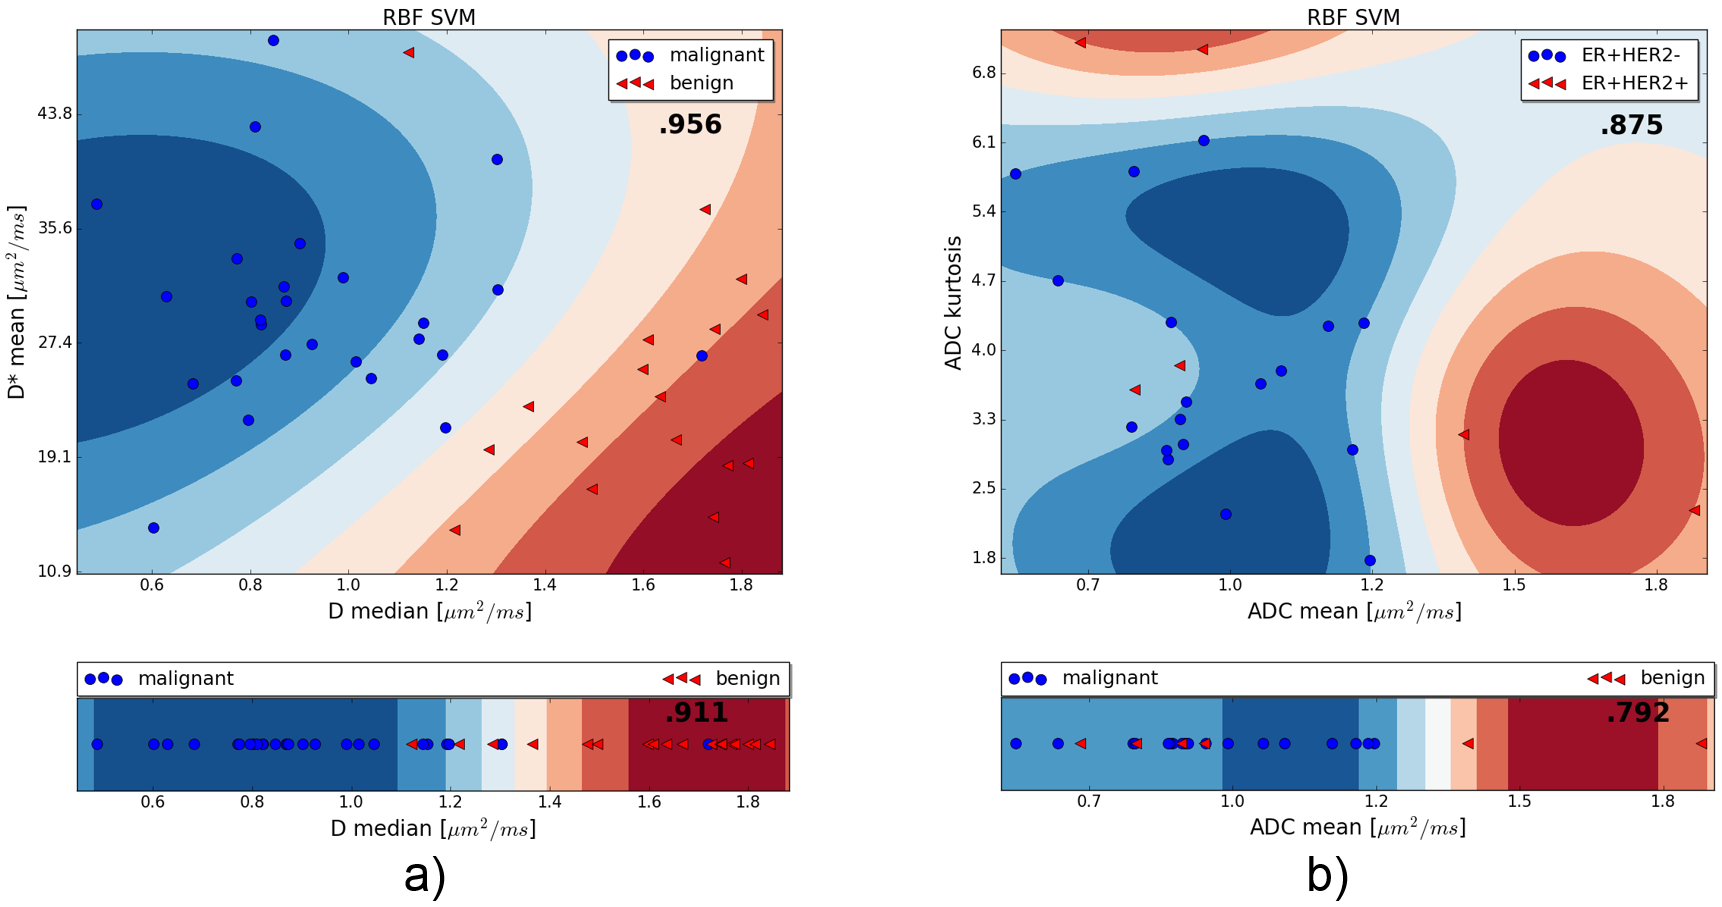
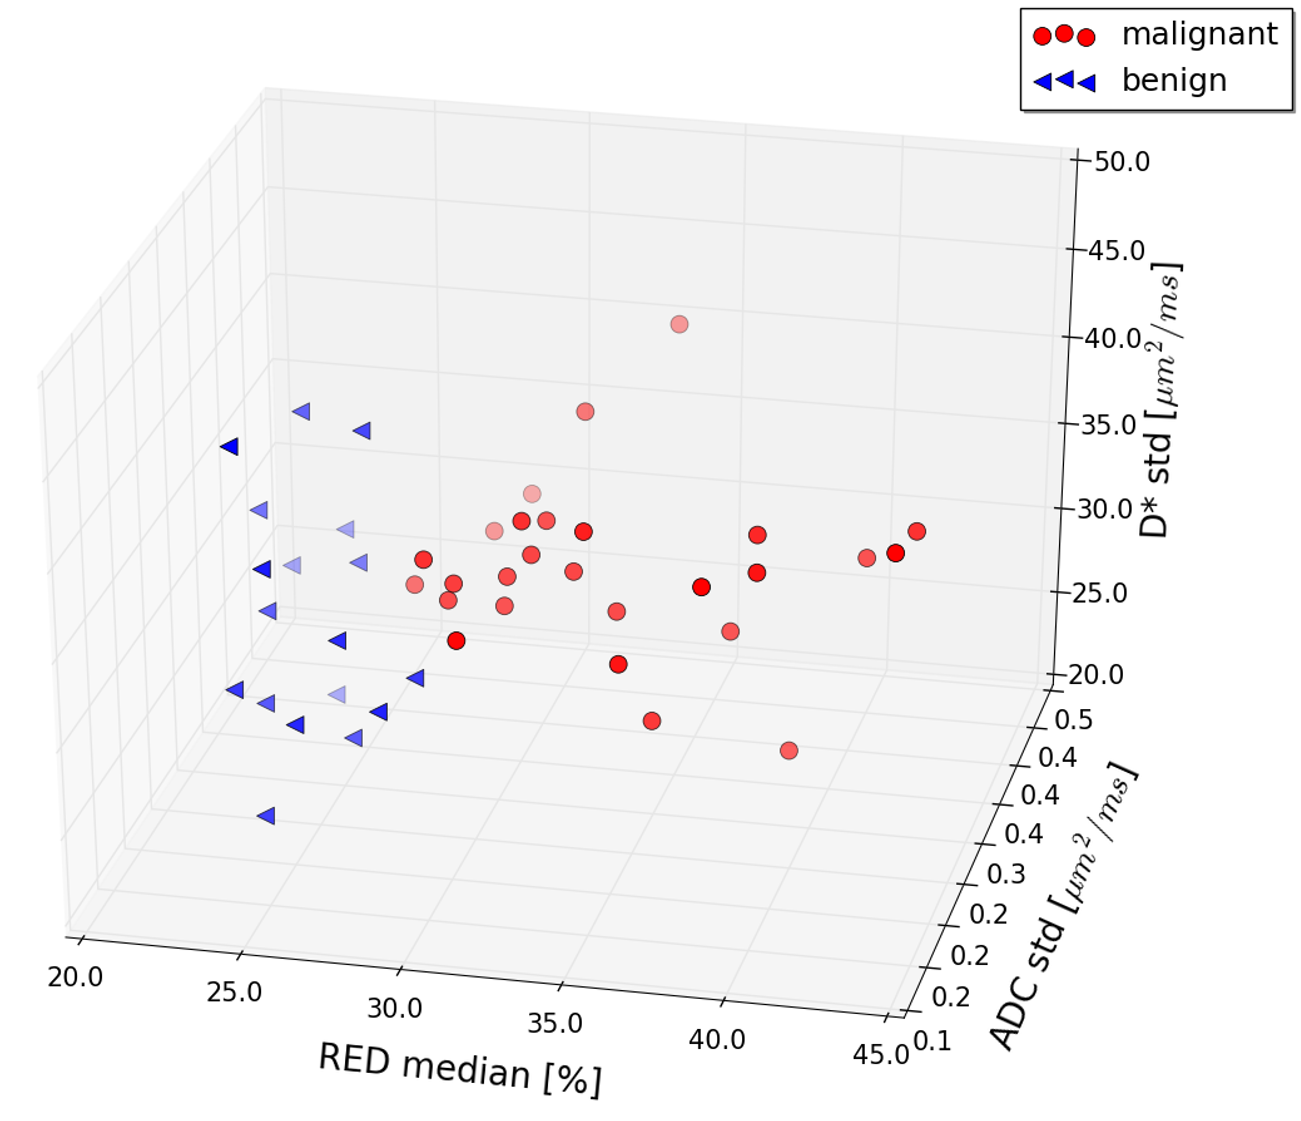
Figure 1 shows example classification plots for benign/malignant and HER2 status; Figure 2 shows the scatter plot for the best performing combination of features for the benign and malignant classification.
Discussion
The current results based on SVM classification of DWI features are encouraging as accurate differentiation of benign and malignant breast tumors may hinder unnecessary biopsies, and non-invasive knowledge about the HER2 status will provide predictive information.
Classification accuracy by SVM increases when combining appropriate features compared to using single features (figure 1). Since the best feature combinations include IVIM data, the study indicates the need for extensive b-values, thus extending the scanning time compared to what is needed for ADC or RED. However, the results should be interpreted with care due to possible overfitting despite using 10-fold cross validation. Further validation in an independent and larger patient cohort with test set (in addition to training and cross-validation sets) included should be performed to confirm the results.
Interestingly, it was shown that high statistical difference is not always a good indicator of usefulness of the feature in the machine learning model, since some non-significant differentiators (from Mann-Whitney test) were important features in SVM, i.e. std of ADC (table 1 and 2).
Conclusion
The current study shows that SVM classifiers using combinations of features from different models of DWI has predictive power for differentiation of benign and malignant breast tumors as well as classification of HER2 status in ER+ breast cancer.Acknowledgements
"The Computational Morphometry Toolkit (CMTK)", http://nitrc.org/projects/cmtkReferences
1. Guo, Y., et al., Differentiation of clinically benign and malignant breast lesions using diffusion-weighted imaging. Journal of Magnetic Resonance Imaging, 2002. 16(2): p. 172-178. 2. Bihan, D.L., et al., Separation of diffusion and perfusion in intravoxel incoherent motion MR imaging. Radiology, 1988. 168(2): p. 497-505. 3. Sigmund, E.E., et al., Intravoxel incoherent motion imaging of tumor microenvironment in locally advanced breast cancer. Magnetic Resonance in Medicine, 2011. 65(5): p. 1437-1447. 4. Teruel, J.R., et al., A Simplified Approach to Measure the Effect of the Microvasculature in Diffusion-weighted MR Imaging Applied to Breast Tumors: Preliminary Results. Radiology, 2016. 281(2): p. 373-381. 5. Teruel, J.R., et al., Inhomogeneous static magnetic field-induced distortion correction applied to diffusion weighted MRI of the breast at 3T. Magnetic Resonance in Medicine, 2014: p. n/a-n/a. 6. Pedregosa, F., et al., Scikit-learn: Machine Learning in Python. J. Mach. Learn. Res., 2011. 12: p. 2825-2830.Figures