0990
Quantitative Imaging for Radiotherapy on an MR-Linac Scanner1Radiotherapy, Netherlands Cancer Institute, Amsterdam, Netherlands, 2Radiology, Netherlands Cancer Institute, Amsterdam, Netherlands
Synopsis
The MR-Linac integrates and MR-scanner with a radiotherapy treatment machine. Patients undergoing radiotherapy treatment will be imaged daily on the MR-Linac. We investigated the suitability of the MR-Linac as a platform for quantitative imaging. Daily quantitative imaging can be used for imaging biomarker discovery, and give information on tumor treatment response. We did phantom studies of four quantitative MRI techniques: T2 mapping, dynamic contrast enhanced imaging, T1 mapping and diffusion weighted imaging to determine the accuracy of these techniques on the MR-Linac. We tested the repeatability of T2 mapping on a volunteer.
Purpose
The MR-Linac1 integrates a 1.5T scanner with a linear accelerator. As a typical radiotherapy treatment takes place over the course of several weeks, daily MRI of treatment response can be used to adapt the treatment. Daily imaging on the MR-Linac creates the opportunity for imaging-biomarker discovery. We investigated the repeatability and accuracy of quantitative MRI techniques on an MR-Linac and compared those to a 1.5T and 3.0T diagnostic MR scanner.Methods
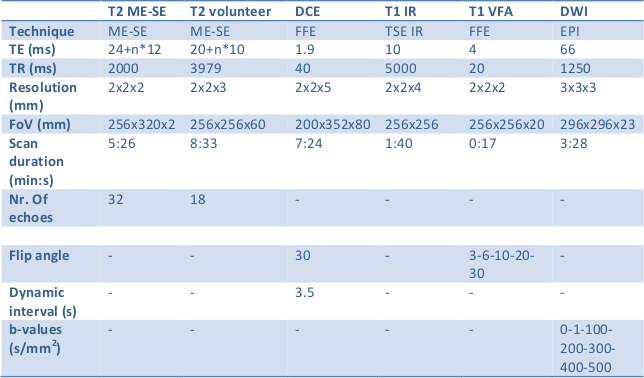
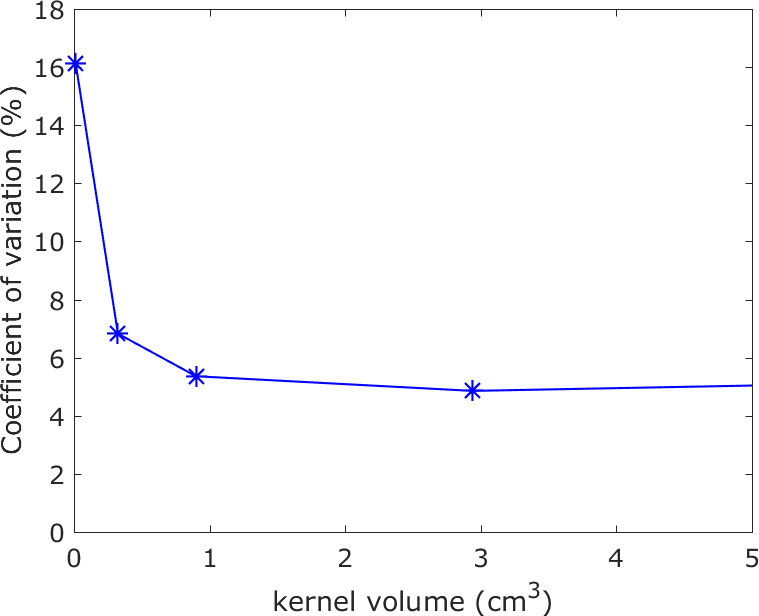
The MR-Linac differs in two aspects from diagnostic scanners. The gradient coils are split in two, and the 2x4 channel readout coil is made transparent to radiation. We compared phantom measurements (to determine accuracy) and volunteer images (to determine repeatability) of the MR-Linac with a 3T and a 1.5T diagnostic scanner. The sequences used are shown in the table. We performed T2 mapping on the Eurospin T05 phantom2 with a multi-echo/spin-echo sequence (ME-SE)3. We compared the measured T2 values of the phantom with literature values2. For DCE-MRI we tested the stability of the signal during a 7min sequence on different contrast agent concentrations. We tested the accuracy of T1 with the variable flip angle (VFA)4,5 mapping technique using the Eurospin phantom. As a benchmark measurement we used the Inversion Recovery (IR) series. For DWI we determined the accuracy of Apparent Diffusion Coefficient (ADC) measurements of water at 0oC with an Echo Planar Imaging (EPI6) readout. Finally, we made T2 maps of the prostate of a volunteer to quantify the potential of the MR-Linac to generate repeatable, quantitative results in patients in relation to image resolution. We compared the T2 values of two scans voxel-by-voxel. We determined the repeatability of the maps as a function of voxel size by increasing the voxel size by blurring with a smoothing block filter of increasing volumes.
Results
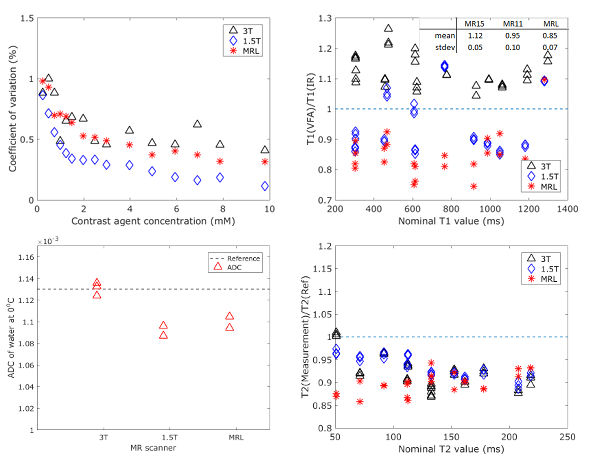
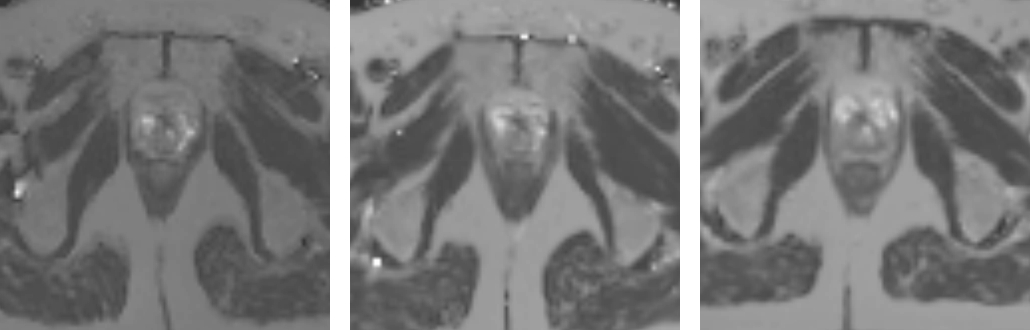
Figure 1 (top left) shows that the stability of a dynamic series on the MR-Linac is comparable to the stability of the diagnostic scanners. Top right shows the relative T1 value using the VFA technique compared to the IR result. As expected7,8, this result shows a systematic bias of up to 15 %. The spread is 5-10%. The clinical T2 mapping technique (bottom right) shows that the measured T2 value of the phantom is similar on all platforms. The ADC of water (bottom left) is measured within 3% of the literature value of 1.13*10-3mm2/s9 on all three systems. Figure 2 shows the T2 maps of a healthy volunteer on the three scanners, indicating the general image quality. Figure 3 shows the voxel-by-voxel repeatability of the T2 map as a function of voxel size for the MR-Linac, quantifying the capability of the MR-Linac for T2 mapping.Conclusion
The quantitative imaging of T1, T2 and ADC, and the stability of a dynamic imaging series on the MR-Linac are comparable to a diagnostic MR scanner. The volunteer study shows that T2 mapping on the MR-Linac is repeatable. These results show that the MR-Linac can be used as a platform for quantitative imaging.Acknowledgements
No acknowledgement found.References
1. The MR-Linac consortium, The MRI-Linear Accelerator Consortium, 2016. Evidence-Based Clinical Introduction of an Innovation in Radiation Oncology Connecting Researchers, Methodology, Data Collection, Quality Assurance, and Technical Development, Frontiers in Oncology 6
2. Eurospin TO5, Diagnostic Sonar, Livingston, Scotland
3. Meiboom, S., and Purcell, E. M. 1958. Modified spin-echo method for measuring nuclear relaxation times. Rev. Sci. Instrum. 29: 688-691
4. Blüml, S., Schad, L.R., Stepanow, B., Lorenz, W., 1993. Spin-lattice relaxation time measurement by means of a TurboFLASH technique. Magn. Reson. Med. 30, 289–95.
5. Deoni, S.C.L., Peters, T.M., Rutt, B.K., 2005. High-resolution T1 and T2 mapping of the brain in a clinically acceptable time with DESPOT1 and DESPOT2. Magn. Reson. Med. 53, 237–41.
6. Mansfield, E 1977. Multi-planar image formation using NMR spin echoes. J. Phys. C: Solid State Phys. 10: L55-58.
7. Fennessy, F.M., Fedorov, A., Gupta, S.N., Schmidt, E.J., Tempany, C.M., Mulkern, R. V, 2012. Practical considerations in T1 mapping of prostate for dynamic contrast enhancement pharmacokinetic analyses. Magn. Reson. Imaging 30, 1224–33.
8. Manuel, A., Li, W., Jellus, V., Hughes, T., Prasad, P. V, 2011. Variable flip angle-based fast threedimensional T1 mapping for delayed gadolinium-enhanced MRI of cartilage of the knee: need for B1 correction. Magn. Reson. Med. 65, 1377–83.
9. Holz, M., Heil, R., Sacco, A., Chemie, P., Karlsruhe, U., Karlsruhe, D., Foggia, U., Napoli, V., 2000. Temperature-dependent self-diffusion coefficients of water and six selected molecular liquids for calibration in accurate 1 H NMR PFG measurements. Phys. Chem. Chem. Phys. 2, 4740–4742.
Figures