0989
MR Elastography and Perfusion MRI for the Early Assessment of Treatment Response in Soft Tissue Sarcomas1Radiation Oncology, Mayo Clinic, Rochester, MN, United States, 2Radiology, Mayo Clinic, Rochester, MN, United States, 3Mayo Graduate School, Mayo Clinic, Rochester, MN, United States, 4Pathology, Mayo Clinic, Rochester, MN, United States
Synopsis
Advanced imaging is a critical component in the development of patient-specific and novel treatment strategies, and the non-invasive evaluation of early response in sarcomas. Our central hypothesis is that changes in sarcoma stiffness quantified with MRE and perfusion with DCE-MRI throughout therapy can predict response. Soft tissue sarcomas are a rare malignancy arising in a wide range of anatomic locations. Anatomy-specific imaging protocols were developed to evaluate soft tissue sarcomas in 9 patients. In 3 patients, we investigated the feasibility to assess response to radiation therapy and observed a decrease in parameters related to tumor stiffness and perfusion metrics.
PURPOSE:
Soft tissue sarcomas (STS) are a rare group of malignancies comprised of over 50 different subtypes and over 100 different histopathologies (1). Despite advances in therapy, high grade STS continue to have a 50% mortality rate (2). A major hurdle is identifying the right treatment for specific subtypes, and the development of more accurate and predictive criteria for earlier evaluation of response and progression would have significant implications for critical treatment decisions and for clinical trial endpoints. The purpose of this work was to develop and apply MR elastography (MRE) and dynamic contrast-enhanced MRI (DCE-MRI) techniques in soft tissue sarcomas. The long-term goal is to determine the efficacy of MRE and DCE-MRI for the early assessment of response to therapy and correlate with standard clinical response metrics including change in tumor size and histopathology.METHODS:
The goal of this work was to develop MRE and DCE-MRI imaging strategies for the wide variety of STS anatomical locations including upper and lower extremities, chest wall, and paraspinal. Nine patients with STS or Ewing’s sarcoma were recruited for this IRB approved study. Inclusion criteria: age ≥ 18 years, newly diagnosed histological and/or imaging confirmation of STS or Ewing’s sarcoma, and ≥ 5 cm minimum size. MRE representative parameters: 3D-GRE acquisition; 60 Hz motion; TR/TE = 24.1/20.3 ms; FOV = 24 cm; 128x128 image matrix; 32 partitions with 3-mm thickness; 3 phase offsets; ~8 minutes. Elastograms were reconstructed using a 3D local frequency estimation (LFE) inversion with 3D directional filtering (3). Stiffness values were reported for manually drawn regions of interest (ROI). To assess perfusion, T1-weighted 3D time-resolved DCE-MRI was acquired using a Cartesian acquisition with projection-reconstruction-like sampling (pCAPR)(4). Representative parameters: 12 degree flip angle; 2D SENSE acceleration 2.5 (L/R) x 1.5 (S/I); 6.6 s frame time; 3-5 minute acquisition time with 15-31 time frames. An IV injection of gadolinium (0.1 mmol/kg) at 3 mL/s rate was initiated 30 s after the start of scan. Image reconstruction was performed using an iterative sparse reconstruction method (5). For every voxel, the tissue enhancement curve was fitted to the Tofts’ perfusion model (6) by minimizing a cost function (7) using the VARPRO technique. Estimates of Ktrans and kep used the acquired tissue perfusion and (Arterial Input Function) AIF. Perfusion maps were reported for an ROI containing the tumor. In 2 patients, pathology results were obtained following surgery where surgical specimens were oriented to the imaging results and sectioning was performed to qualitatively compare imaging and pathology.RESULTS:
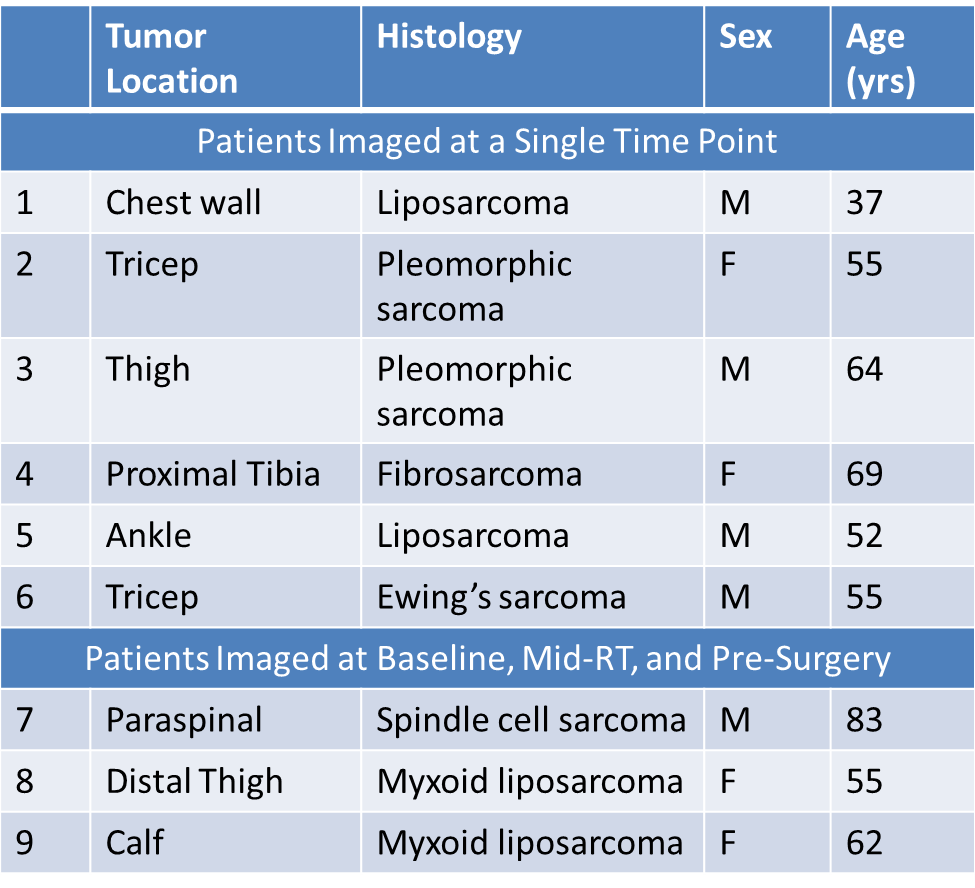
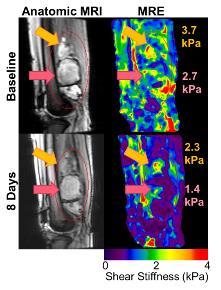
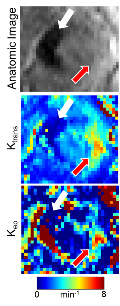
Patient demographics, tumor type, and imaging time point are shown in Table 1. Nine patients were recruited (n = 6 at a single time point, n = 3 at multiple time points to evaluate response to radiation therapy). STS are very heterogeneous tumors, both in stiffness (Figure 1) and perfusion (Figure 2), with stiff and soft regions as well as enhancing and non-enhancing regions marked in the associated figures. In one thigh sarcoma patient, tumor stiffness decreased 30% from baseline to completion of RT and histopathology confirmed 50% tumor necrosis. Regional changes occurred (Figure 1) where different components had variable overall change following treatment, corresponding to regional areas of viable tumor remaining or necrosis by histopathology (Figure 3).DISCUSSION:
MRE and DCE-MRI can be utilized to quantitatively evaluate tumor stiffness and perfusion in sarcomas during treatment. In this pilot study, we demonstrated the feasibility of performing MRE and DCE-MRI in 9 patients with sarcoma in various anatomical locations. In three patients, imaging was performed before, during, and after RT, and regional decreases in tumor stiffness, and perfusion parameters were observed and correlated to pathology. One of the first challenges of imaging in sarcoma is the development of imaging protocols by anatomical site. Protocols were developed for upper and lower extremities and chest wall including optimization of MRE driver selection and applied frequency, as well as DCE-MRI acquisition parameters. A second challenge involves image processing and future work is needed to register the MRE, DCE-MRI, and anatomic MRI to investigate the local relationship between change in tumor stiffness, perfusion, and size. Ongoing work includes further patient recruitment and efforts to standardize measurements in the case of regional changes in tumor stiffness and perfusion.CONCLUSION:
Validation of these novel imaging techniques have demonstrated the potential to individualize therapy decisions based on an individual’s response to therapy. The ability of MRE and DCE-MRI to accurately assess early response is promising in its potential to efficiently evaluate novel targeted therapies and help move towards more individualized treatment for patients with sarcoma.Acknowledgements
Funding sources: NIH Grant EB001981, Varian Medical Systems Grant, Mayo Department of Radiation Oncology Matteson Funds.References
1. Helman LJ, Meltzer P. Mechanisms of sarcoma development. Nat Rev Cancer. Sep 2003;3(9):685-694.
2. SEER Cancer Fact Sheets http://www.seer.cancer.gov/statfacts/index.html, September 24, 2016.
3. Manduca A, Oliphant TE, Dresner MA, et al. Magnetic resonance elastography: non-invasive mapping of tissue elasticity. Med Image Anal. Dec 2001;5(4):237-254.
4. Froemming AT, Borisch EA, Trzasko JD, et al. The Application of Sparse Reconstruction to High Spatio-Temporal Resolution Dynamic Contrast Enhanced MRI of the Prostate: Initial Clinical Experience with Effect on Image and Parametric Perfusion Characteristic Quality. Paper presented at: International Society of Magnetic Resonance in Medicine2015; Toronto, Ontario, Canada.
5. Trzasko JD, Haider CR, Borisch EA, et al. Sparse-CAPR: highly accelerated 4D CE-MRA with parallel imaging and nonconvex compressive sensing. Magnet Reson Med. Oct 2011;66(4):1019-1032.
6. Tofts PS, Brix G, Buckley DL, et al. Estimating kinetic parameters from dynamic contrast-enhanced T(1)-weighted MRI of a diffusable tracer: standardized quantities and symbols. J Magn Reson Imaging. Sep 1999;10(3):223-232.
7. Kargar S, Stinson EG, Borisch EA, et al. Robust and Efficient Pharmacokinetic Parameter Estimation: Application to Prostate DCE-MRI. Paper presented at: International Society of Magnetic Resonance in Medicine2016; Singapore.
Figures