0985
Pipeline for longitudinal assessment of patient-derived mouse xenografts using 3D magnetization transfer-weighted MRI1Psychology, Neuroscience and Behaviour, McMaster University, Hamilton, ON, Canada, 2McMaster Stem Cell and Cancer Research Institute, McMaster University, Hamilton, ON, Canada
Synopsis
A pipeline was developed, driven by 3D magnetization transfer-weighted images acquired without contrast agent, to automatically assess mouse models of patient-derived tumours against an atlas of control NOD-SCID mice, for the purposes of longitudinal, high-throughput screening of mice for response to cancer therapy and recurrence.
INTRODUCTION
Mouse models of human cancer are being developed to study the response of individual patient’s tumours to multiple therapeutic regimens in parallel for the purposes of personalized medicine. Among these, tumours derived from brain tumour initiating cells (BTIC) are of especial interest for characterizing recurrent or treatment refractory cancers, because they represent the populations of cells responsible for tumour initiation[1, 2]. BTIC xenografts in immuno-deficient mice (NOD-SCID) from new patient-derived cell lines have unpredictable growth rates, responses to therapy, and times to recurrence. In vivo imaging is essential to characterize these models by following the disease longitudinally in reduced numbers of individual animals instead of large cross-sectional cohorts characterized by histology at single timepoints[3]. It requires an easily-repeatable, high-throughput 3D imaging technique. It ideally also uses an endogenous contrast mechanism to avoid the impracticalities and potential inconsistencies of using injectable contrast agents in a longitudinal study. We found that magnetization transfer-weighted MRI provides clear contrast for distinguishing tumour while also highlighting underlying anatomical features in the brain[4-7]. Using MT-contrast to drive registration against a healthy NOD-SCID atlas, we developed a protocol for automated quantification and simple visualization of tumour burden.METHODS
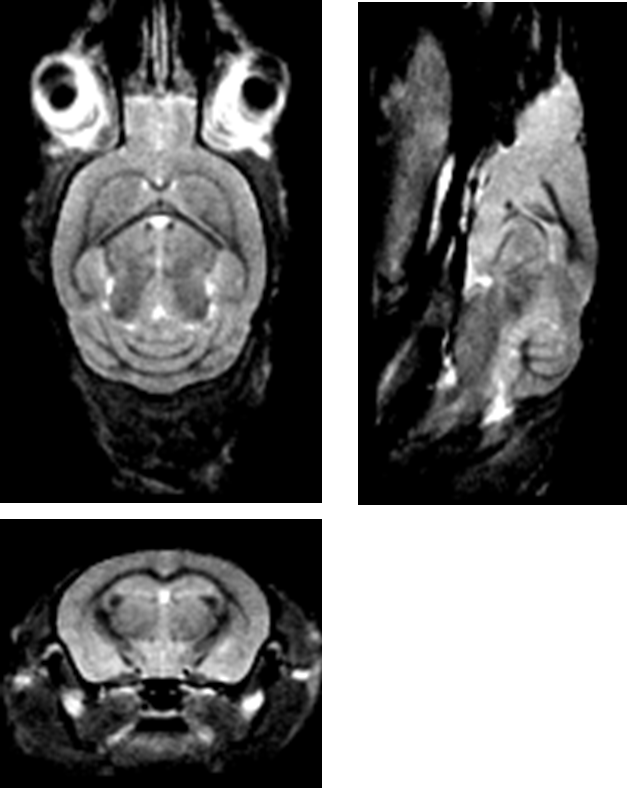
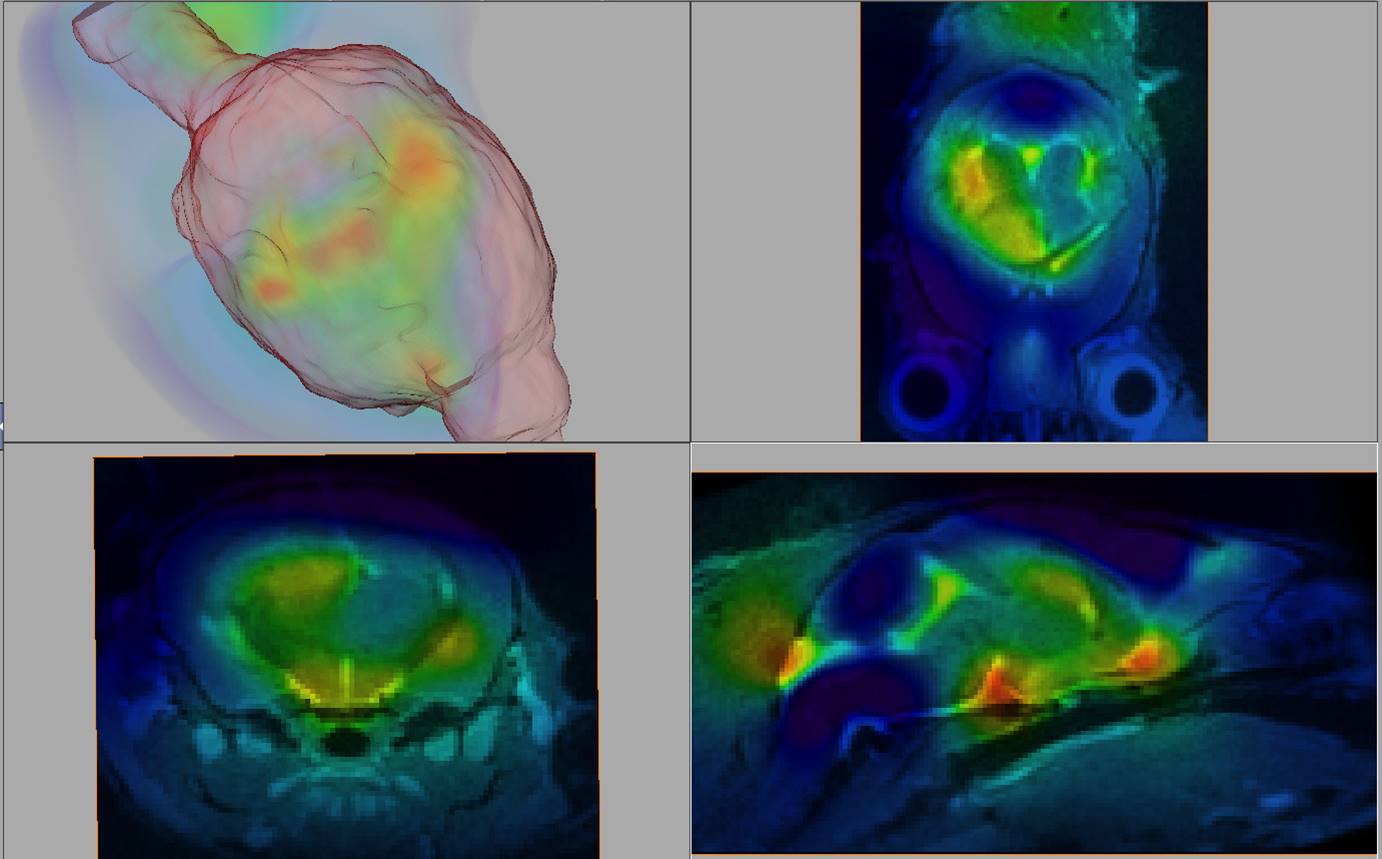
3D imaging was performed on a 7T Bruker Ascend 300WB with the MicWB40 probe. MT-weighted images were acquired according to the protocol in Watanabe et al.[8]. The image volume was acquired at 150 µm isotropic, with a FOV of 25 x 25 x 20 mm, with slice orientation coronal, and read orientation H_F (head to foot). The saturation pulse was applied once per TR, with a Gaussian shape, pulse width: 12 ms, nominal flip angle 523° (max pulse amplitude 6.8 µT), offset frequency 2500 Hz. Image acquisition was performed with a spoiled gradient echo with TR: 23 ms, TE: 3 ms, and excitation angle: 5°. The scan time for a single 3D image was 8 min 28 s. Eight averages were performed for a total imaging time of 1 hr 7 min 11s. This protocol was originally developed for contrast-enhanced anatomical brain images at 9.4T, so it was verified with simulations that it would offer suitable contrast in a tumour-bearing mouse brain at 7 T (Fig. 1). Images from 7 control NOD-SCID animals were registered (FSL, flirt) and averaged to form a reference brain atlas (Fig. 2). Images from tumour-bearing animals were registered to this atlas (FSL, fnirt), and the Jacobian determinant of the nonlinear deformation was calculated at each voxel. A metric of tumour volume was computed from the difference between non-CSF brain tissue in the tumour-bearing animals and the non-CSF brain tissue in the atlas. Tumour-bearing animals were imaged at multiple time-points after injection (in increments of weeks) to establish engraftment and progression after treatment. H&E staining was performed for validation of tumour distribution.RESULTS and DISCUSSION
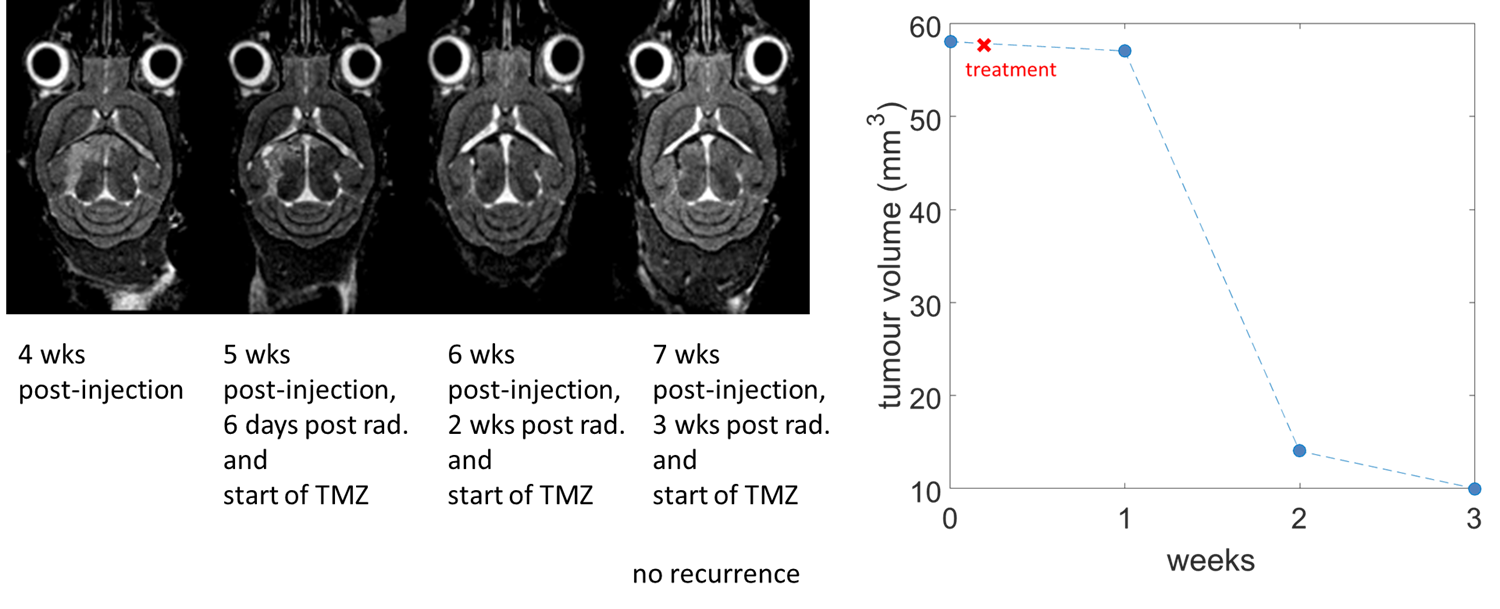
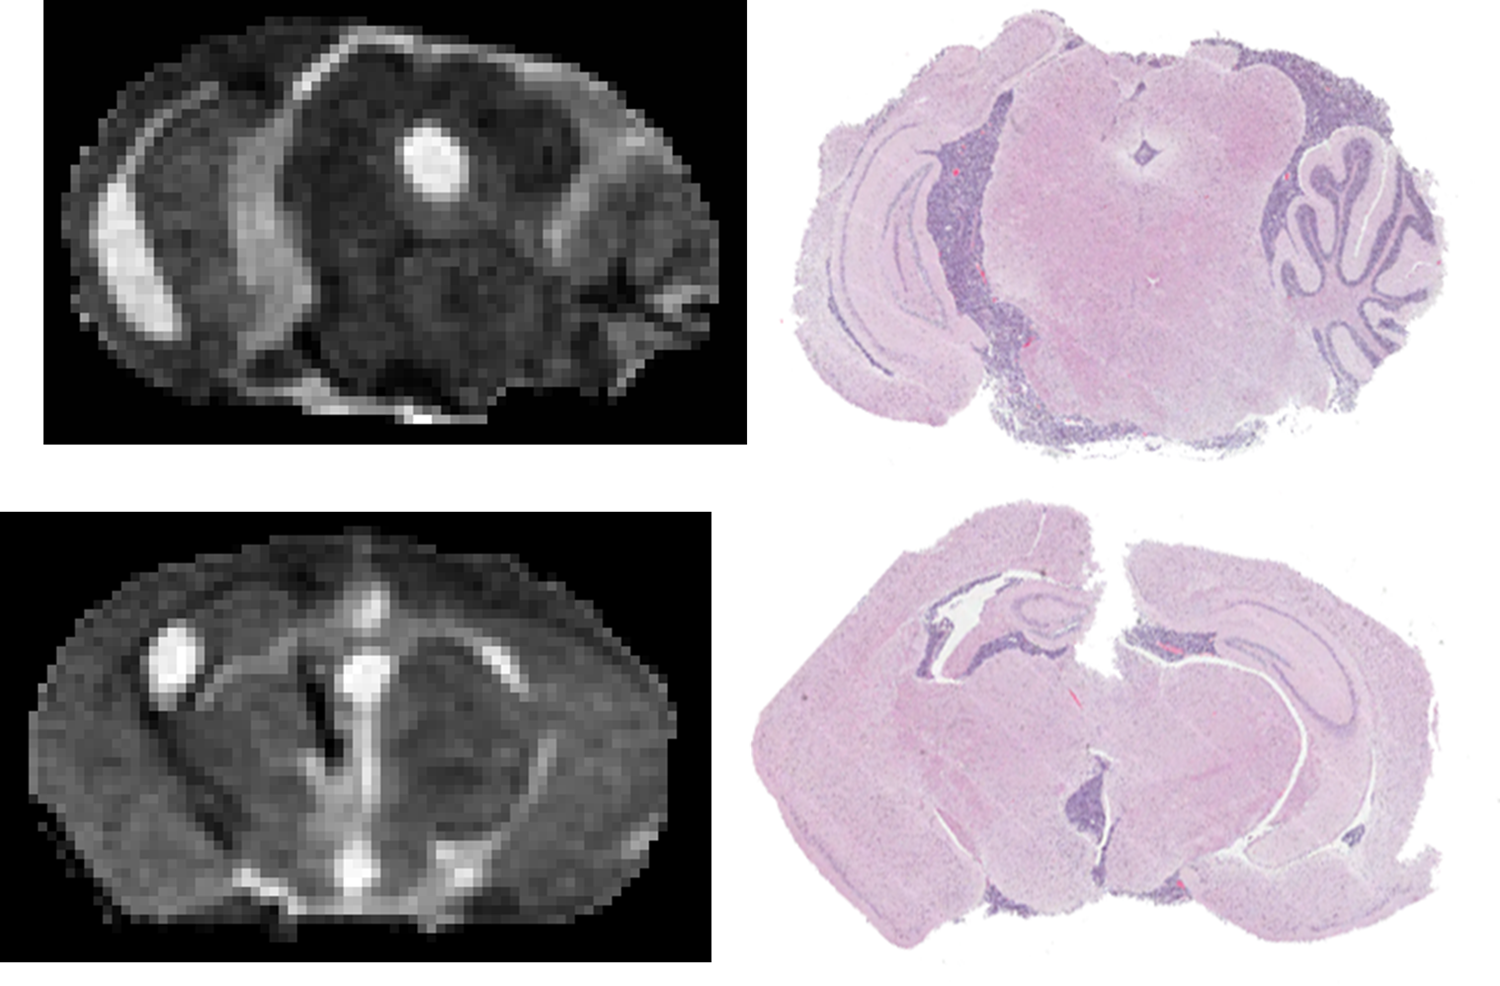
MT-weighted imaging obtained CNR of 19 between tumour and white matter, 16 between tumour and gray matter, and 3 between white and gray matter in 1 hr. The Jacobian map was used to visualize the distribution of the deformations (Fig. 3). Longitudinal evolution in a comparable coronal slice from a single animal over the course of 3 weeks is shown in Fig. 4 alongside the quantitative tumour burden metric as a function of time after the first imaging session. Excellent consistency between MRI and histology was observed (Fig. 5). The smallest tumour visible on MRI verified by histology was a mass of 500-1000 cells. Ongoing improvements to the pipeline are being made to further separate effects of hydrocephalus from tumour growth, account for normal brain development over time, and for tailoring deformation maps to enhance tumour segmentation in conjunction with MT-weighted contrast.CONCLUSION
This pipeline using MT-weighted imaging is effective for establishing tumour engraftment and detecting recurrence after therapy, is repeatable and applicable to a wide range of xenograft cell lines in mouse brain.Acknowledgements
We would like to acknowledge a Terry Fox Project Program grant for funding mouse tumour model development.References
1. Singh SK, Clarke ID, Terasaki M, Bonn VE, Hawkins C, Squire J, and Dirks PB. 2003. Identification of a cancer stem cell in human brain tumors. Cancer Res. 63(18): 5821-5828.
2. Singh SK, Hawkins C, Clarke ID, Squire JA, Bayani J, Hide T, Henkelman RM, Cusimano MD, and Dirks PB. 2004. Identification of human brain tumour initiating cells. Nature. 432(7015): 396-401.
3. Bock NA, Zadeh G, Davidson LM, Qian B, Sled JG, Guha A, and Henkelman RM. 2003. High-resolution longitudinal screening with magnetic resonance imaging in a murine brain cancer model. Neoplasia. 5(6): 546-554.
4. Desmond KL, Moosvi F, and Stanisz GJ. 2014. Mapping of amide, amine, and aliphatic peaks in the CEST spectra of murine xenografts at 7 T. Magn. Reson. Med. 71(5): 1841-1853.
5. Boorstein JM, Wong KT, Grossman RI, Bolinger L, and McGowan JC. 1994. Metastatic lesions of the brain: imaging with magnetization transfer. Radiology. 191(3): 799-803.
6. Mathews VP, Caldemeyer KS, Ulmer JL, Nguyen H, and Yuh WT. 1997. Effects of contrast dose, delayed imaging, and magnetization transfer saturation on gadolinium-enhanced MR imaging of brain lesions. J. Magn. Reson. Imaging. 7(1): 14-22.
7. Ikezaki K, Takahashi M, Koga H, Kawai J, Kovacs Z, Inamura T, and Fukui M, Apparent diffusion coefficient (ADC) and magnetization transfer contrast (MTC) mapping of experimental brain tumor, in Brain Edema X1997, Springer. p. 170-172.
8. Watanabe T, Frahm J, and Michaelis T. 2010. Myelin mapping in the living mouse brain using manganese-enhanced magnetization transfer MRI. Neuroimage. 49(2): 1200-1204.
Figures
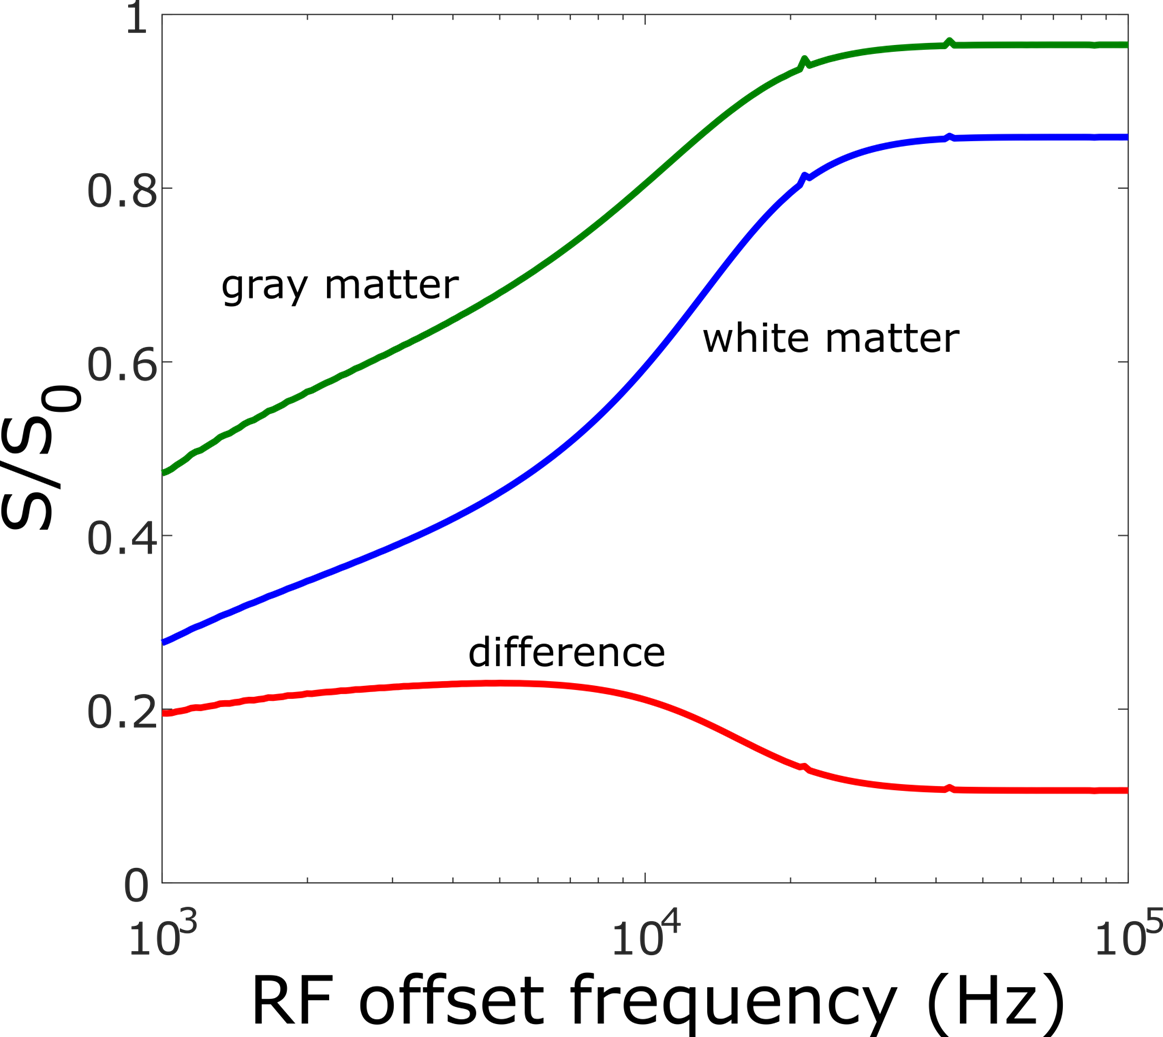
Figure 1: Simulation of MT contrast between mouse white and gray matter as a function of saturation pulse offset frequency for experimental sequence and tissue parameters at 7 T. There is a broad maxima surrounding the chosen offset of 2500 Hz.