0984
In vivo assessment of tumour invasion of the visual pathway in optic pathway glioma patients using multi-shell diffusion tensor MRI1Developmental Imaging & Biophysics Section, University College London, London, United Kingdom, 2Ophthalmology Department, Great Ormond Street Children’s Hospital, London, United Kingdom, 3Haematology and Oncology Department, Great Ormond Street Children’s Hospital, London, United Kingdom, 4Radiology Department, Great Ormond Street Children’s Hospital, London, United Kingdom
Synopsis
Optic pathway glioma (OPG) is a childhood tumour of the visual pathway. Some OPG patients remain stable, whereas others experience rapid visual decline; however, conventional MRI cannot stratify these patients. We used multi-shell DTI to measure tumour invasion of the optic pathway in 23 OPG patients, in conjunction with visual assessment. A strong correlation was found between fractional anisotropy in the optic nerves and optic radiations, and visual acuity (p=0.00092 and p=0.008 respectively). Our study demonstrates that multi-shell diffusion-MRI offers increased sensitivity over conventional MRI in detecting white matter integrity and function in the visual pathway of OPG patients.
Purpose
Optic pathway glioma (OPG) is a childhood tumour of the visual pathway. Patients tend to follow an unpredictable clinical course, with some remaining stable while others experience rapid visual decline. Currently, conventional imaging cannot predict the clinical course of OPG patients 1. In this study, we investigated whether multi-shell diffusion tensor imaging (DTI) could provide a novel biomarker for tumour invasion of the visual pathway in OPG patients.Methods
Data Acquisition
23 patients being treated for OPG at our institution were included in this study (median age 6.3 years). Patients received visual assessment and MRI, with visual acuity (VA) measured independently in each eye where possible, using the logMAR scale 2. Imaging was performed on a 3.0T Siemens Prisma MRI scanner, and the median interval between MRI and visual assessment was 16 days. In addition to conventional MRI sequences, a DTI acquisition was performed, using two shells of b=1000 s/mm2 and 2200 s/mm2 with 60 diffusion directions per shell, and isotropic 2mm voxel resolution.
Post-processing
Probabilistic tractography was used to dissect the visual pathway, using multi-tissue constrained spherical deconvolution (CSD)3 in MRtrix. For the optic nerves, seed regions of interest (ROIs) were placed at the intersection between the orbit and optic nerve. For optic radiations, seed ROIs where placed in the lateral geniculate nucleus, using the exclusion ROIs described in 4. Voxels containing >5% of the generated streamlines were used to define masks of the optic nerves and radiations. Median values of fractional anisotropy (FA), mean diffusivity (MD), and radial diffusivity (RD) were measured in these regions.
Statistical Analysis
Similar to 5,6, in patients where VA could not be quantified, perception of ‘hand movements’ was assigned a logMAR of 2.0, and ‘no perception of light’ assigned a logMAR of 3.0. Because optic nerves contribute to vision in a single eye, correlations between MRI and VA were performed on a ‘per-eye’ basis here. Conversely, as optic radiations contribute to vision in both eyes, median values were used across the left and right eyes/optic radiations combined.
Results
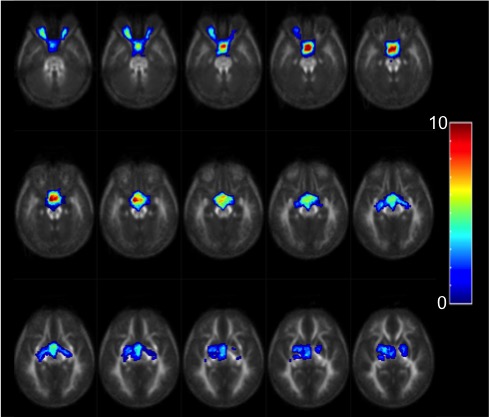
Figure 1 illustrates the anatomical variation in the frequency of tumour occurrence. The optic chiasm was the most frequently involved area (65% of patients), followed by optic nerve involvement (43% of patients), then optic tracts (17%) and optic radiations (17%).
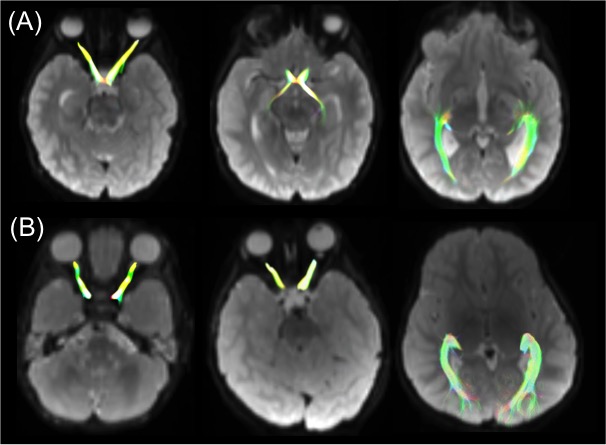
In 48% of patients, streamlines initiated in the optic nerves passed posteriorly through the optic chiasm, and into the optic tracts (Figure 2A). However in 52% of patients, tumour infiltration of the optic chiasm prevented the streamlines from continuing posteriorly through the chiasm (Figure 2B). As such, DTI parameters in the optic tracts were not considered in this analysis.
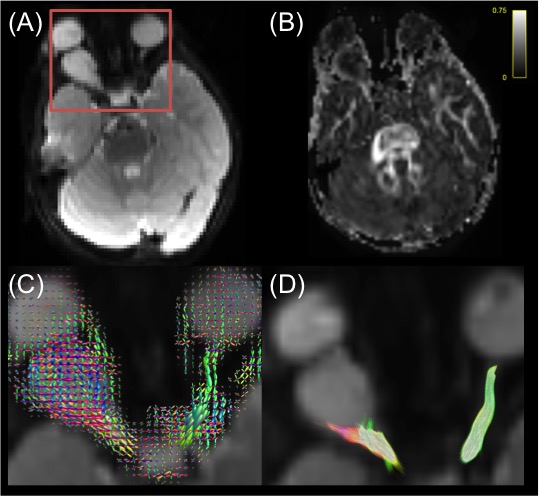
In all patients, at least part of both optic nerves could be identified using tractography. However, in cases of extreme tumour infiltration, tractography streamlines were unable to traverse the entire length of the optic nerve (Figure 3). In all patients, the entirety of both optic radiations could be identified using tractography.
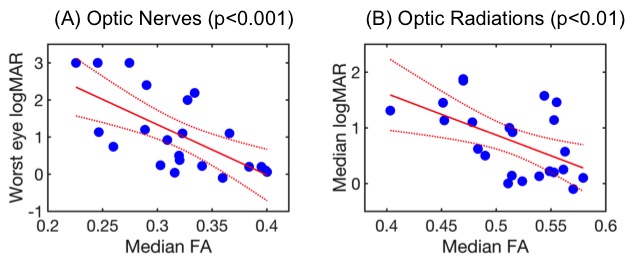
Linear regression analysis identified a strong negative correlation between median FA in the optic nerve for the eye with the worst vision, and the logMAR score in that eye (R2=0.43, p=0.00092, Figure 4A). A significant negative correlation was also found between the median FA of the combined optic radiations and the median logMAR score in both eyes (R2=0.29, p=0.008, Figure 4B). Median RD showed a significant positive correlation with VA, both in the optic nerves (R2=0.19, p=0.042) and in the optic radiations (R2=0.18, p=0.047). The patient’s age was not found to be a significant regressor in any of the above analyses (p>0.05).
Discussion
Our results show that white matter tract integrity in the optic pathway, measured by FA, is significantly associated with visual acuity loss in OPG patients. Significant correlations between FA and VA were found in the optic radiations, despite the lack of tumour involvement (on conventional MRI) in this region in most patients. This may represent microscopic / ‘sub-clinical’ tumour invasion, or anterograde trans-synaptic degeneration from disruption of visual input 6–8.
The use of multi-shell CSD allowed us to measure white matter tract integrity in the optic nerves, despite the difficulties caused by partial volume and susceptibility artefacts in this region 6. We believe that this is the first CSD-tractography study of optic pathway integrity in OPG patients.
Conclusion
Our study demonstrates that multi-shell diffusion-MRI offers increased sensitivity over conventional MRI in detecting white matter integrity and function in the visual pathway of OPG patients. This might provide a future quantitative prognostic biomarker of white matter disease in OPG patients.Acknowledgements
We thank Great Ormond Street Children’s Charity and Children with Cancer UK for funding this study.References
1 Aquilina K, Daniels DJ, Spoudeas H, Phipps K, Gan H-W, Boop FA. Optic pathway glioma in children: does visual deficit correlate with radiology in focal exophytic lesions? Childs Nerv Syst ChNS Off J Int Soc Pediatr Neurosurg 2015; 31: 2041–2049.
2 Sloan LL. New test charts for the measurement of visual acuity at far and near distances. Am J Ophthalmol 1959; 48: 807–813.
3 Jeurissen B, Tournier J-D, Dhollander T, Connelly A, Sijbers J. Multi-tissue constrained spherical deconvolution for improved analysis of multi-shell diffusion MRI data. NeuroImage 2014; 103: 411–426.
4 Dayan M, Munoz M, Jentschke S, Chadwick MJ, Cooper JM, Riney K et al. Optic radiation structure and anatomy in the normally developing brain determined using diffusion MRI and tractography. Brain Struct Funct 2013; 220: 291–306.
5 Tibbetts MD, Shah CP, Young LH, Duker JS, Maguire JI, Morley MG. Treatment of Acute Retinal Necrosis. Ophthalmology 2010; 117: 818–824.
6 de Blank PMK, Berman JI, Liu GT, Roberts TPL, Fisher MJ. Fractional anisotropy of the optic radiations is associated with visual acuity loss in optic pathway gliomas of neurofibromatosis type 1. Neuro-Oncol 2013; 15: 1088–1095.
7 Lober RM, Guzman R, Cheshier SH, Fredrick DR, Edwards MSB, Yeom KW. Application of diffusion tensor tractography in pediatric optic pathway glioma. J Neurosurg Pediatr 2012; 10: 273–280.
8 Beatty R, Sadun A, Smith L, Vonsattel J, Richardson E. Direct demonstration of transsynaptic degeneration in the human visual system: a comparison of retrograde and anterograde changes. J Neurol Neurosurg Psychiatry 1982; 45: 143–146.
Figures