0983
Recurrent Neural Network on DCE-MRI in Prostate Cancer1GE Global Research Center, Niskayuna, NY, United States, 2GE Global Research Center, Bengaluru, India, 3Memorial Sloan-Kettering Cancer Center, NY, United States
Synopsis
DCE-MRI has become an important protocol in mpMRI analysis of prostate cancer and it has been quantified typically using pharmaco-kinetic modelling and the estimated parameters are then used with other approaches (machine learning or deep learning (DL)) to characterize/discriminate tumor tissue against healthy tissue. However, it is not clear if applying DL to the DCE-MRI time series directly is beneficial for prostate cancer detection. Hence, we propose a DL based method to differentiate prostate tumor from healthy tissues at the voxel level using raw arbitrary signal DCE time-series itself. Overall, DL based tumor characterization provided similar detectability for prostate tumor when compared to Ktrans and ve maps. We also evaluated differences in tumor characterization when contrast agent concentration time-curves were used instead of arbitrary signal curves and found them to provide similar detectability.
PURPOSE
Dynamic contrast enhanced MRI (DCE-MRI) has become an important component in multi-parametric MRI (mpMRI) assessment of prostate cancer and pharmaco-kinetic (PK) modeling of DCE data is commonly used to quantify tumor vascular properties (permeability and leakage coefficient, Ktrans, and extra-vascular extracellular compartment fraction, ve). Recently, deep learning (DL) algorithms have been applied to the extracted physiological parameters for cancer detection or outcome prediction [1]. However, it is not clear that if applying DL on the DCE signal time series directly is beneficial in prostate cancer detection. Hence, here we proposed a method which employed deep recurrent neural network (RNN) [2] on the DCE time series to differentiate prostate tumor from healthy tissues at voxel level. We also compared if the tumor detection ability was affected between using the original DCE-MRI signal and the contrast agent concentration, and further investigated the correlations between the probability estimated by the DL and the parameters estimated by PK model.METHODS
Patient Data: The study included 14 patients with prostate cancer Gleason score 6 to 9 enrolled in an IRB-approved study. All DCE-MRI examinations were performed on a 3T DISCOVERY MR 750 MRI scanner (GEHC, Waukesha, WI, USA). DCE protocol was: axial slices, 3D EFGRE, EIS TORSO coil, TE/TR = 1.2/3.4 ms, 256x256x12 matrix, 240 x 240 mm2 FOV, 30 bolus volumes. PK Analysis: DCE time course data was converted from arbitrary signal units into contrast agent concentration units and concentration data was fit to two-parameter (Ktrans, ve) Toft’s model using a population based AIF [3][4]. RNN Analysis: The DCE-MRI signal intensity time courses reflect tumor characteristics, and therefore, the Gated Recurrent Unit (GRU) was employed because its networks with loops allow to exhibit dynamic temporal behavior. First, the tumor ROIs were delineated by a radiologist and treated as the ground truth. The prostate gland was segmented manually and all the analyses performed on the voxels within the prostate mask. The DCE-MRI time series data was normalized before they were input to the proposed model. The proposed model included 500 GRUs with 60% dropout, followed by 200 fully connected NN layers. The output of the model was the probability of the voxel being malignant. There were around 100,000 voxels for all subjects and the 10-fold cross validation was used to train and test the model. In addition to the original signal intensity DCE time series, the contrast agent concentration was also input to the model to investigate if the concentration could lead to a better classification. PK model and RNN probability based tumor detection: The generated probabilities by the proposed RNN method, combined with Ktrans and ve, were input to a Logistic Regression (LR) based model to see if the combined three features could improve the ability of cancer detection. The correlation between the probabilities and Ktrans and ve values were also explored.RESULTS
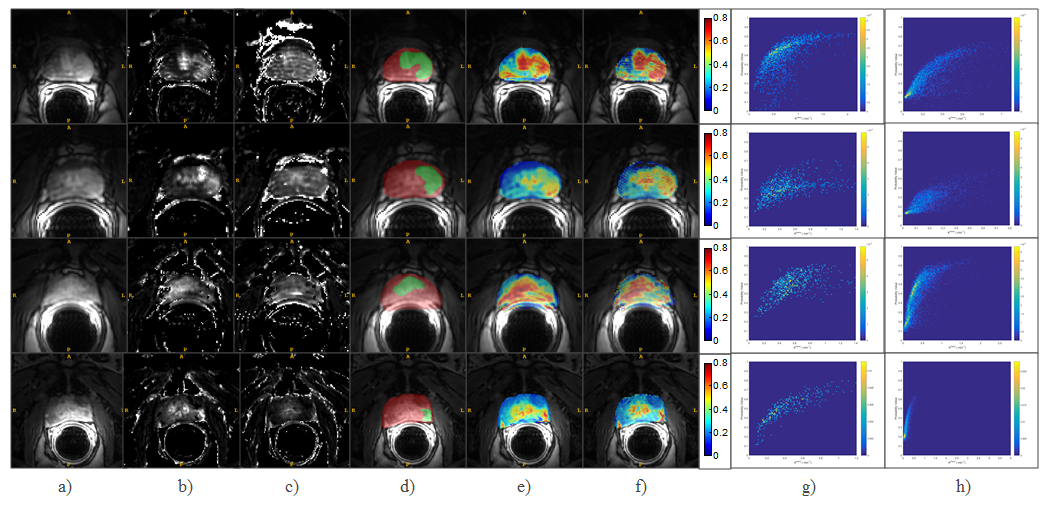
Figure 1 shows the results for four subjects: a) – f) the averaged post-contrast DCE-MRI, Ktrans, ve, DCE with the ground truth (red: prostate gland tissue, green: tumor ROI) superimposed, DCE with the probability map generated from the original signal, DCE with the map from the concentration time courses, histogram plots between Ktrans and probabilities generated by the original DCE signals for tumor voxels (g) and non-tumor voxels (h), respectively. The histograms for the concentration were similar with the ones using the original signals.
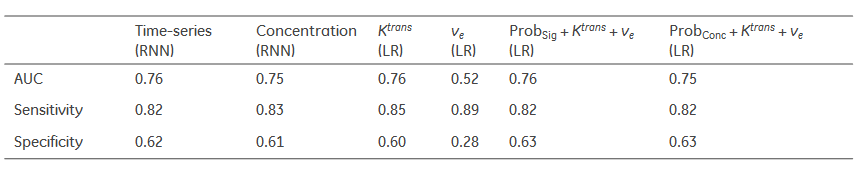
Table 1 summarizes the ability of cancer detection for different models. The signal time series and concentration yielded very similar AUCs, as well as Ktrans applied in the LR model. ve had the weakest performance. After combining the risk maps with Ktrans and ve, those three features in the LR model did not improve the performance.
DISCUSSION
The study explored the DCE-MRI data using the RNN and further investigated the correlations between the original DCE signals and physiological parameters. The results demonstrated that the RNN could extract the inherent features in the original DCE data, learn the shape characteristic of the tumor curves, and provide a very close performance in cancer detection, compared with Ktrans derived from the pharmacokinetic model. The similar ROC outcomes also indicated that the information explored using RNN was related to the tumor physiological parameters and they had the same ability to detect cancer. Combing all parameters did not add new information in separating tumor voxels from normal tissues. The moderate AUCs from the DCE-MRI could be improved via conjunction with mpMRI, especially ADC. Further investigation and validation were needed to study if DL could replace kinetic models in clinical outcome prediction.Acknowledgements
No acknowledgement found.References
1. Shen S, Zhong X, Hsu W, et al., Quantitative MRI-Driven Deep Learning for Detection of Clinical Significant Prostate Cancer, ISMRM 2016, 0584.
2. Cho K, Bahdanau D. Bougares F. et al., Learning Phrase Representations using RNN Encoder–Decoder for Statistical Machine Translation. arXiv:2014,1406.1078 [cs.CL].
3. Huang W, Li X, Chen Y, et.al; Variations of Dynamic Contrast-Enhanced Magnetic Resonance Imaging in Evaluation of Breast Cancer Therapy Response: A Multicenter Data Analysis Challenge. Translational Oncology 2014;7(1):153-166.
4. Morgan B, Utting J, Higginson A, et al., A simple, reproducible method for monitoring the treatment of tumours using dynamic contrast enhanced MRI. Br J Cancer 2006;94:1420–1427.
Figures