0982
3D printed Breast DCE-MRI phantom to mimic structure and pharmacokinetics1Medical Imaging Research Centre, Dayananda Sagar Institution, Bangalore, India, 2Wipro GE healthcare, Bangalore, India
Synopsis
DCE MRI plays a critical role in routine clinical breast examination. Current work focuses on the development of Breast DCE MRI phantom using a 3D printer to mimic poor and well perfused regions. The phantom developed was controlled through user entered Ktrans values entered in a GUI which interfaced with a peristaltic pump to control flow rates. The Kep parameters was controlled through the 3D model geometry. Prospective MR images of the phantom were acquired on a 1.5T scanner using the TRICKS sequence; and pharmacokinetic maps based on Tofts model were computed and quantified.
Purpose
DCE-MRI provides critical information on both tumor morphology and pharmacokinetics. These image derived parameters enable diagnosis and monitoring of therapeutic response. The objective of this work was to develop a Breast MR DCE phantom that enable mimicking poor and well perfused tissue regions. The phantom was designed to allow for user interface (UI) programmable values of Ktrans and control of Kep through 3D printed models. The goal of the work was to enable correlation of signal intensity curves and PK parameters obtained from the programmed phantom setup to that of semi-quantitative and PK modeling analyses post-acquisition.Methods and Materials
A Breast DCE-MRI phantom was designed using Dimension Dual Delta 3D printer (J Robotics Pvt Ltd). Fig. 1 shows the diagram of phantom printed (A, B). Top part in Fig.1a was downloaded from ref1 and was printed to mimic breast morphology. The bottom part in Fig.1b consists of tumour mimicking geometry design which was designed using 123d Autodesk® software. This consisted of the two cylinders as shown in Fig. 1(d). These cylinders enabled the control of the wash-out characteristics. Fig. 1 depicts the phantom parts along with dimensions. The phantom was connected to a peristaltic pump and water reservoirs. The top part of the phantom was filled with 2% agar solution to mimic tissue (w/v). These connections and the setup is shown in Fig 2. Tap water was continuously pumped into the phantom using the pump which was controlled via user entered Ktrans values in Matlab (the Mathworks Inc) GUI, Ktrans values of 1.5 min-1 (inner cylinder) and 0.5 min-1 (outer cylinder) were entered. These values were employed to calculate the flow rate (ml/min) to be pumped from the peristaltic pump (e.g.1.5 ml/s * 60=90 ml/min). Kep values were controlled through: the inner ring was designed in such way that CA and water filling inside the inner cylinder took more time to discharge due to the increased depth. CuSO4 of six different concentrations (shown in Fig. 3) were prepared and T1 maps were determined using the variable flip angle method (TR=6.8/6.8/6.7/6.9/7.1/7.3 ms, FA=2/10/20/30/45/60). R1 as a function of concentration was plotted and slope of the line was calculated to determine the relaxivity of Contrast Agent (CA). CuSO4 of 6 mmol concentration was employed as CA. Phantom experiments were conducted on a 1.5T GE SIgna scanner. Images were acquired using TRICKS sequence2 with parameters of TR/TE= 6.088/2.296, FA=20, number of frames=100 with temporal resolution of 6s. CA was injected after 1/2 min. Concentration time curves were calculated from the obtained signal intensity images and were analyzed by the two compartmental Tofts model to determine the pharmacokinetic maps.Results
T1 map for the different concentration of CuSO4 is depicted in Fig. 3. It can be noticed that the 6 mmol CuSO4 concentration has the shortestT1 values as expected. The value of relaxivity determined was 0.6 s-1mmol-1 . Fig. 4 depicts the signal intensity images of particular frames and concentration map for that corresponding frames. It can be noticed that there was no enhancement in the baseline frames. The injection of CA induced a gradual enhancement in the rings (outer ring with maximum enhancement and inner ring with lesser enhancement). Pharmacokinetic maps obtained from Tofts model is depicted in the Fig. 5a. It can be observed that outer ring had greater Ktrans values compared to inner ring as expected. Concentration time curve graphed for the respective ROI is depicted in the Fig.5b. It can be noticed that outer ring (ROI3) had the maximum wash-in phase compared to inner ring (ROI1 and ROI2). Behaviour of the ROI1 is similar to that of necrotic region, where CA slowly accumulates over time and does not wash out quickly.Discussion
A Breast DCE MRI phantom that mimics different pharmacokinetic curves has been developed using the 3D printer. Increased Ktrans value entered in the GUI corresponds to the increased flow rate to the inlet of the phantom. Ktrans values of 90,30 ml/min for outer/inner ring was entered in GUI and the mean outer/inner Ktrans value obtained from the curve fitting using Tofts model was 0.56/ 0.0041 min-1. In conclusion, a semi-automated user controlled GUI based phantom has been developed. Different types of kinetic curves can be obtained based on user entered Ktrans value. Future work involves creating the look up table based on the GUI entered Ktrans values and the obtained Ktrans/Kep values to determine accurate flow rates of the peristaltic pump.Acknowledgements
Department of Science and Technology(DST). DST/TSG/NTS/2013/100References
[1] https://uwcem.ece.wisc.edu/phantomRepository.html
[2] Petkova et al. JMRI 2009
Figures
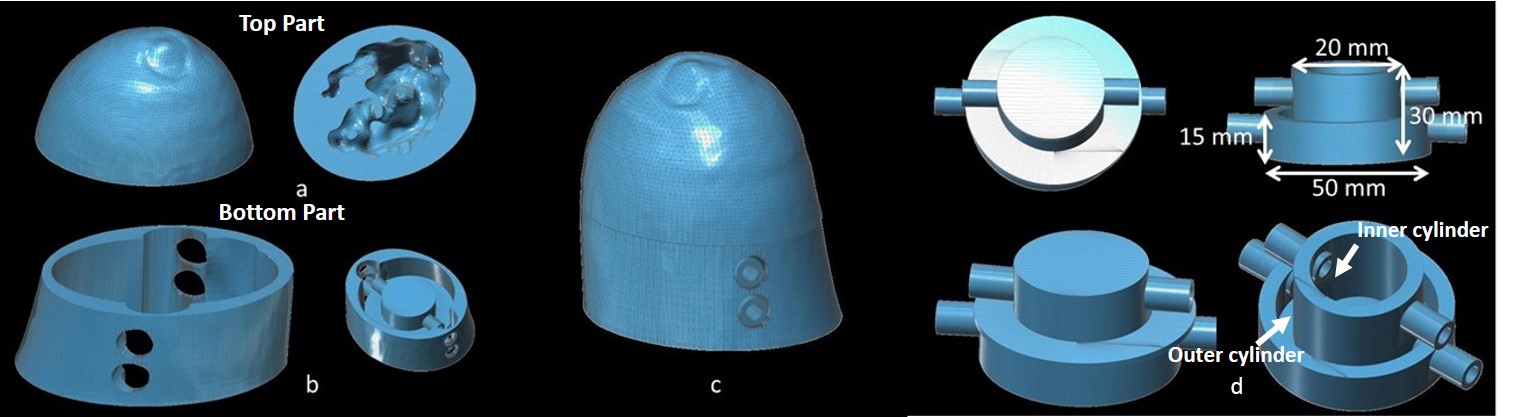
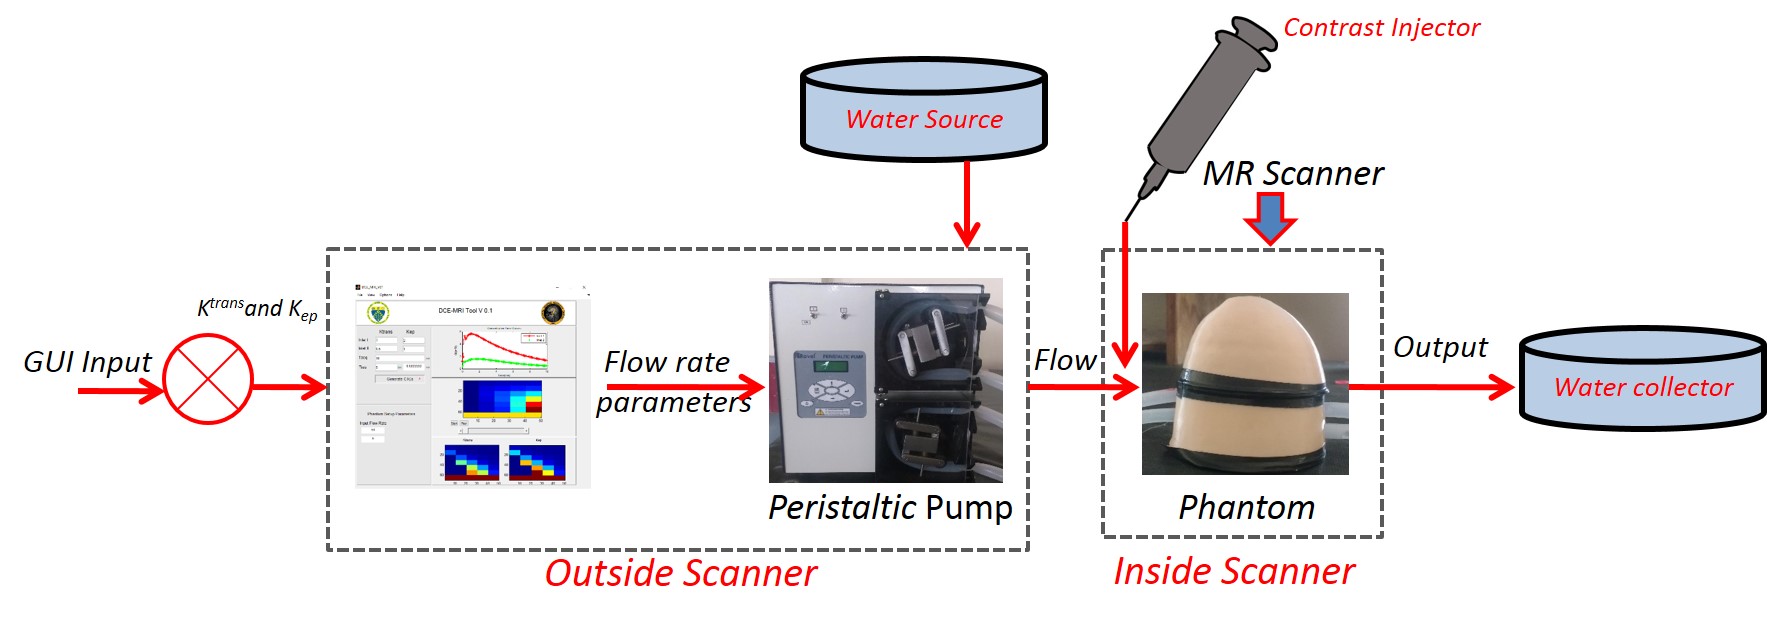
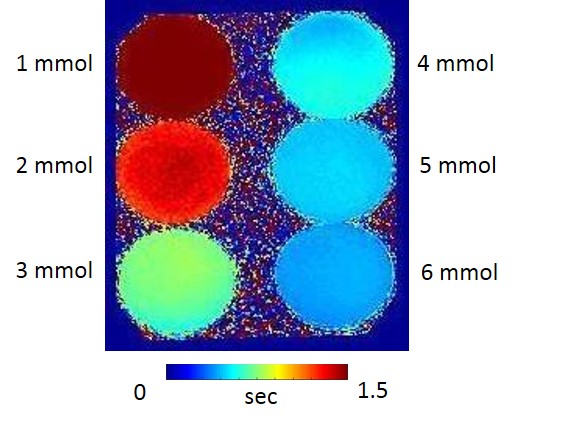
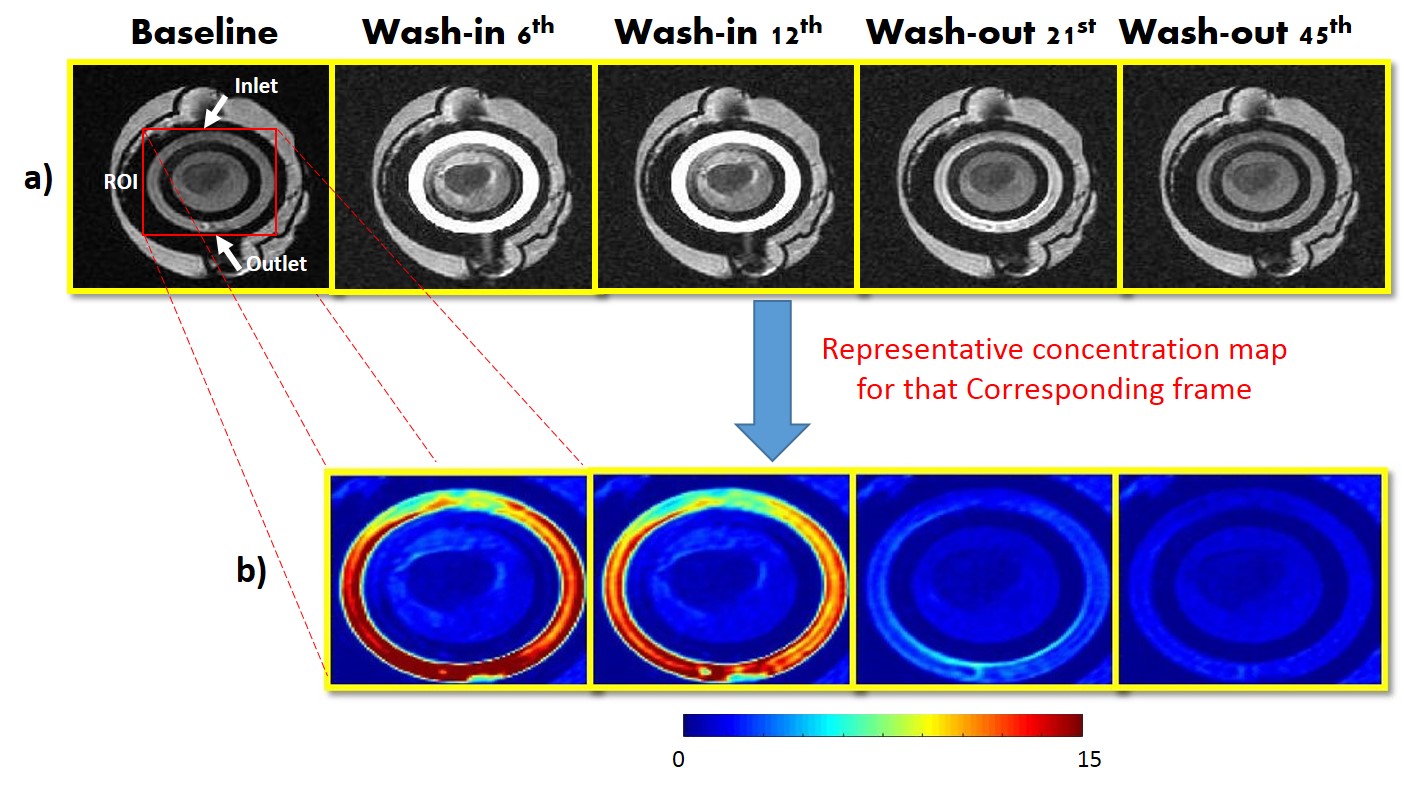
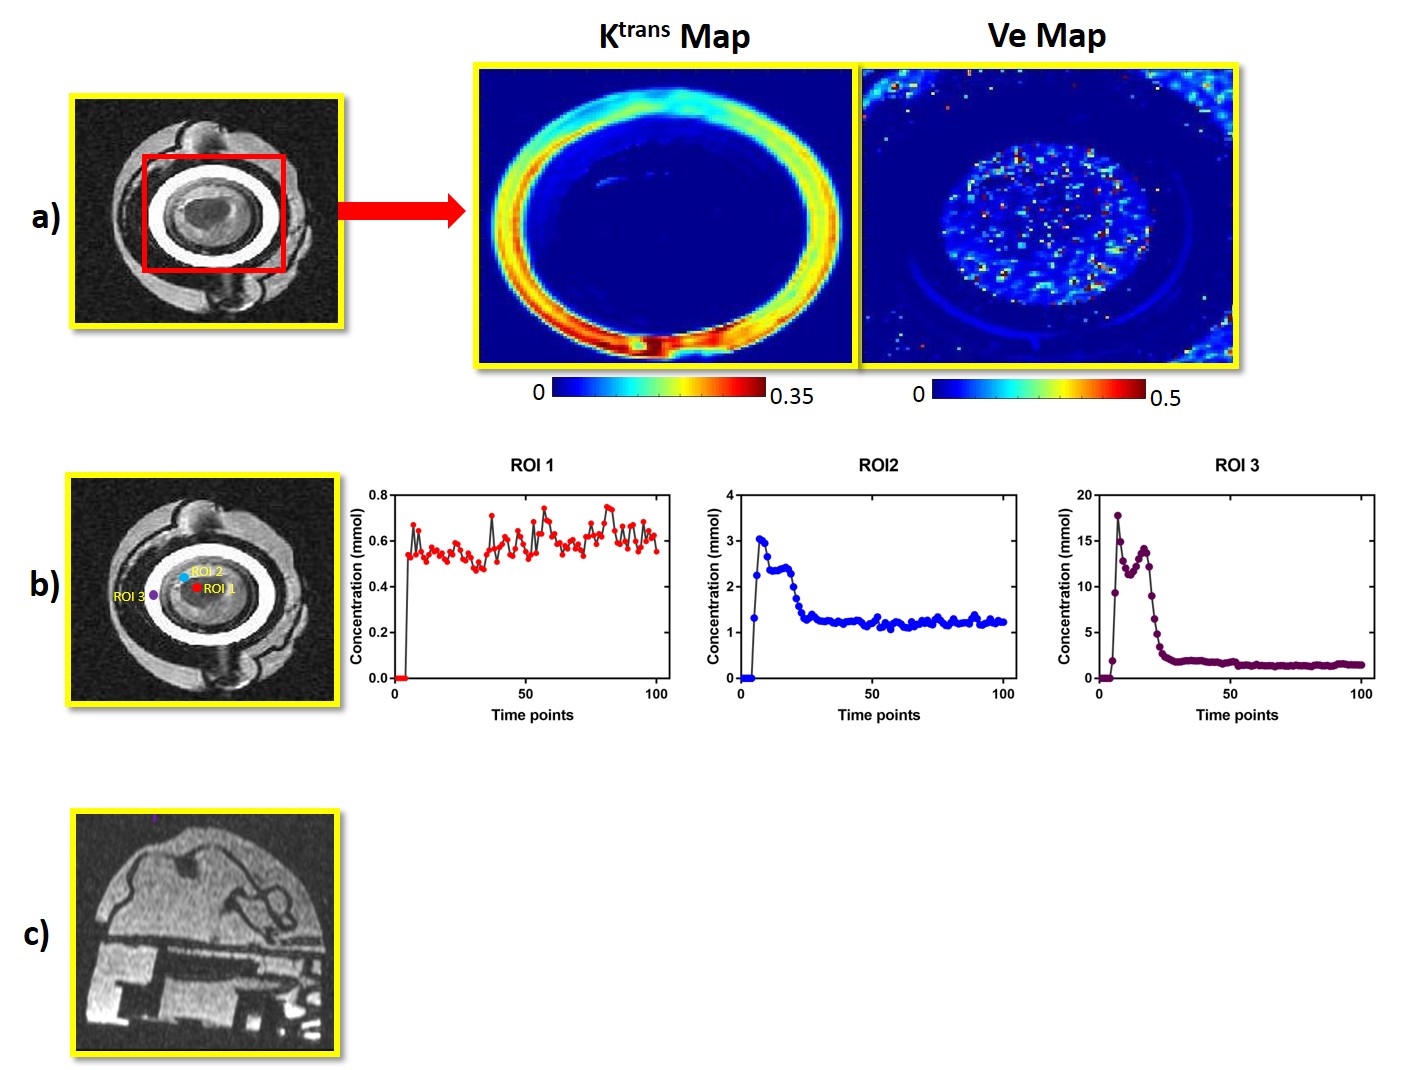
Figure 5 a) The Pharmacokinetic maps obtained from Tofts model b) Concentration time curves for three different ROI drawn in the image c) Signal intensity image of Breast DCE MRI phantom from different view
*Note: Y axes representing concentration time curves are different for the three plots