0981
Dynamic Glucose Enhanced MRI - A prospective study in healthy volunteers and glioblastoma patients1Radiology, German Cancer Research Center, Heidelberg, Germany, 2Medical Physics in Radiology, German Cancer Research Center, Heidelberg, Germany, 3Neurology, University Hospital Heidelberg, Heidelberg, 4Neuroradiology, University Hospital Heidelberg, Heidelberg, 5Max-Planck-Institut Tübingen, Tübingen, Germany
Synopsis
Glucose is the main energy source of cancer cells to proliferate and survive. Recently, promising results to assess changes in cellular metabolism using natural unlabeled D-glucose as biodegradable MRI contrast agent, have been reported employing Chemical Exchange Saturation Transfer (CEST) and Chemical Exchange sensitive Spin-Lock (CESL) imaging. In this work, the CESL-based dynamic glucose enhanced (DGE) contrast was investigated in healthy volunteers and a homogenous cohort of newly diagnosed untreated glioblastoma patients at 7 Tesla. DGE MRI allowed for sensitive visualization of physiological glucose uptake in the healthy human brain and pathophysiologically increased glucose enhancement of brain tumors.
Purpose
A first demonstration of the feasibility of dynamic glucose enhanced (DGE) magnetic resonance imaging (MRI) in the human brain was recently reported by Xu et al. using a CEST-based approach (1) and by Schuenke et al. using a T1ρ-based CESL technique (2), both at 7 Tesla (7T). The purpose of this study was to prospectively investigate the T1ρ-based DGE contrast at 7T in healthy volunteers and a cohort of newly diagnosed untreated glioblastoma patients.Materials & Methods
Ten newly diagnosed glioblastoma patients (7 male, 3 female, mean age 62.9 years) and four healthy volunteers (1 female, 3 male, mean age 24.0 years) were included in this prospective ethic approved study. Inclusion criteria for volunteers and patients were non-diabetic (self-reported and HbA1c<6.5%), aged 18 years or older, and eligibility for 7 T MRI. All subjects were asked to fast for a period of 6 to 8 hours prior to MRI.
Dynamic glucose enhanced MRI was performed at a 7T whole-body scanner (Magnetom 7T; Siemens Healthcare, Erlangen, Germany) using an adiabatically prepared chemical exchange sensitive spin-lock (CESL) sequence with a centric-reordered single-shot gradient echo (GRE) readout (temporal resolution=7 s, matrix=128x104, FoV=22x178 mm², TE=3.61 ms, TR=23 ms, flip angle=10°, slice thickness=5 mm) as proposed in Schuenke et al. (2). 100 ml of 20 % D-glucose were injected via the cubital vein in the course of DGE MRI. The T1ρ-based dynamic glucose enhanced contrast (DGEρ) is defined as the relative signal change between the signal acquired at time point t, and a reference signal obtained by averaging approximately 20 baseline measurements before the glucose injection. All data analyses were performed using in-house software developed in MATLAB (R2015b, Natick, Massachusetts: The MathWorks Inc.) as described in Ref. (2).
A high-resolution T2-weighted (T2-w) turbo-spin-echo (TSE) sequence (resolution=0.4x0.4x2 mm³, TE=54 ms, TR=12340 ms) and a T1-w magnetization-prepared rapid gradient-echo (MRPAGE) sequence (resolution=1.0x1.0x1.0 mm³, TE=3.57 ms, TR=1770 ms) were additionally carried out at 7T. From all glioblastoma patients, gadolinium enhanced (GDE) T1-w images (resolution=0.78x0.78x1 mm³, TE=3.57 ms, TR=1770 ms) were obtained along the clinical standard MRI protocol at 3T.
DGEρ was quantitatively investigated in cerebral gray matter structures of healthy volunteers and tumor tissue of glioblastoma patients. Mean DGEρ signal intensities of the glucose enhanced tumor regions at peak signal intensity were compared to white matter regions using paired student's t-test.
Results
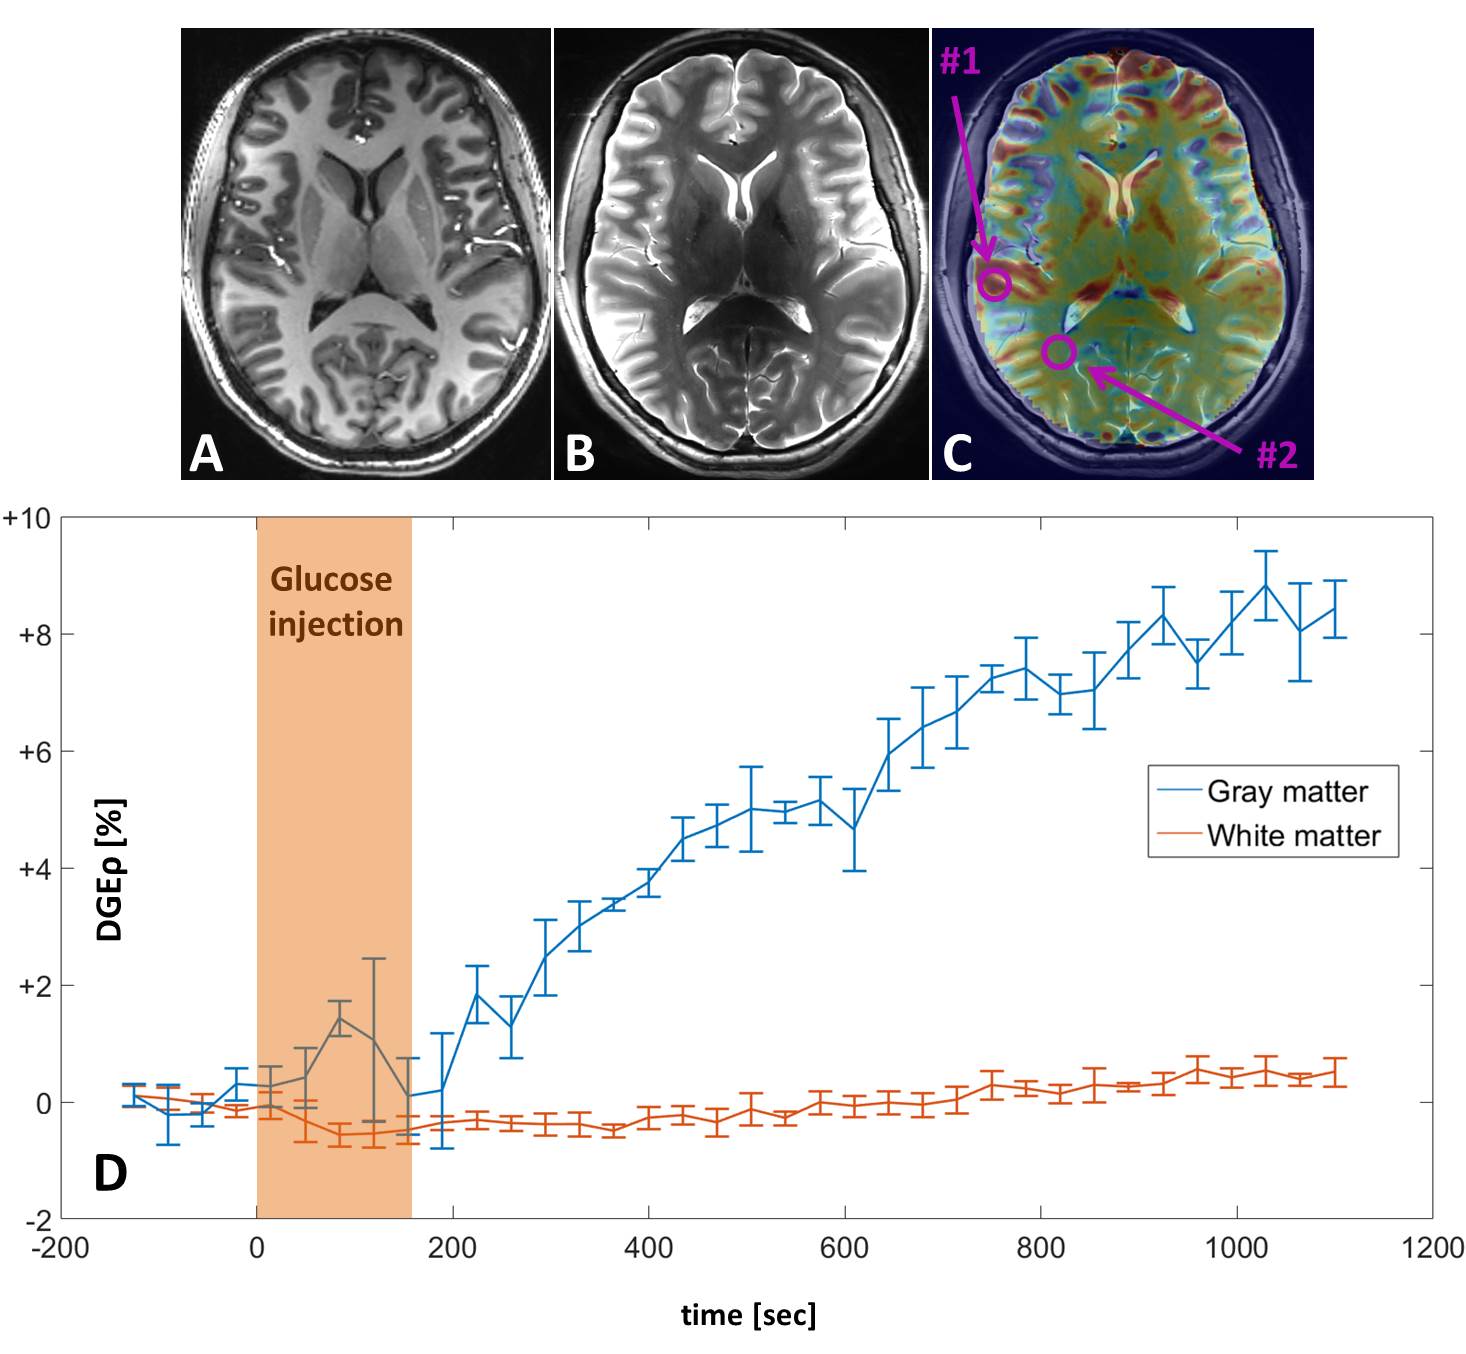
First of all, no adverse effects were observed in patients and volunteers related to glucose injections. DGE MRI applied to four healthy volunteers revealed an increased glucose uptake in the basal ganglia, the choroid plexus, and gray matter regions of the cortex of the normal human brain (Fig 1A-C). A continuous signal increase was observed in the investigated gray matter regions over the entire period of data acquisition of up to 20 min (Fig. 1D).
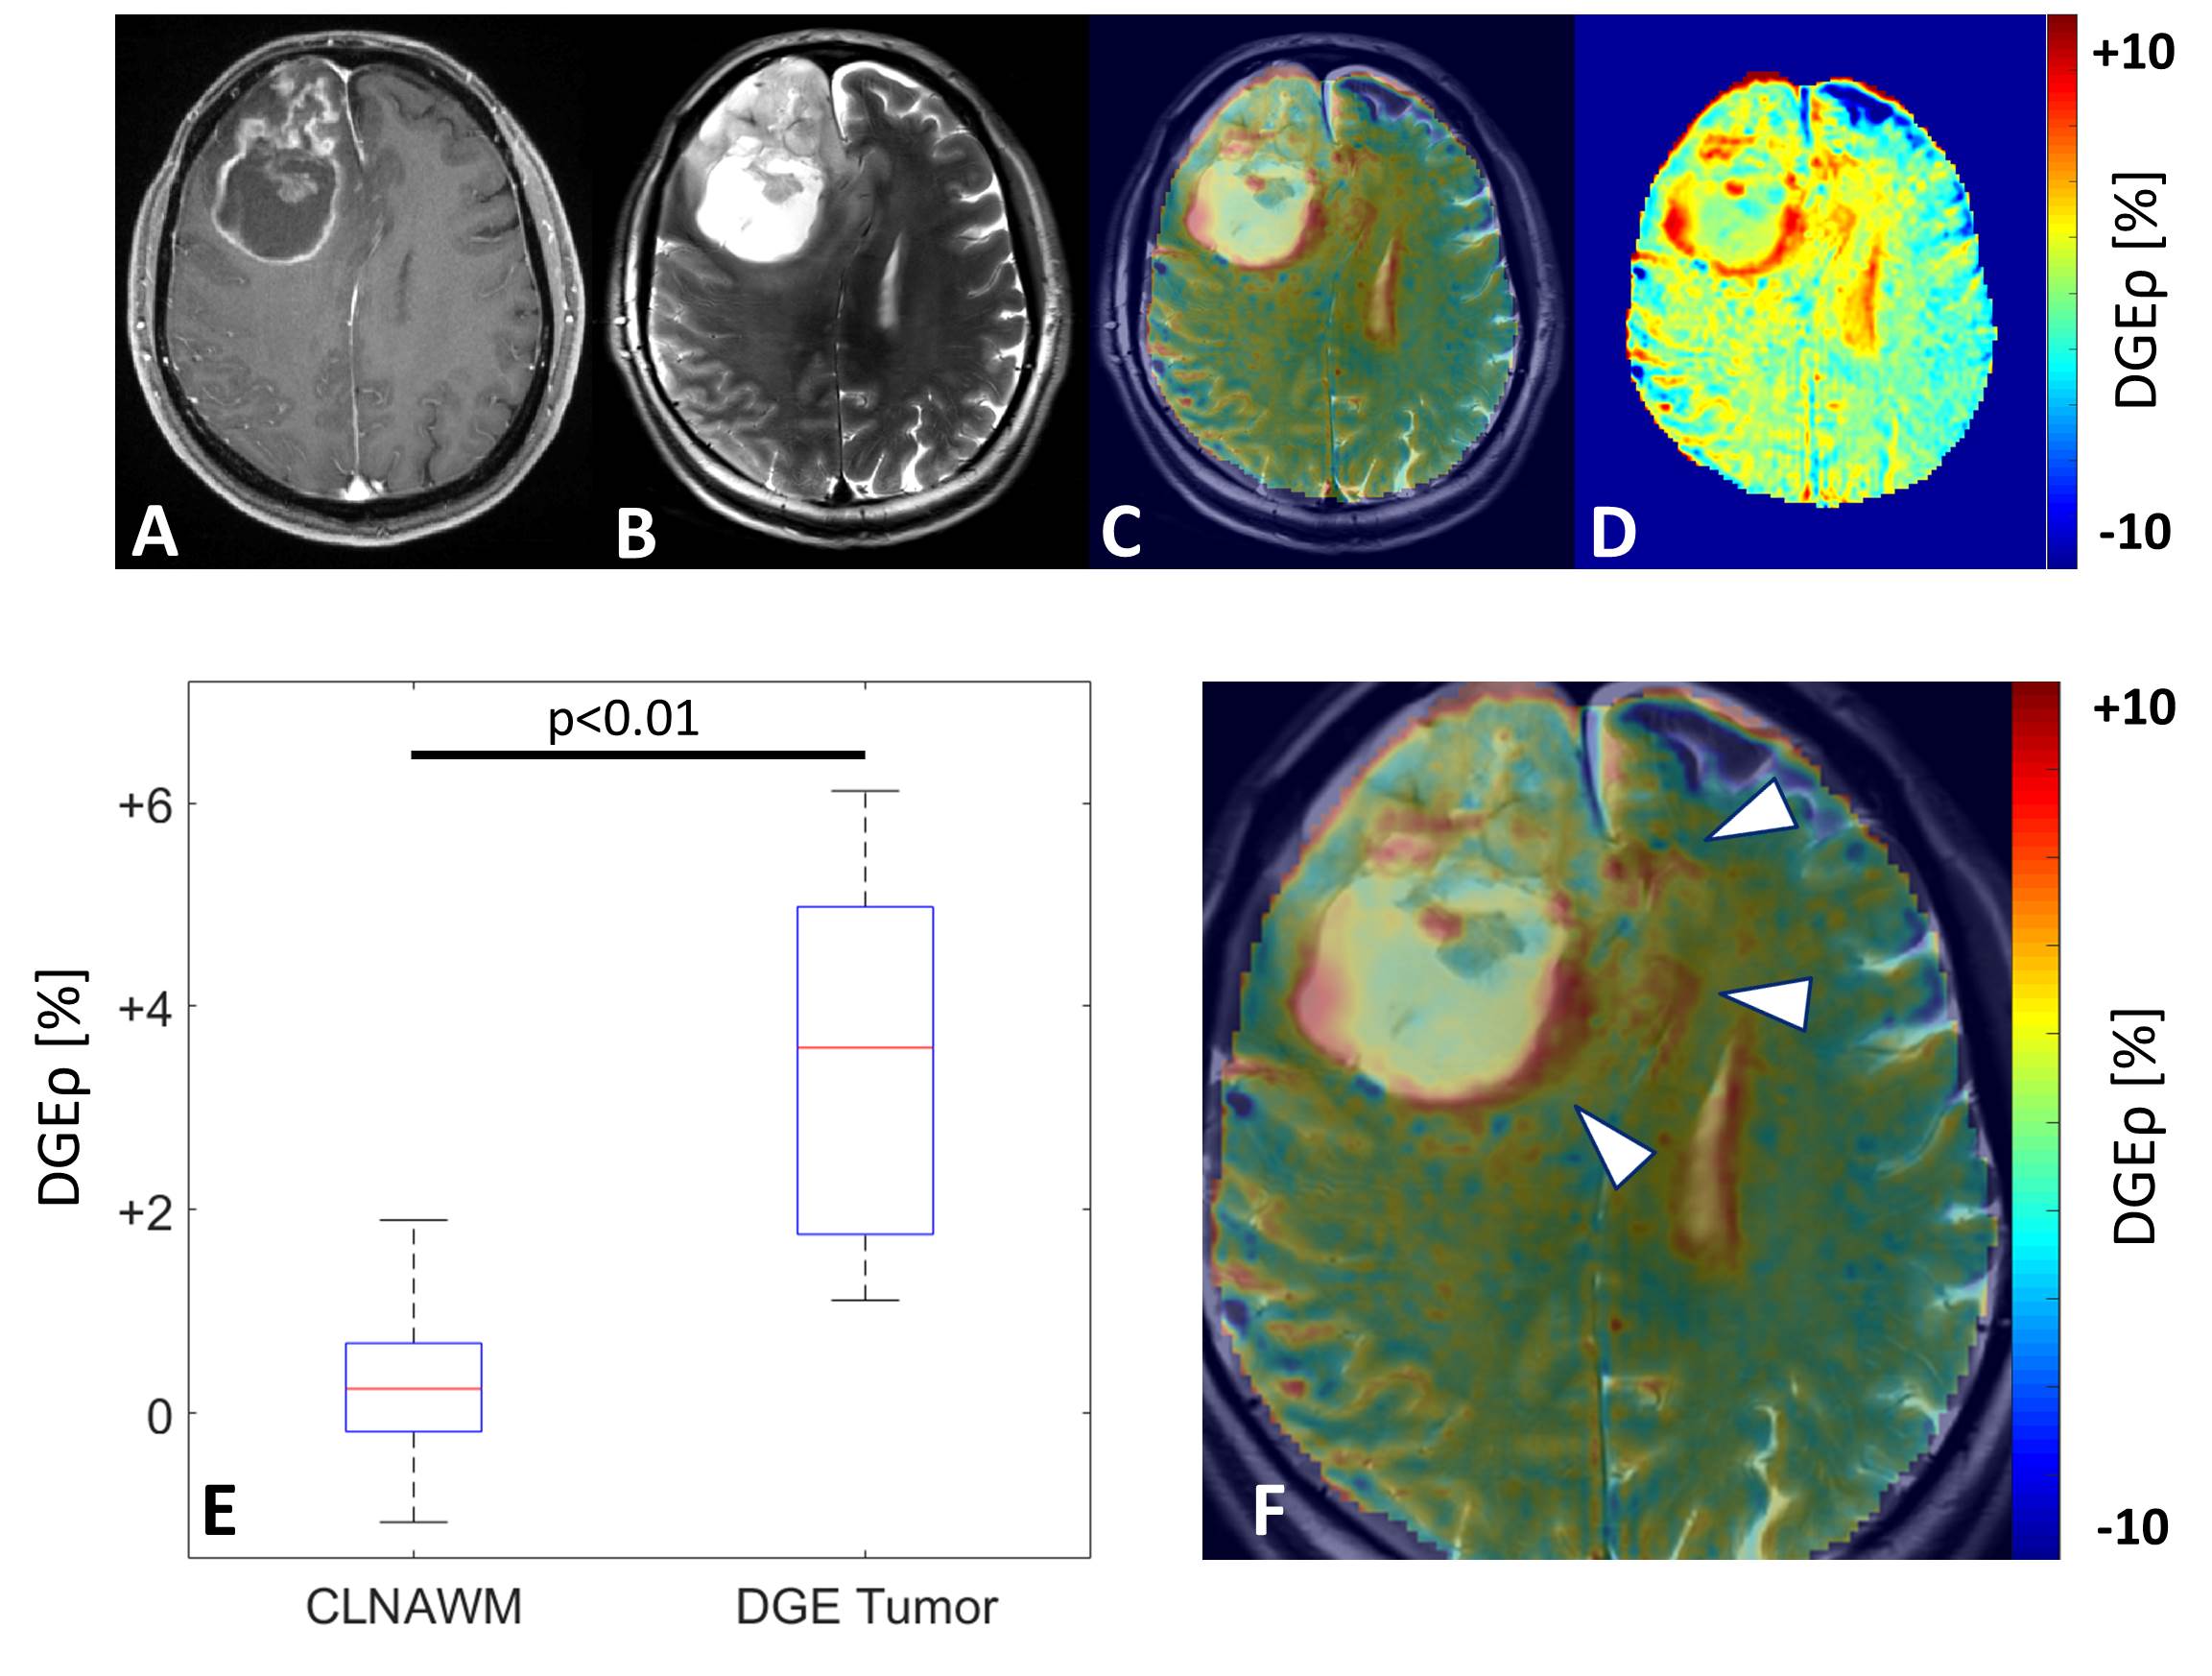
Further, the DGE contrast allowed for the identification of increased glucose uptake in a brain region which directly corresponded to the tumor area in all patients (Fig. 2). The mean signal intensity of the glucose enhancing tumor region over all patients (DGEρ=3.57±1.79%) was significantly higher than in contralateral normal appearing white matter (DGEρ=0.22±0.80%) (p<0.01) (Fig. 2E). Adjacent to the gadolinium ring-enhancement, pronounced hyperintensities were observed on DGEρ images revealing areas of increased glucose uptake beyond the borders of the disrupted blood brain barrier (BBB) (Fig. 2F).
Discussion
Our observation of physiological glucose uptake of human brain gray matter by means of DGE MRI is supported by the results of Jin et al. who reported increased signal intensities in gray matter structures of the rat brain after 2-deoxy-D-glucose administration (3). The finding that the glucose enhancing areas of glioblastoma differed from those on standard GDE T1-w images in our study cohort is in agreement with the initial results of Xu et al. (1) and Schuenke et al. (2) in glioblastoma patients. Moreover, Walker-Samuel et al. could not find a significant correlation between the enhancements on DGE MRI and GDE T1-w images in animal studies (4). Consequently, DGE MRI may provide complementary information about the metabolic heterogeneity of tumors compared to standard MRI protocols.Conclusion
DGE MRI may enable the detection of region specific glucose uptake in tumors, with implications for biopsy targeting, patient therapy and response monitoring. Furthermore, glucose enhanced MRI could open up the field of metabolic imaging without the limitations set by ionizing radiation and high expenses associated with radioisotopes. However, the full diagnostic value of dynamic glucose enhanced MRI has to be evaluated in future studies with optimized protocols and in larger patient collectives.Acknowledgements
No acknowledgement found.References
1. Xu X et al. Dynamic Glucose-Enhanced (DGE) MRI: Translation to Human Scanning and First Results in Glioma Patients. Tomography: a journal for imaging research 1, 105 (2015).
2. Schuenke P et al. Adiabatically prepared spin-lock approach for T1ρ-based dynamic glucose
enhanced MRI at ultrahigh fields. Magnetic Resonance in Medicine. 2016; DOI: 10.1002/mrm.26370
3. Jin T et al. Glucose
metabolism-weighted imaging with chemical exchange-sensitive MRI of
2-deoxyglucose (2DG) in brain: sensitivity and biological sources. NeuroImage. 2016; DOI: 10.1016/j.neuroimage.2016.08.040
4. Walker-Samuel S et al. In vivo imaging of glucose uptake and metabolism in tumors. Nature Medicine 2013;19(8):1067-72.
Figures