0980
Multi-modal and multi-scale measurement of metabolism in vivo in a breast cancer model1Medical Physics, University of Wisconsin - Madison, Madison, WI, United States, 2Medical Engineering, Morgridge Institute for Research, Madison, WI, United States, 3Laboratory for Optical and Computational Instrumentation (LOCI), University of Wisconsin - Madison, Madison, WI, United States, 4Cell and Regenerative Biology, University of Wisconsin - Madison, Madison, WI, United States, 5UW Carbone Cancer Center, Madison, WI, United States, 6Biomedical Engineering, University of Wisconsin - Madison, Madison, WI, United States, 7Radiology, University of Wisconsin - Madison, Madison, WI, United States
Synopsis
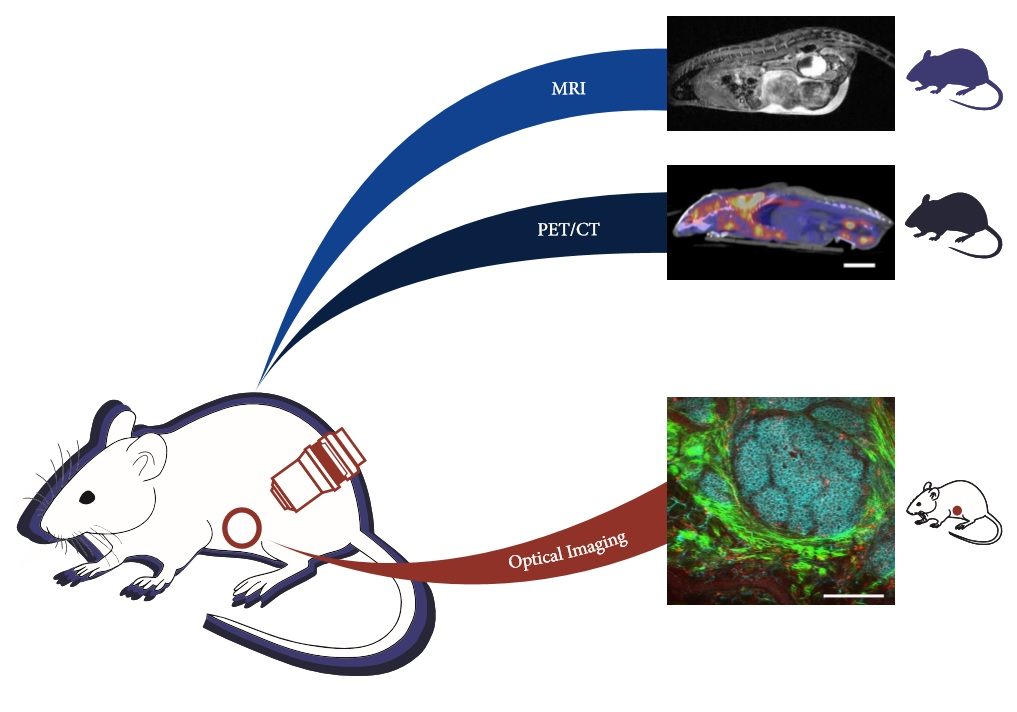
Performing MRI, PET/CT, and optical imaging at the cellular scale in vivo provides highly complementary information as a powerful tool to study cancer metabolism. Recent development of implanted optical windows allows for optical imaging in vivo. Here, we demonstrate multi-modal and multi-scale imaging of tumor progression in a mouse model of breast cancer by performing optical imaging through an implanted window, and whole-body MRI and PET/CT in a single day. The challenge of PET-MR registration is also addressed using dual-PET-MR fiducial markers embedded in a custom-imaging tray.
Purpose
Understanding the role of tumor metabolism in cancer progression is important for developing and selecting new therapy approaches to improve patient survival. There are multiple techniques to measure metabolism in vivo, including optical imaging of metabolic fluorophores1,2, magnetic resonance imaging (MRI) of hyperpolarized 13C-labeled metabolites3,4, and positron emission tomography (PET) with a variety of metabolic tracers5,6. Combining these complementary techniques would provide unique insights into tumor metabolism at the cellular and macroscopic scales. Here, we present a multi-modal and multi-scale study of tumor progression in vivo, with optical imaging at the cellular scale using optical microscopy, and micro-PET/CT and micro-MRI at the whole body scale in the same animal (Figure 1).Methods
Two wild type and four tumor-bearing mice (2 early-stage and 2 late-stage MMTV-PYVT breast cancer7), were imaged in this study. MR-compatible optical imaging windows were implanted subcutaneously8 over a growing tumor (tumor-bearing) or a mammary pad (wild type) prior to all imaging. A wild type mouse without an optical window was imaged for PET-MR registration data. Mice were anesthetized with inhaled isoflurane and an additional shot of etomidate was used to further restrict motion for optical imaging. All experiments complied with institutional animal care and use and committee regulations.
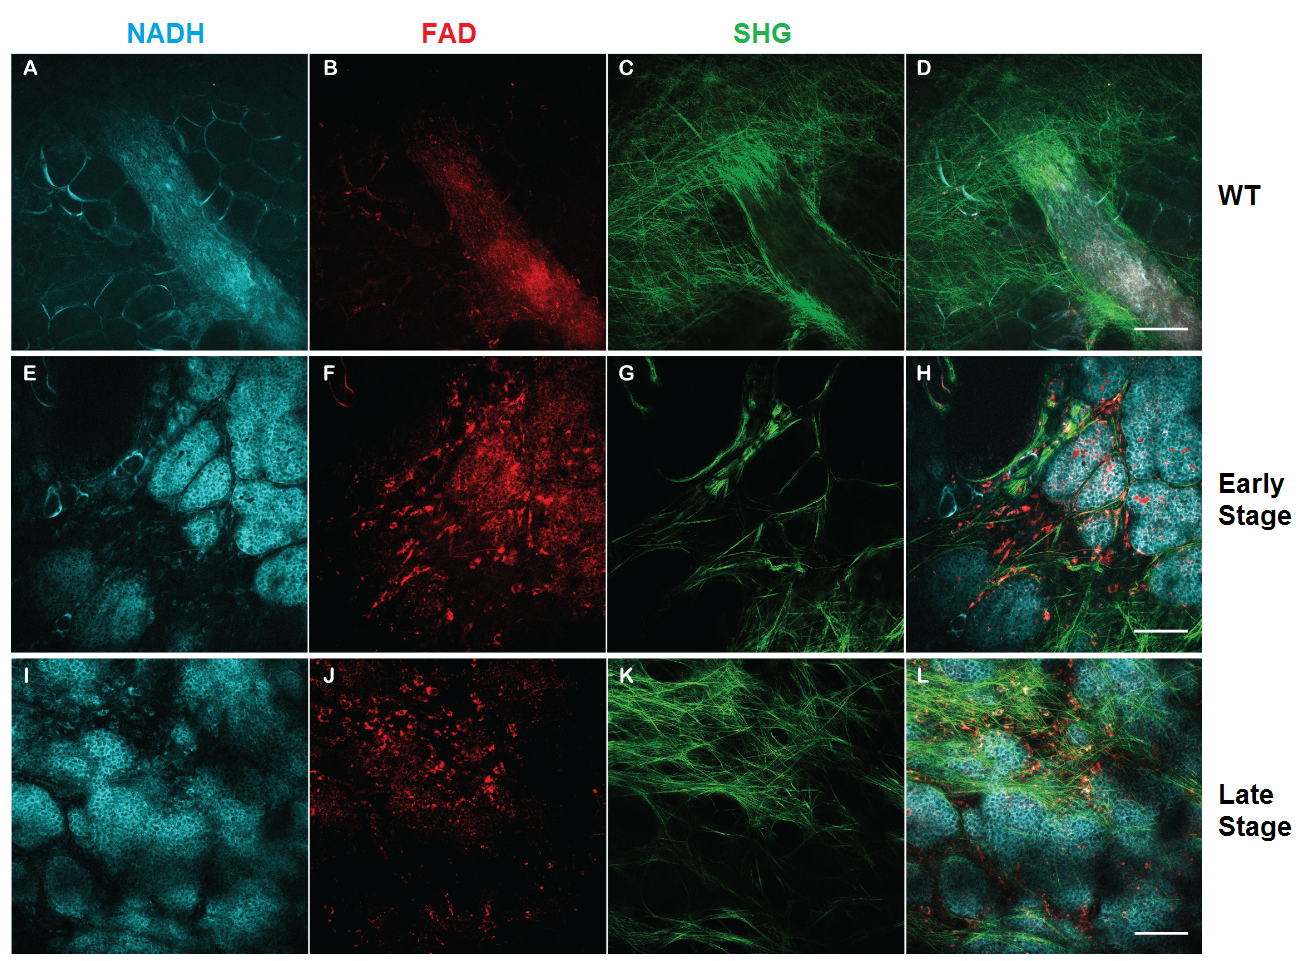
Optical imaging was performed on a Bruker Ultima IV (Bruker, Billerica, MA), an upright multiphoton laser scanning microscope, equipped with an Insight laser (Spectra Physics, Santa Clara, CA). Nicotinamide adenine dinucleotide (NADH) intrinsic fluorescence, Flavin adenine dinucleotide (FAD) intrinsic fluorescence and second harmonic generation (SHG) images were taken through the implanted window. Anatomical MRI data was collected on a preclinical MRI system (Agilent Technologies, Santa Clara, CA), using a T1-weighted spoiled gradient echo (SPGR) acquisition for coronal images (TR=116ms, TE=4.9ms, FA =20°, THK=2mm, resolution=0.25×0.25mm2) and axial images (TR=142ms, TE=3ms, FA=20°, THK=1mm, resolution=0.25×0.25mm2). A T2-weighted 2D fast spin echo sequence was used to acquire additional coronal images (TR=3000ms, TEeffective=48ms, THK=2mm, resolution=0.25×0.25mm2). All mice were injected with approximately 9MBq (250 µCi) of 2′-deoxy-2′-[18F]fluoro-d-glucose (FDG) 1 hour before micro-PET imaging. Mice were imaged with a hybrid microPET/CT systems (Siemens Medical Solutions, Knoxville, TN).
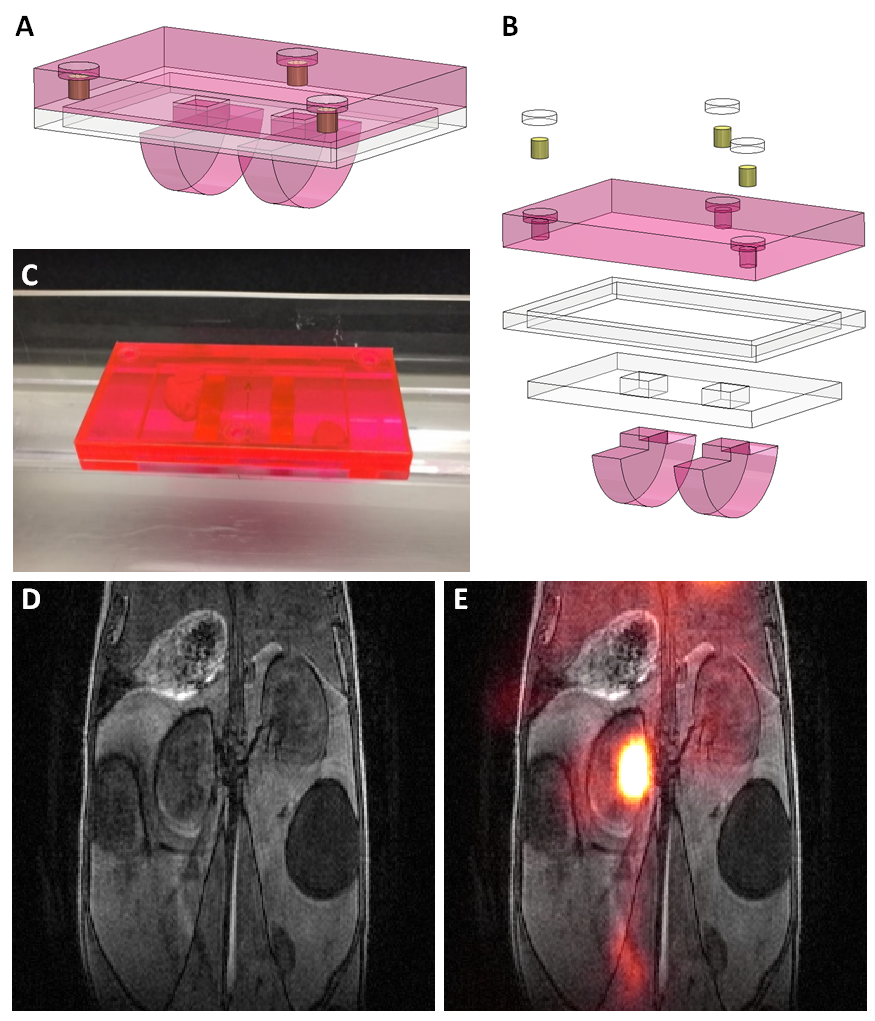
An imaging tray with dual-PET-MR fiducial markers was utilized for PET-MR image registration. In an acrylic tray, fiducial spots were drilled, filled with 10µCi each of 52Mn (t1/2=5.6days) and sealed prior to use. A T1-weighted 3D SPGR sequence (TR=5.16ms, TE=2.6ms, FA=20°, resolution=0.25×0.25×0.25mm3) was used and free 89Zr (t1/2-3.3days) was injected for the MR and PET sample data used to test registration. Datasets were scaled to the same spatial resolutions and manually registered in Amira (FEI, Hillsboro, OR) using the fiducial markers.
Results
In vivo optical data (Figure 2) shows the progression of the tumor from wild type to late-stage mice. Healthy mammary structure can be observed in wild type mice (Figure 2A-D), while early-stage (Figure 2E-H) and late-stage (Figure 2I-L) data showed the NADH-rich (blue) epithelial cells of the tumor invading the surrounding microenvironment. Collagen structure, from SHG images (green), can be seen re-organizing as the tumor progresses.
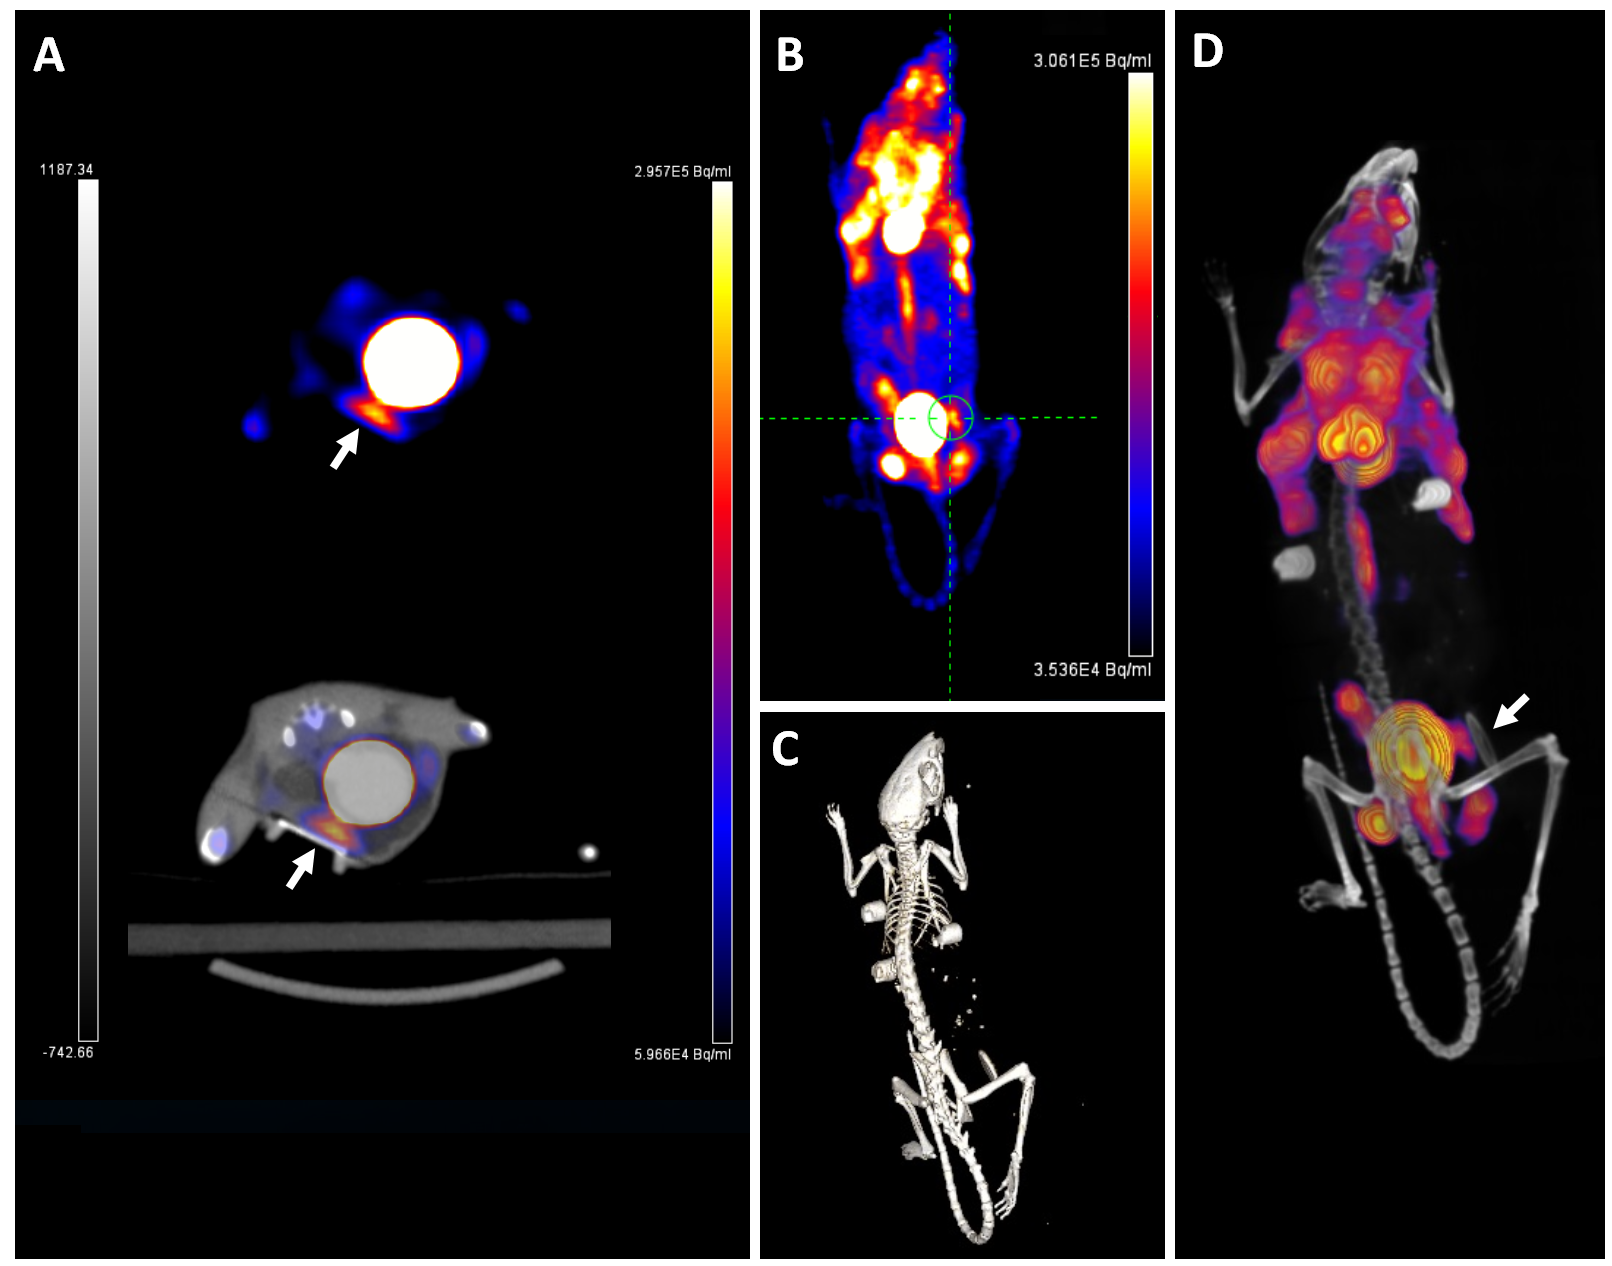
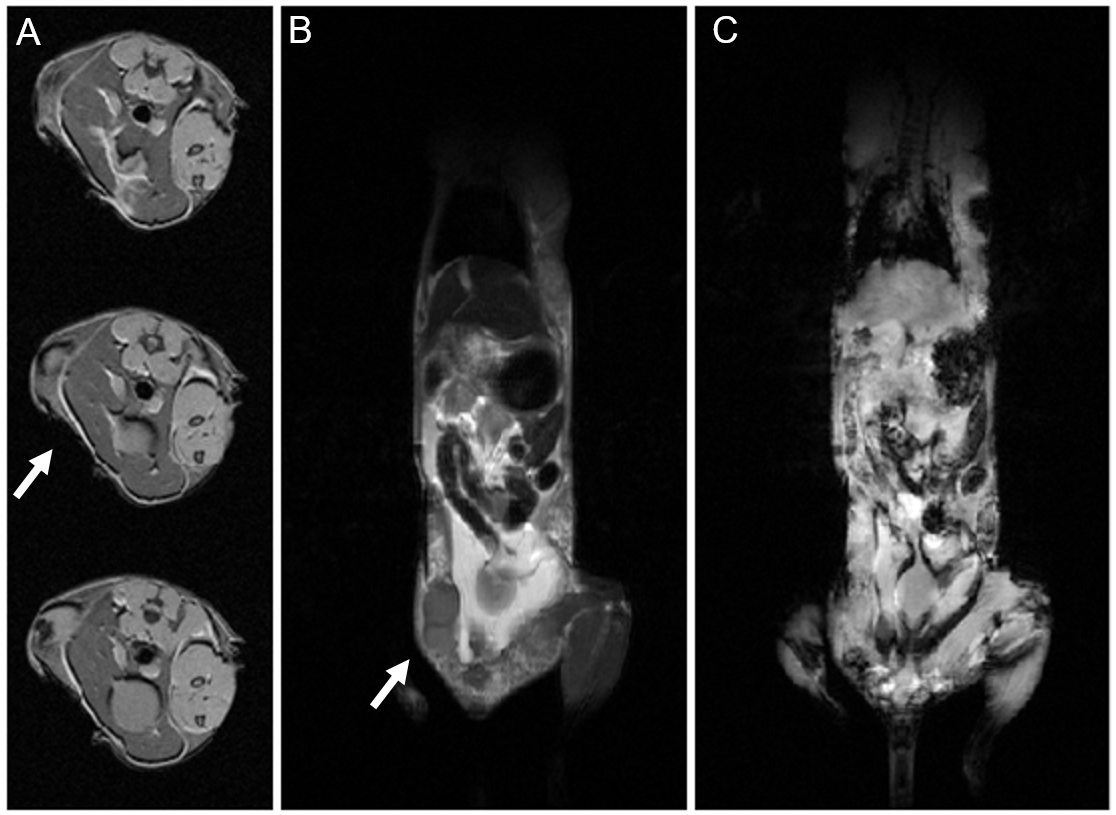
PET/CT data (Figure 3) shows regions throughout the subjects with high FDG uptake. In tumor-bearing mice, the tumor inside the window showed FDG uptake, corresponding with the region imaged optically. The windows themselves were clearly visible by CT and by MR data (Figure 4). Tumors could be seen in T2-weighted images (Figure 4B). Rigid registration was performed on PET and MR datasets using the dual-modal fiducial markers (Figure 5).
Discussion
This study aims to demonstrate multi-modal and multi-scale imaging in vivo using an implanted optical window for optical imaging. A dual modal PET-MR registration device for preclinical imaging is also presented. Cancer research is increasingly focusing on the tumor microenvironment as a means to improve understanding of tumor progression and resistance to therapy. Multi-modal and multi-scale metabolic imaging methods can connect our understanding of the tumor microenvironment with macroscopic scales assessed through medical imaging technologies and help guide therapy and improve diagnostic approaches. Future studies will expand upon this work with the multi-scale investigation of therapeutic response on the cellular scale and on the whole animal scale. Future work will aim to create an open-source algorithm for this registration, rather than performing a manual registration.Conclusion
This study successfully demonstrates multimodal and multiscale imaging of the same subject in vivo, using optical imaging through an implanted window, MRI and PET/CT. Multimodal, multiscale anatomical and metabolic images were acquired in a murine breast cancer model of tumor progression. An imaging tray with dual-PET-MR fiducial markers was created and used to perform PET-MR image registration.Acknowledgements
The authors would like to thank the Laboratory for Optical and Computational Instrumentation (LOCI) and the Morgridge Institute for Research for their continued support of this project. The authors would also like to acknowledge support from the Departments of Medical Physics and Radiology at the authors' institution, the AAPM Graduate Fellowship, and GE Healthcare.
References
1. Xu HN, Zheng G, Tchou J, Nioka S, Li LZ. Characterizing the metabolic heterogeneity in human breast cancer xenografts by 3D high resolution fluorescence imaging. SpringerPlus. 2013;2(1):73.
2. Szulczewski JM, Inman DR, Entenberg D, Ponik SM, Aguirre-Ghiso J, Castracane J, Condeelis J, Eliceiri KW, Keely PJ. In Vivo Visualization of Stromal Macrophages via label-free FLIM-based metabolite imaging. Sci Rep. 2016;6:25086.
3. Gallagher FA, Bohndiek SE, Kettunen MI, Lewis DY, Soloviev D, Brindle KM. Hyperpolarized 13C MRI and PET: in vivo tumor biochemistry. J Nucl Med Off Publ Soc Nucl Med. 2011;52(9):1333-1336.
4. Brindle K. Watching tumours gasp and die with MRI: the promise of hyperpolarised 13C MR spectroscopic imaging. Br J Radiol. 2012;85(1014):697-708.
5. Frosina G. Non-routine Tracers for PET Imaging of High-grade Glioma. Anticancer Res. 2016;36(7):3253-3260.
6. Lebron L, Greenspan D, Pandit-Taskar N. PET Imaging of Breast Cancer: Role in Patient Management. PET Clin. 2015;10(2):159-195.
7. Guy CT, Cardiff RD, Muller WJ. Induction of mammary tumors by expression of polyomavirus middle T oncogene: a transgenic mouse model for metastatic disease. Mol Cell Biol. 1992;12(3):954-961.
8. Kedrin D, Gligorijevic B, Wyckoff J, Verkhusha VV, Condeelis J, Segall JE, van Rheenen J. Intravital imaging of metastatic behavior through a mammary imaging window. Nat Methods. 2008;5(12):1019-1021.
Figures