0974
Monitoring Glioblastoma Progression in Mouse Brain with Magnetic Resonance Elastography1Boston University, Boston, MA, United States, 2Brigham and Women's Hospital, Boston, MA, United States, 3University Medicine Goettingen, Goettingen, Germany, 4Harvard Medical School, Boston, MA, United States, 5King's College, London, United Kingdom
Synopsis
The longitudinal progression of glioblastoma was monitored in a cohort of mice with MRE and conventional RARE MRI. Increasing tumor size was easily seen with both modalities. In most cases, MRE maps showed a tumor margin that was sharper than RARE. Results were registered with histology, and variation of the shear modulus was compared with histology features. Both MRE and RARE demonstrated tumor regions with varying levels of heterogeneity, and in one animal, both homogeneous and heterogeneous parts were found to be growing separately as sub-populations of the same glioblastoma cell line within the brain.
Background
Glioblastoma (GBM) is a primary brain malignancy with one of the highest rates of mortality, growth, and invasion. Potential single-cell invasions, indistinct boundaries with the healthy tissue, and numerous micro-tumors far from the main tumor hamper a complete resection of the malignancy1. Magnetic resonance elastography (MRE) provides a means to image elastic properties of the brain and hence can be used to monitor the rigidity of brain tumors and their mechanical environment in-vivo. Several groups2-7 have imaged GBM with MRE and report abnormal mechanical rigidity within the GBM tissue.Aims
Use MRE to monitor longitudinal changes of the mechanical properties of GBM and surrounding tissue in mouse brain and correlate them with histology.Animals
Twelve nu/nu athymic mice, divided into 2 groups (scanned and not scanned), were injected with a human GBM stem cell line in the right hemisphere of the brain. MRE was performed on one group of mice weekly over a 4-week period. Starting second week post injection, one mouse from each group was sacrificed for histological studyHistology
Brains were fixed immediately after imaging in order to minimize deviation of histology slides from the MRE and MRI images. Tissue sections were labeled with (1) DAPI to detect the density of cell nuclei (blue channel), (2) anti-CD31 antibody to detect blood vessels (green channel), and (3) anti-vimentin staining to detect GBM cells (red channel).MRE
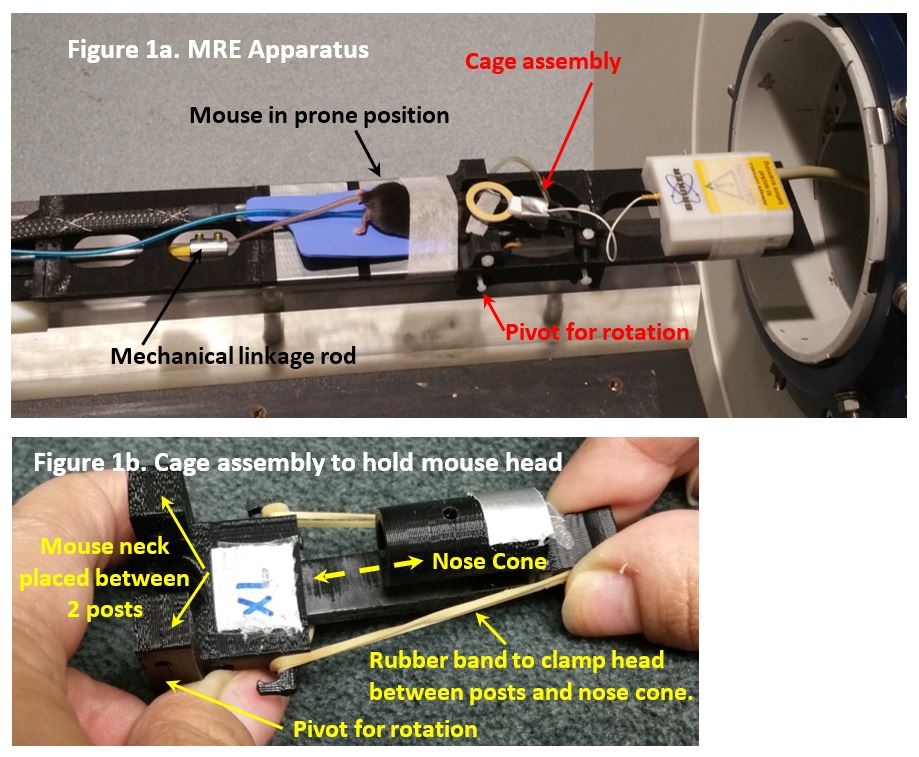
A novel MRE apparatus was developed and employed (figure 1). Oscillatory displacements of ~2um at 1kHz frequency were achieved in mouse brain with this apparatus.
A multi-slice spin echo MRE sequence8 was used. The curl of the momentum equation was used to eliminate the pressure field followed by algebraic inversion with a locally homogeneous approximation9. RARE T2-weighted images were also acquired over the same FOV.
Results
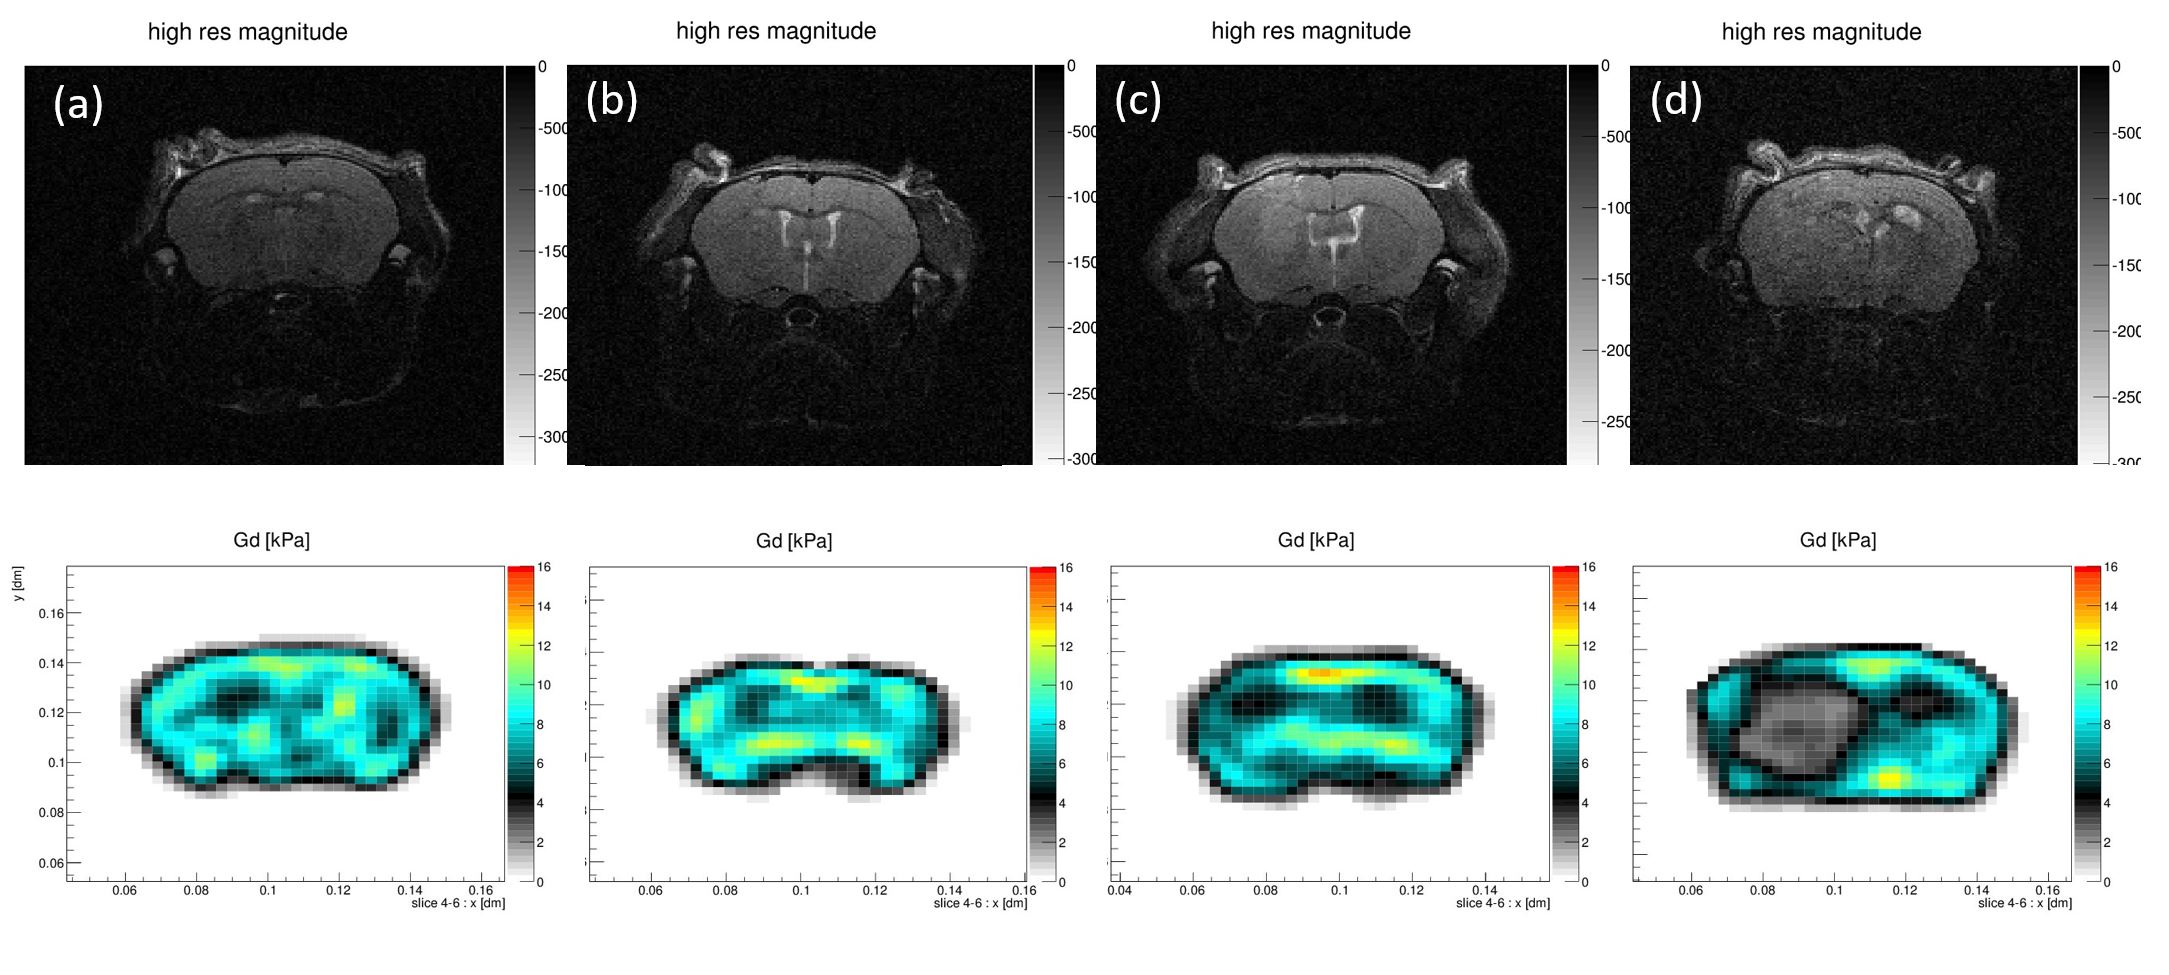
The tumor can be easily distinguished on both RARE and histological images. On MRE maps, the tumor appears mostly compliant. All modalities show an increasing tumor size during this longitudinal study of tumor progression. In later weeks, a significant mass effect with midline shift and distortion of the ventricles is observable on MRI RARE images (figure 2).
One week after the injection and in two different animals, some trauma along the needle track can be seen as hypointense areas in the MRI RARE images (figure 3). MRE maps showed this needle area as soft compared to contralateral tissue. During later weeks, progression of the tumor is seen in both MRE and MRI RARE images as an increase in the soft area and an area of different signal intensity, respectively.
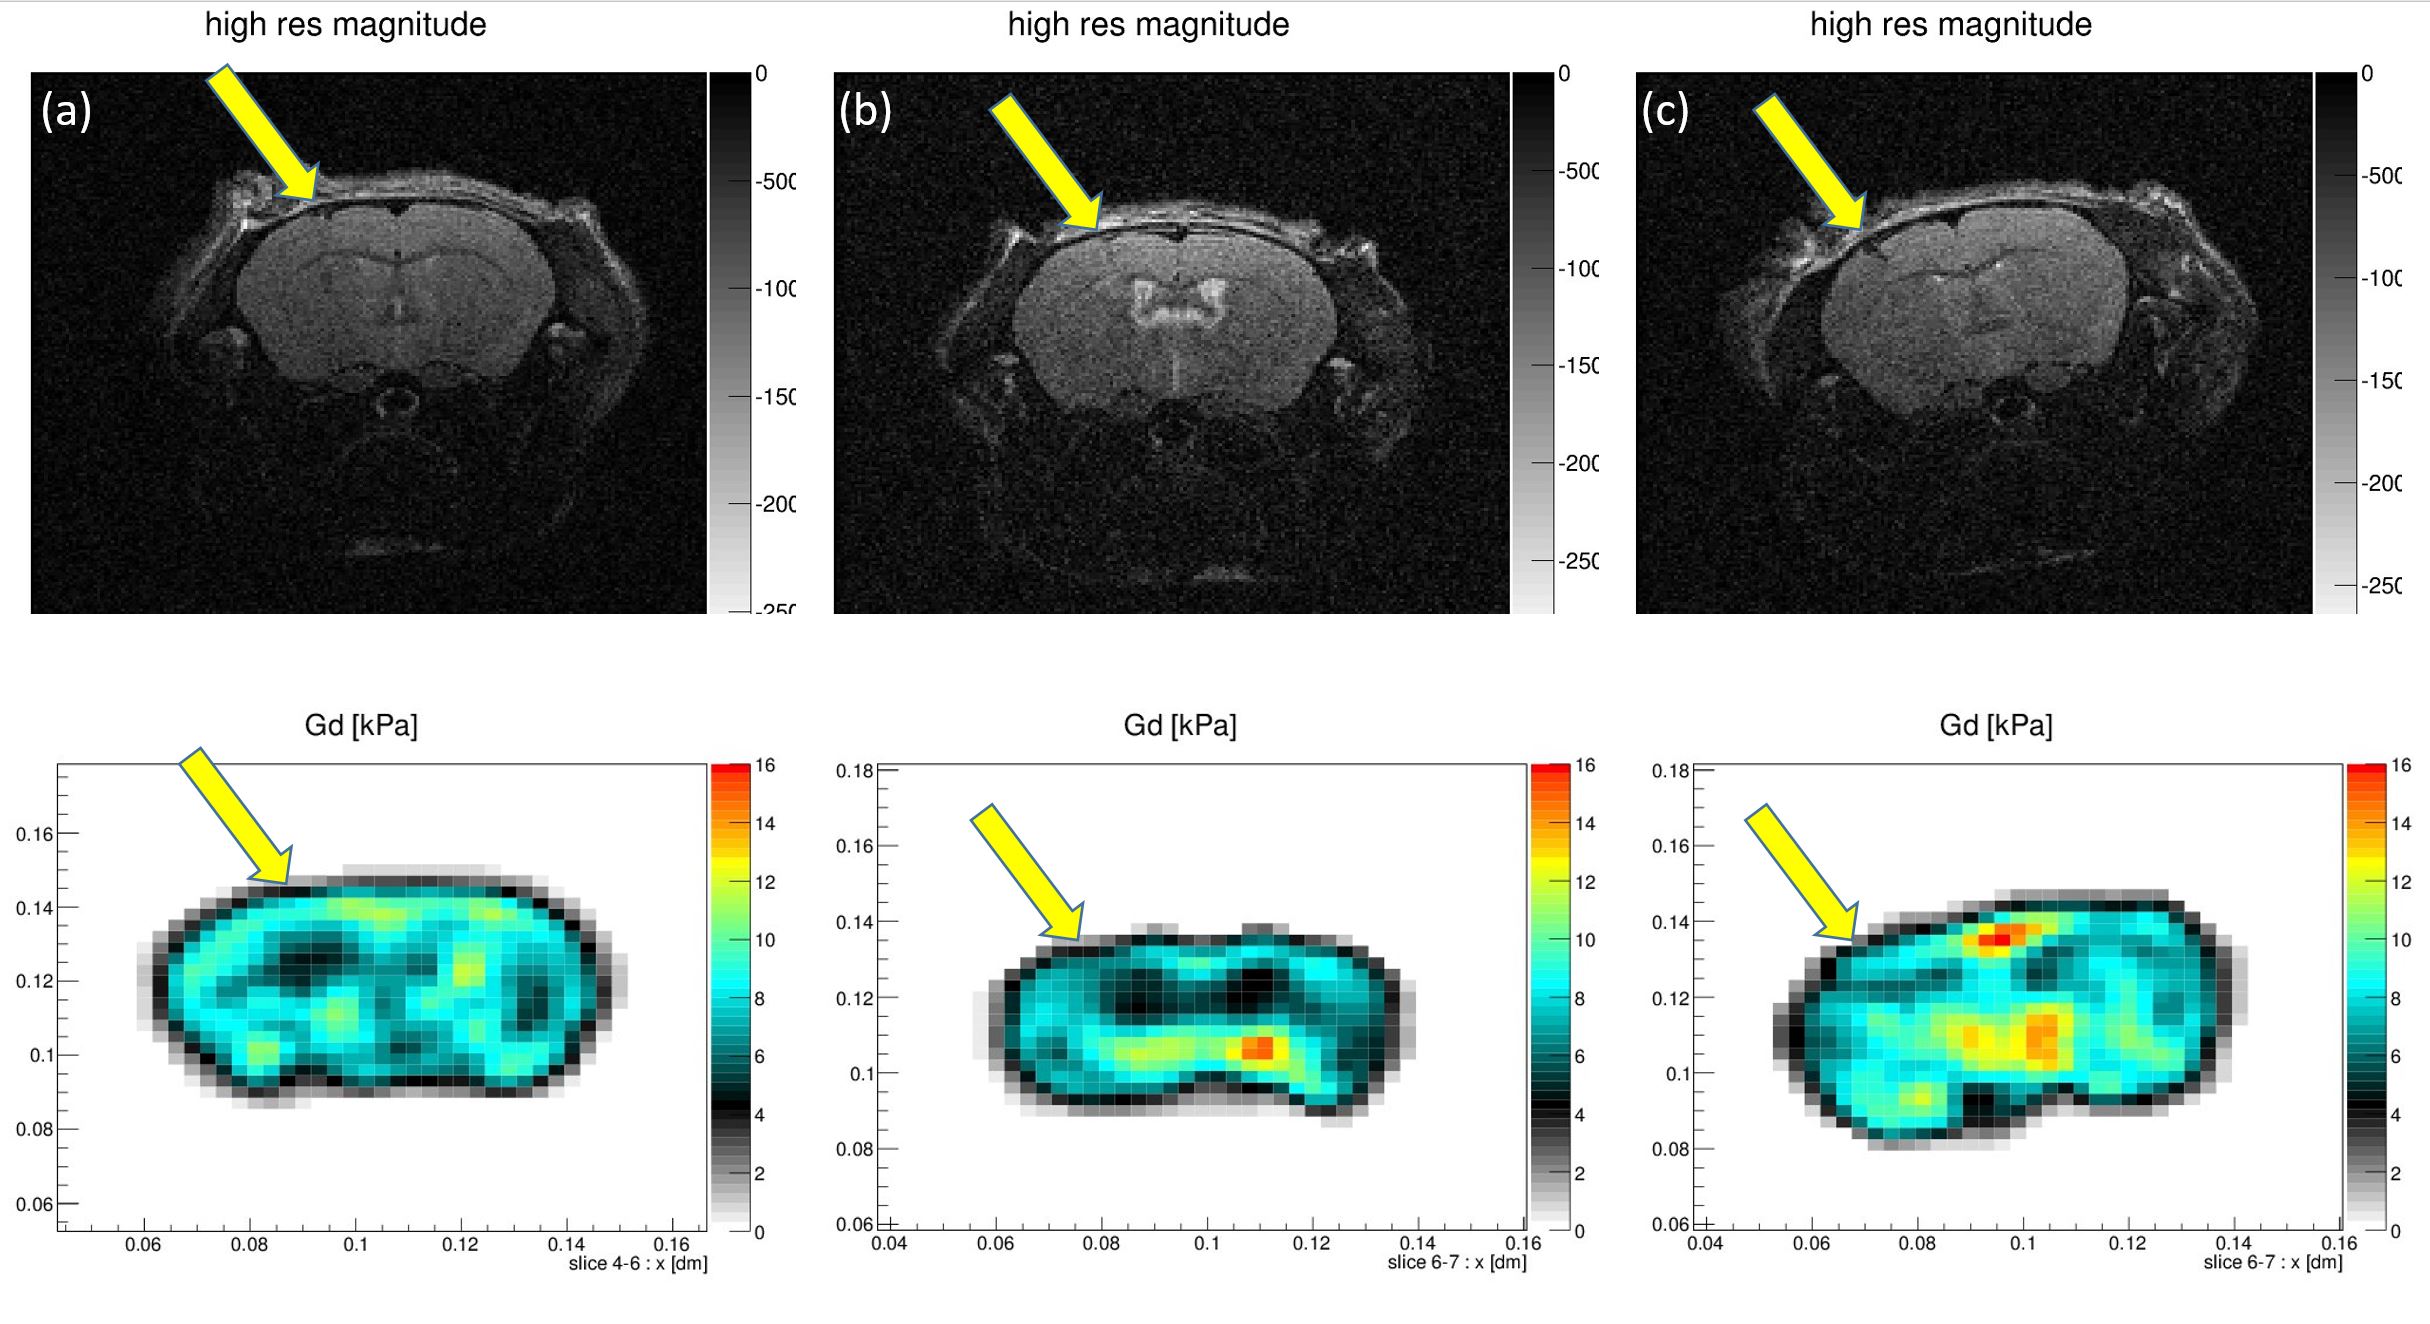
In some cases, the tumor interior appears mostly homogeneous with clear boundaries in the MRE maps. MRE also shows a clearly defined tumor rim with stiffness intermediate between a soft tumor interior and external healthy brain tissue (figure 4). This rim corresponds to GBM cells seen in the histology slides, stained with anti-vimentin. The variation in central tumor stiffness correlates well with nuclear density.
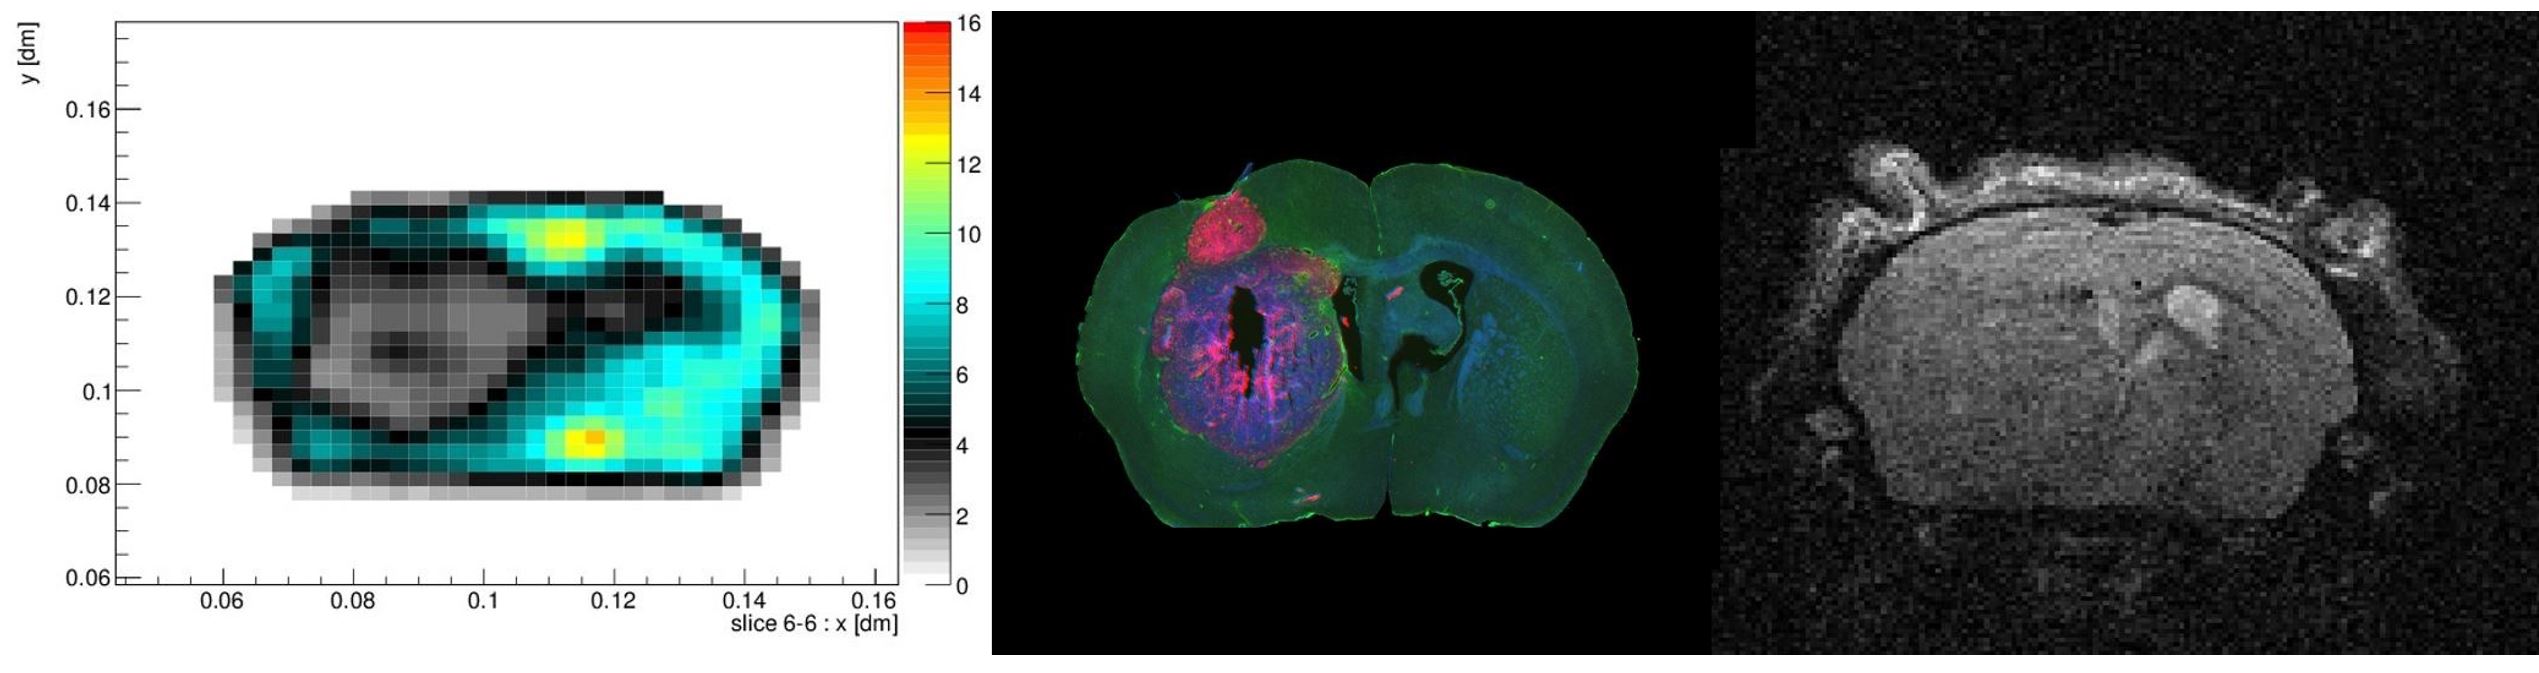
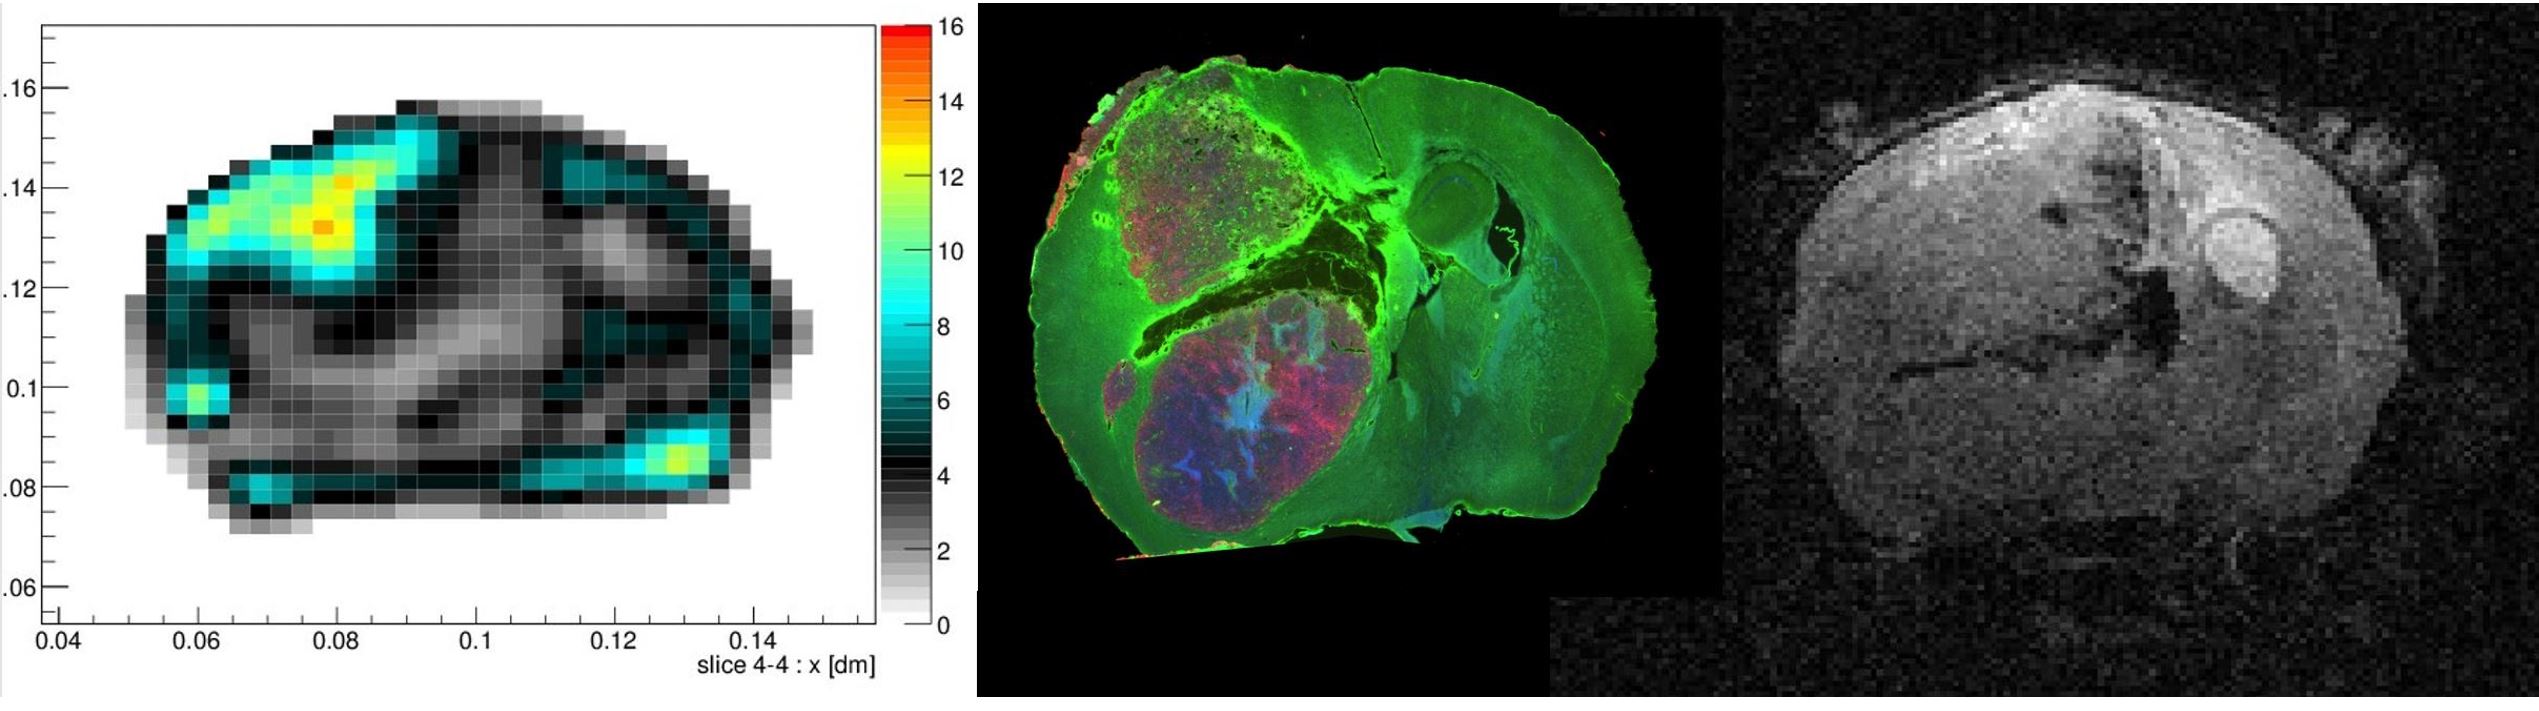
In one case, MRI RARE images show two areas different from normal healthy contralateral brain tissue. One area near the cortex shows a heterogeneous signal intensity with both hyperintense and hypointense spots (figure 5). A second area deeper in the thalamic basal ganglionic region shows a homogeneous appearing mass. MRE maps easily distinguish these cortical and basal ganglionic areas as relatively rigid and compliant, respectively. Histology also showed differences in the tumor in these two regions. The tumor in the cortex region contains more blood vessel, but fewer nuclei and GBM cells.
Discussion
Jamin et al.3 found a linear correlation between tissue rigidity and both microvessel density and cellular density. Hence, our observation of greater rigidity in the cortical tumor could be due to the increased vessel density seen in histology. The apparently intermediate rigidity in the tumor rim might originate from an increased density of nuclei and GBM cells compared to its center. It is noteworthy that the cell line used in this study is non-metastatic. It is well known that these cell lines can create sub-populations of GBM cells with different characteristics and this may explain the observed differences between the cortical and basal ganglia tumor masses.Conclusions
MRE is capable of non-invasively monitoring GBM development and quantifying its mechanical environment. MRE images showed distinct regions of tumor implying that it is sensitive to changes in nuclear density or necrosis within the tumor.Acknowledgements
Support is gratefully acknowledged from NIH 1R21EB020757; NSF grant No. 1148124; a European Union Horizon 2020 research and innovation grant No. 668039; and from Boston University and Brigham and Women’s Hospital.
References
1) Hess, Kenneth R., Kristine R. Broglio, and Melissa L. Bondy. "Adult glioma incidence trends in the United States, 1977–2000." Cancer 101.10 (2004): 2293-2299.
2) Feng, Y., Clayton, E. H., Okamoto, R. J., Engelbach, J., Bayly, P. V., & Garbow, J. R. (2016). A longitudinal magnetic resonance elastography study of murine brain tumors following radiation therapy. Physics in Medicine and Biology, 61(16), 6121.
3) Jamin, Y., Boult, J. K., Li, J., Popov, S., Garteiser, P., Ulloa, J. L., ... & Waterton, J. C. (2015). Exploring the biomechanical properties of brain malignancies and their pathologic determinants in vivo with magnetic resonance elastography. Cancer research, 75(7), 1216-1224.
4) Reiss-Zimmermann, M., Streitberger, K. J., Sack, I., Braun, J., Arlt, F., Fritzsch, D., & Hoffmann, K. T. (2015). High resolution imaging of viscoelastic properties of intracranial tumours by multi-frequency magnetic resonance elastography. Clinical neuroradiology, 25(4), 371-378.
5) Streitberger, K. J., Reiss-Zimmermann, M., Freimann, F. B., Bayerl, S., Guo, J., Arlt, F., ... & Sack, I. (2014). High-resolution mechanical imaging of glioblastoma by multifrequency magnetic resonance elastography. PloS one, 9(10), e110588.
6) Simon, M., Guo, J., Papazoglou, S., Scholand-Engler, H., Erdmann, C., Melchert, U., ... & Wuerfel, J. (2013). Non-invasive characterization of intracranial tumors by magnetic resonance elastography. New Journal of Physics, 15(8), 085024.
7) Sakai, N., Takehara, Y., Yamashita, S., Ohishi, N., Kawaji, H., Sameshima, T., ... & Namba, H. (2016). Shear Stiffness of 4 Common Intracranial Tumors Measured Using MR Elastography: Comparison with Intraoperative Consistency Grading. American Journal of Neuroradiology, 37(10), 1851-1859.
8) Garteiser, P., Sahebjavaher, R. S., Ter Beek, L. C., Salcudean, S., Vilgrain, V., Van Beers, B. E., & Sinkus, R. (2013). Rapid acquisition of multifrequency, multislice and multidirectional MR elastography data with a fractionally encoded gradient echo sequence. NMR in Biomedicine, 26(10), 1326-1335.
9) Sinkus, R., Siegmann, K., Xydeas, T., Tanter, M., Claussen, C., & Fink, M. (2007). MR elastography of breast lesions: understanding the solid/liquid duality can improve the specificity of contrast-enhanced MR mammography. Magnetic Resonance in Medicine, 58(6), 1135-1144.
Figures