0972
Characterization of Renal Tumors: Integrating Biomechanical, Functional and Morphological Assessment Using 3 Tesla Magnetic Resonance Elastography1Cancer Imaging, King's College London, London, United Kingdom, 2MR Research Collaborations, Siemens Healthcare, Frimley, United Kingdom, 3King's College London, London, United Kingdom, 4Radiology, Guy's and St Thomas' NHS Foundation Trust, London, United Kingdom, 5Urology, Guy's and St Thomas' NHS Foundation Trust, London, United Kingdom, 6Pathology, Guy's and St Thomas' NHS Foundation Trust, London, United Kingdom, 7Biomedical Engineering, King's College London, London, United Kingdom
Synopsis
Incidentally detected renal tumors are overtreated surgically: up to 20% of them are benign, most frequently oncocytomas. We hypothesize that integrating biomechanical assessment with functional/morphological MRI can improve lesion characterization, precluding unnecessary surgery. Initial experience in 5 resected renal oncocytomas and 13 renal cell carcinomas (RCC) demonstrates that MR Elastography (MRE) at 30Hz with shear modulus parametric mapping is feasible and adds value within a multiparametric MRI assessment: oncocytoma displays higher median shear attenuation (α) and lower shear velocity (C) than RCC. MRE parameters appear to be stronger classifiers than quantitative DCE MRI parameters (Ktrans, kep), ADC and T2 signal intensity.
Purpose
- To assess the feasibility of 3T Magnetic Resonance Elastography (MRE) for characterizing renal tumors with surgical pathology as the gold standard, in particular for distinguishing renal oncocytoma from RCC.
- To correlate tumor MRE parametric mapping with same-level quantitative functional and anatomical imaging, including tumor DCE MRI parameters, apparent diffusion coefficient (ADC) and T2 signal intensity.
Background
With the growing use of cross-sectional imaging, incidental detection of asymptomatic small renal tumors (less than 4 cm) has risen steadily1,2. Although most of these lesions represent renal cell carcinoma (RCC), up to 20% are benign3. A recent estimate suggests that ~5600 benign renal tumors undergo surgical resection yearly in the US4. Renal oncocytoma is the most common benign lesion, accounting for ~15% of all renal tumors; conventional imaging cannot differentiate oncocytoma from RCC reliably5,6. Oncocytoma has a characteristic macroscopic appearance of a homogenous dark brown lesion with frequent central scar and absence of necrosis. Microscopically it consists of tight cellular nests surrounded by myxoid stroma. Conversely, clear cell RCC (the most common subtype) consists of soft yellow material alternating with fibrous or mucoid areas, with frequent hemorrhage and necrosis. Microscopically it is composed of cells rich in lipids and glycogen, surrounded by an extensive capillary network.Hypothesis
We hypothesize that the biomechanical shear properties of renal tumors reflect the underlying histological structure (including cellular distribution, vascular architecture and extracellular-extravascular space) and therefore differ between renal oncocytoma and RCC.Methods
Following IRB approval, informed consent, and initial MRE optimization in 10 healthy volunteers, 20 patients with renal tumors (up to 5 cm) scheduled for partial or total nephrectomy were recruited prospectively. Imaging was performed on a 3T MRI system (Biograph mMR, Siemens Healthcare, Erlangen, Germany) and included anatomical T2 HASTE, DCE MRI (3D spoiled gradient echo; temporal resolution = 6.4 s; 34 measurements; Gadovist®; two-compartment Tofts model) and DWI (b = 50, 500, 800). Mechanical vibrations at 30Hz were transmitted from a mechanical transducer (Resoundant®)sited over the kidney of interest. MRE was based upon a prototype 2D multi-slice interleaved gradient echo sequence synchronized with the transducer's vibrations7: TE = 7.38 ms; motion encoding gradient amplitude = 30 mT/m; GRAPPA acceleration factor = 2. Four consecutive breath-holds of 17 sec each (3 motion-encoding directions and one reference scan) provided MRE data within 6 consecutive slices of 128 x 88 pixels at 3 mm isotropic resolution and 4 wave phase offsets. Reconstruction of viscoelastic parameters used firstly the application of the curl operator for removal of the compressional component, secondly a direct inversion of the Helmholtz equation8. Viscoelastic parametric maps, including shear wave attenuation (α, mm-1) and velocity (C, m/s) were generated offline on dedicated in-house software and regions of interest (ROI) drawn around lesions. Median parametric values between the two histologies were compared using the Wilcoxon rank-sum test. A screening model using each independent imaging variable iteratively was applied to identify the best classifier. Statistical significance was set at 5%.Results
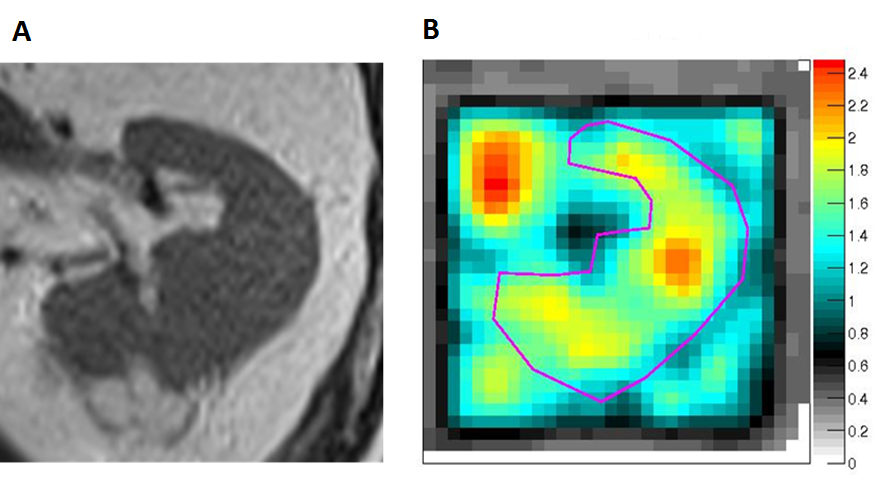
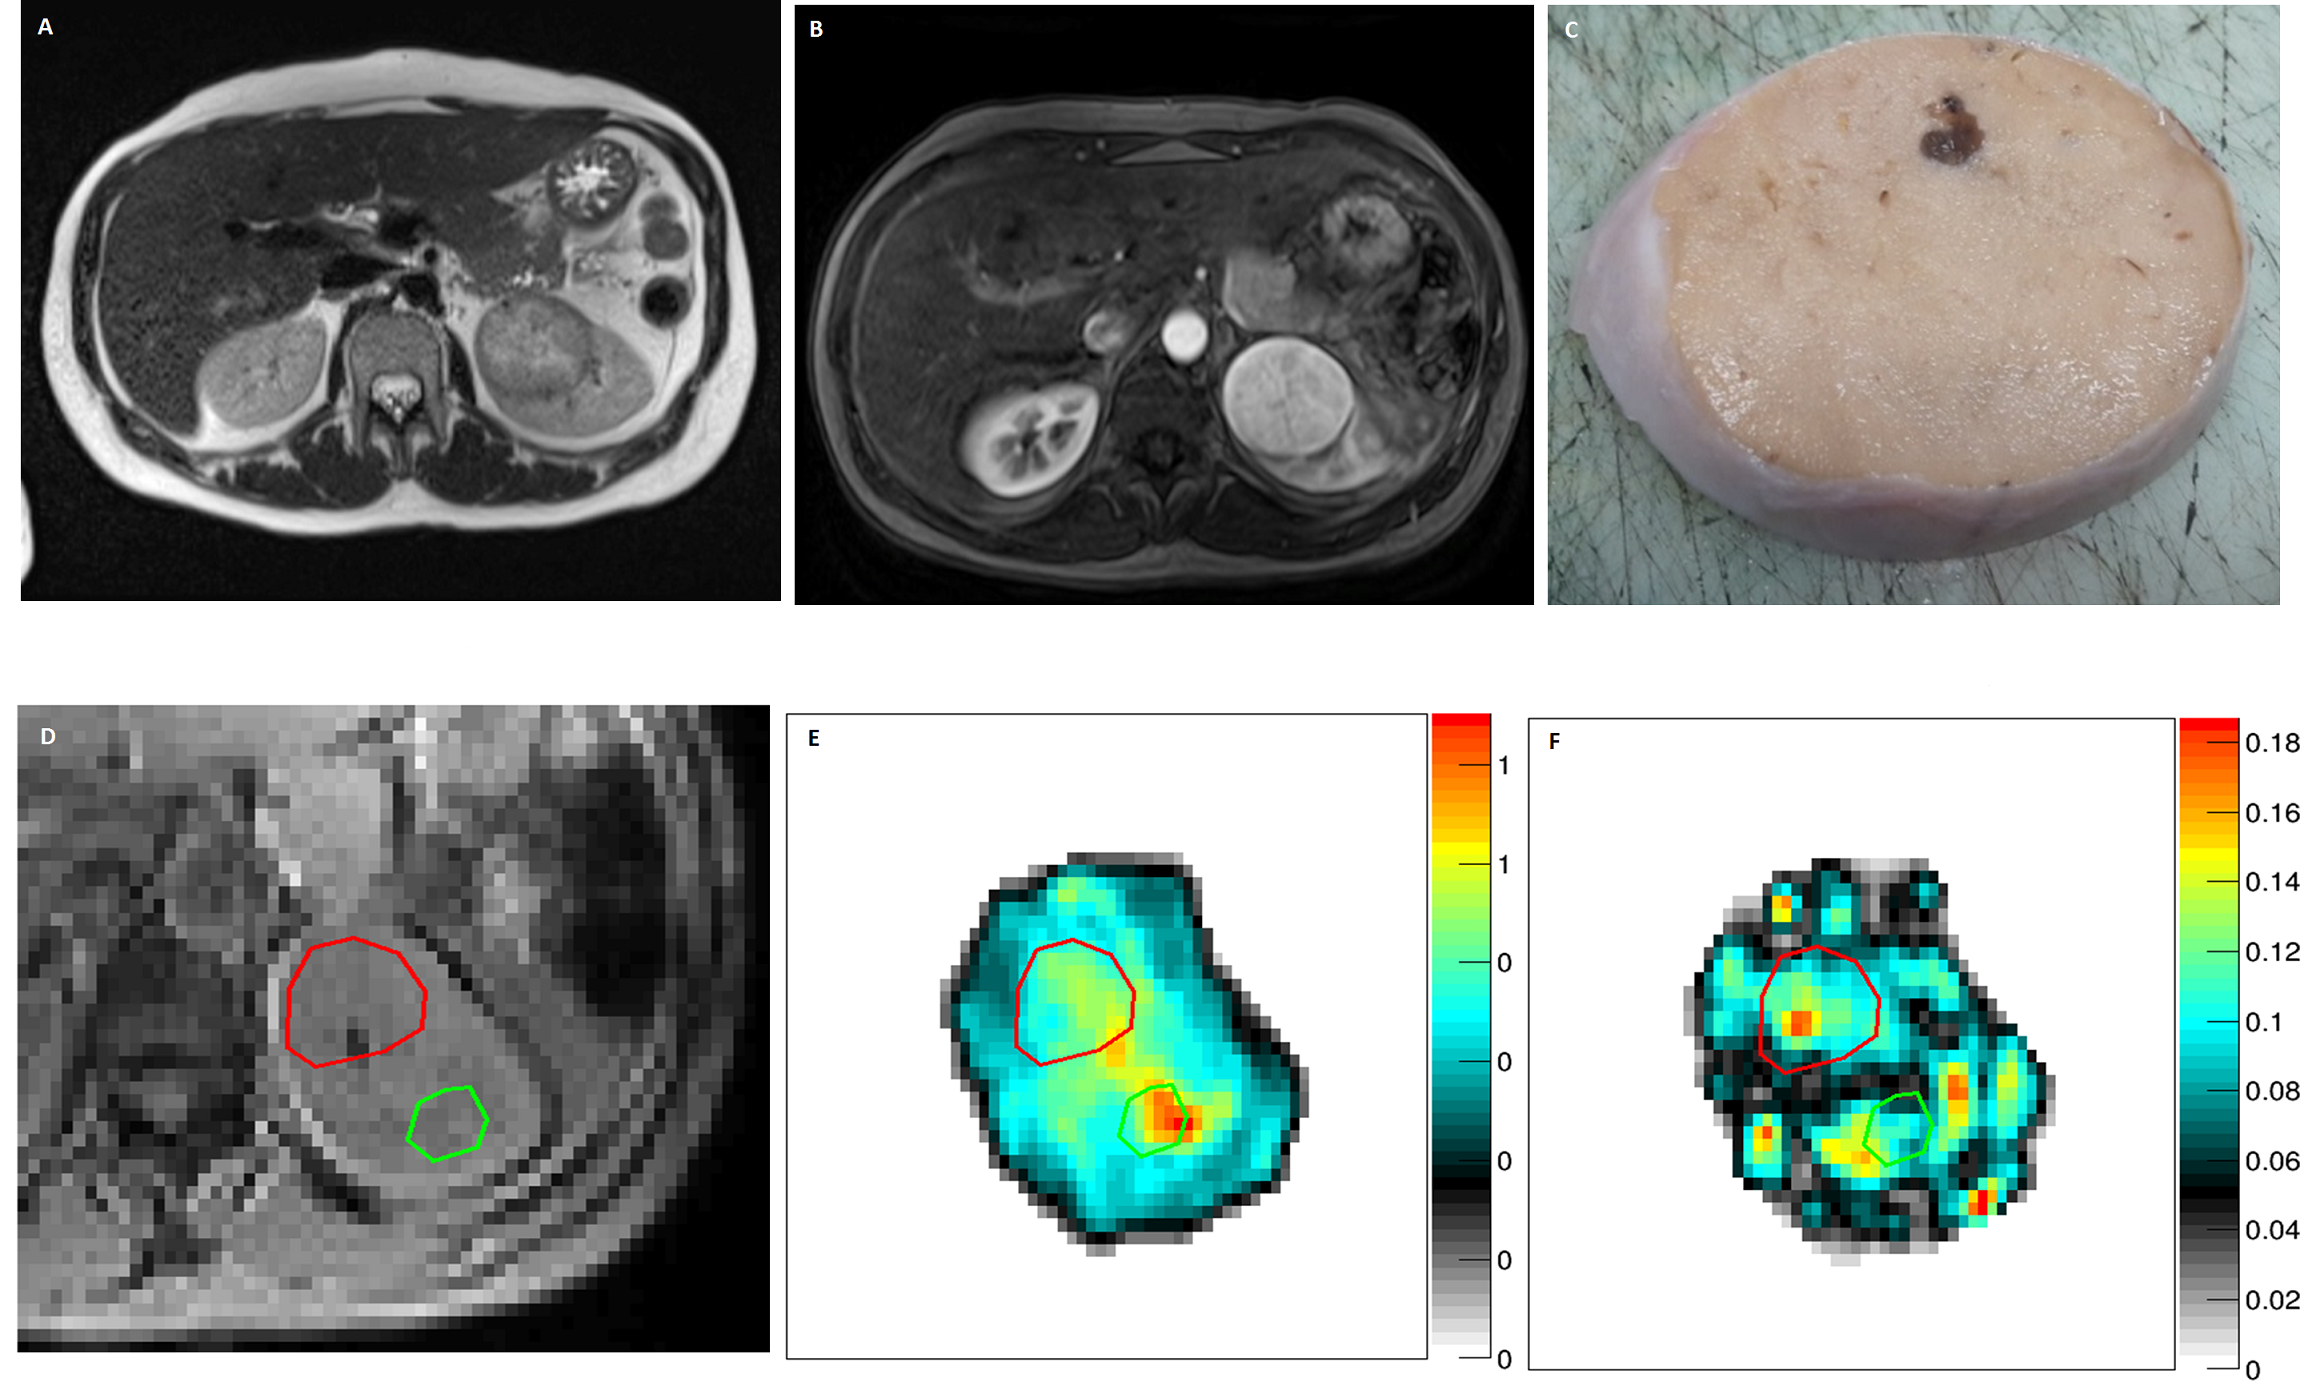
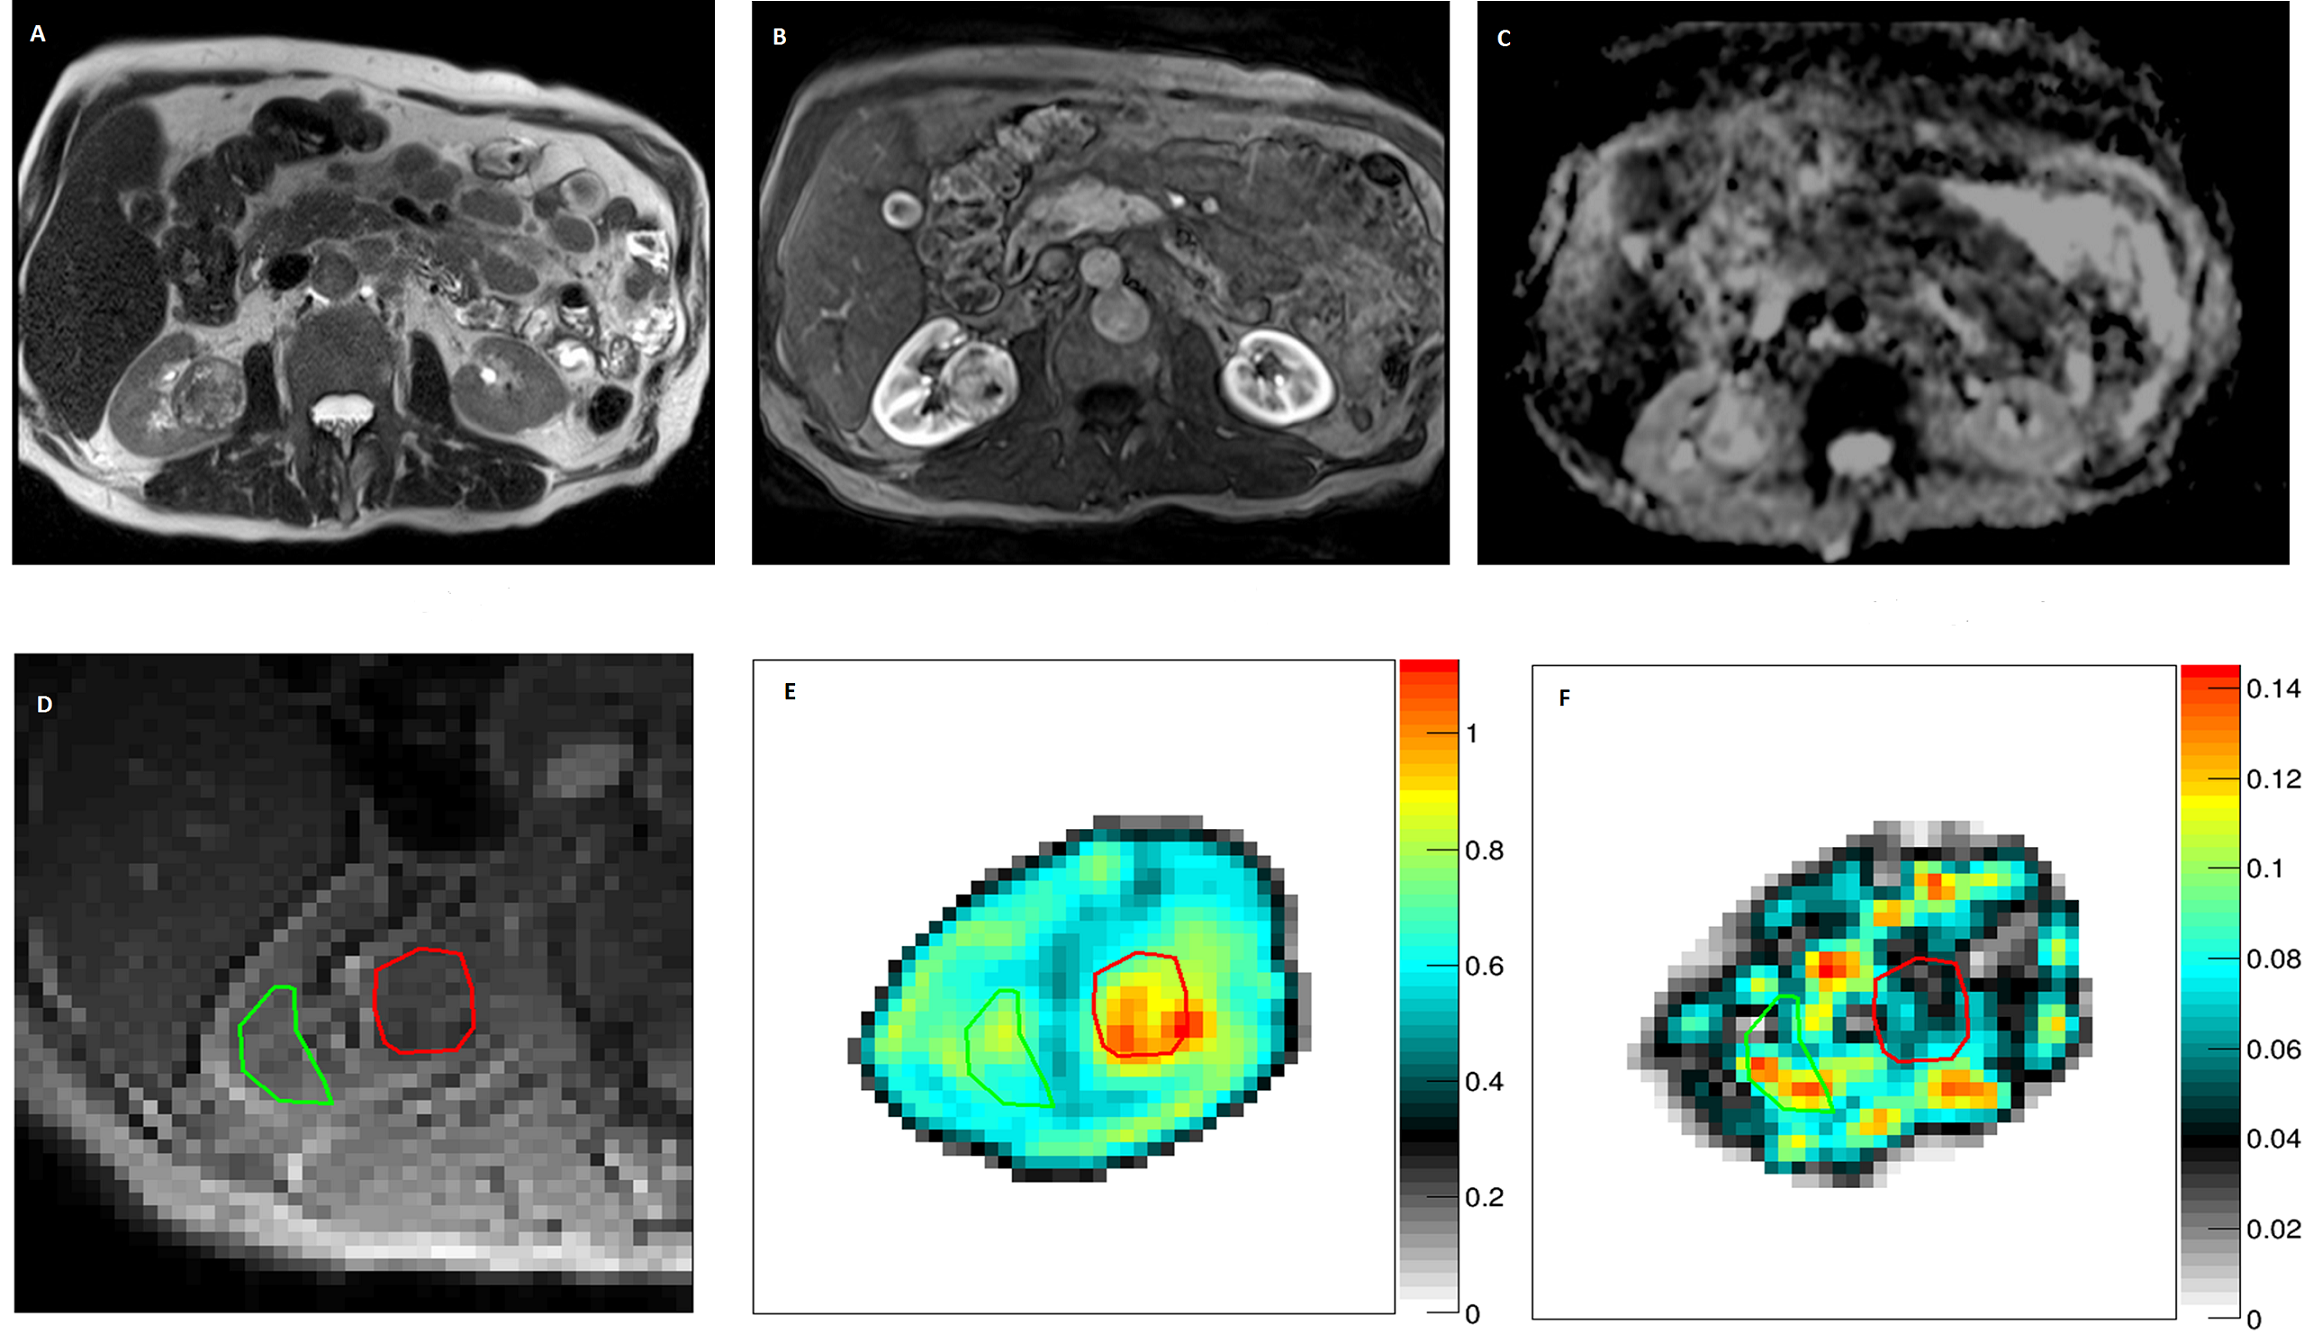
One dataset of insufficient MRE quality and one case of rare benign histology were excluded, leaving 18 complete MR imaging datasets for analysis. Axial tumor diameters ranged between 2.5 and 5.0 cm. MRE mechanical vibrations showed good unilateral wave penetration (Figure 1). Histological assessment revealed 5 renal oncocytomas (Figure 2) and 13 RCC (12 clear cell; 1 papillary type 1; Figure 3).
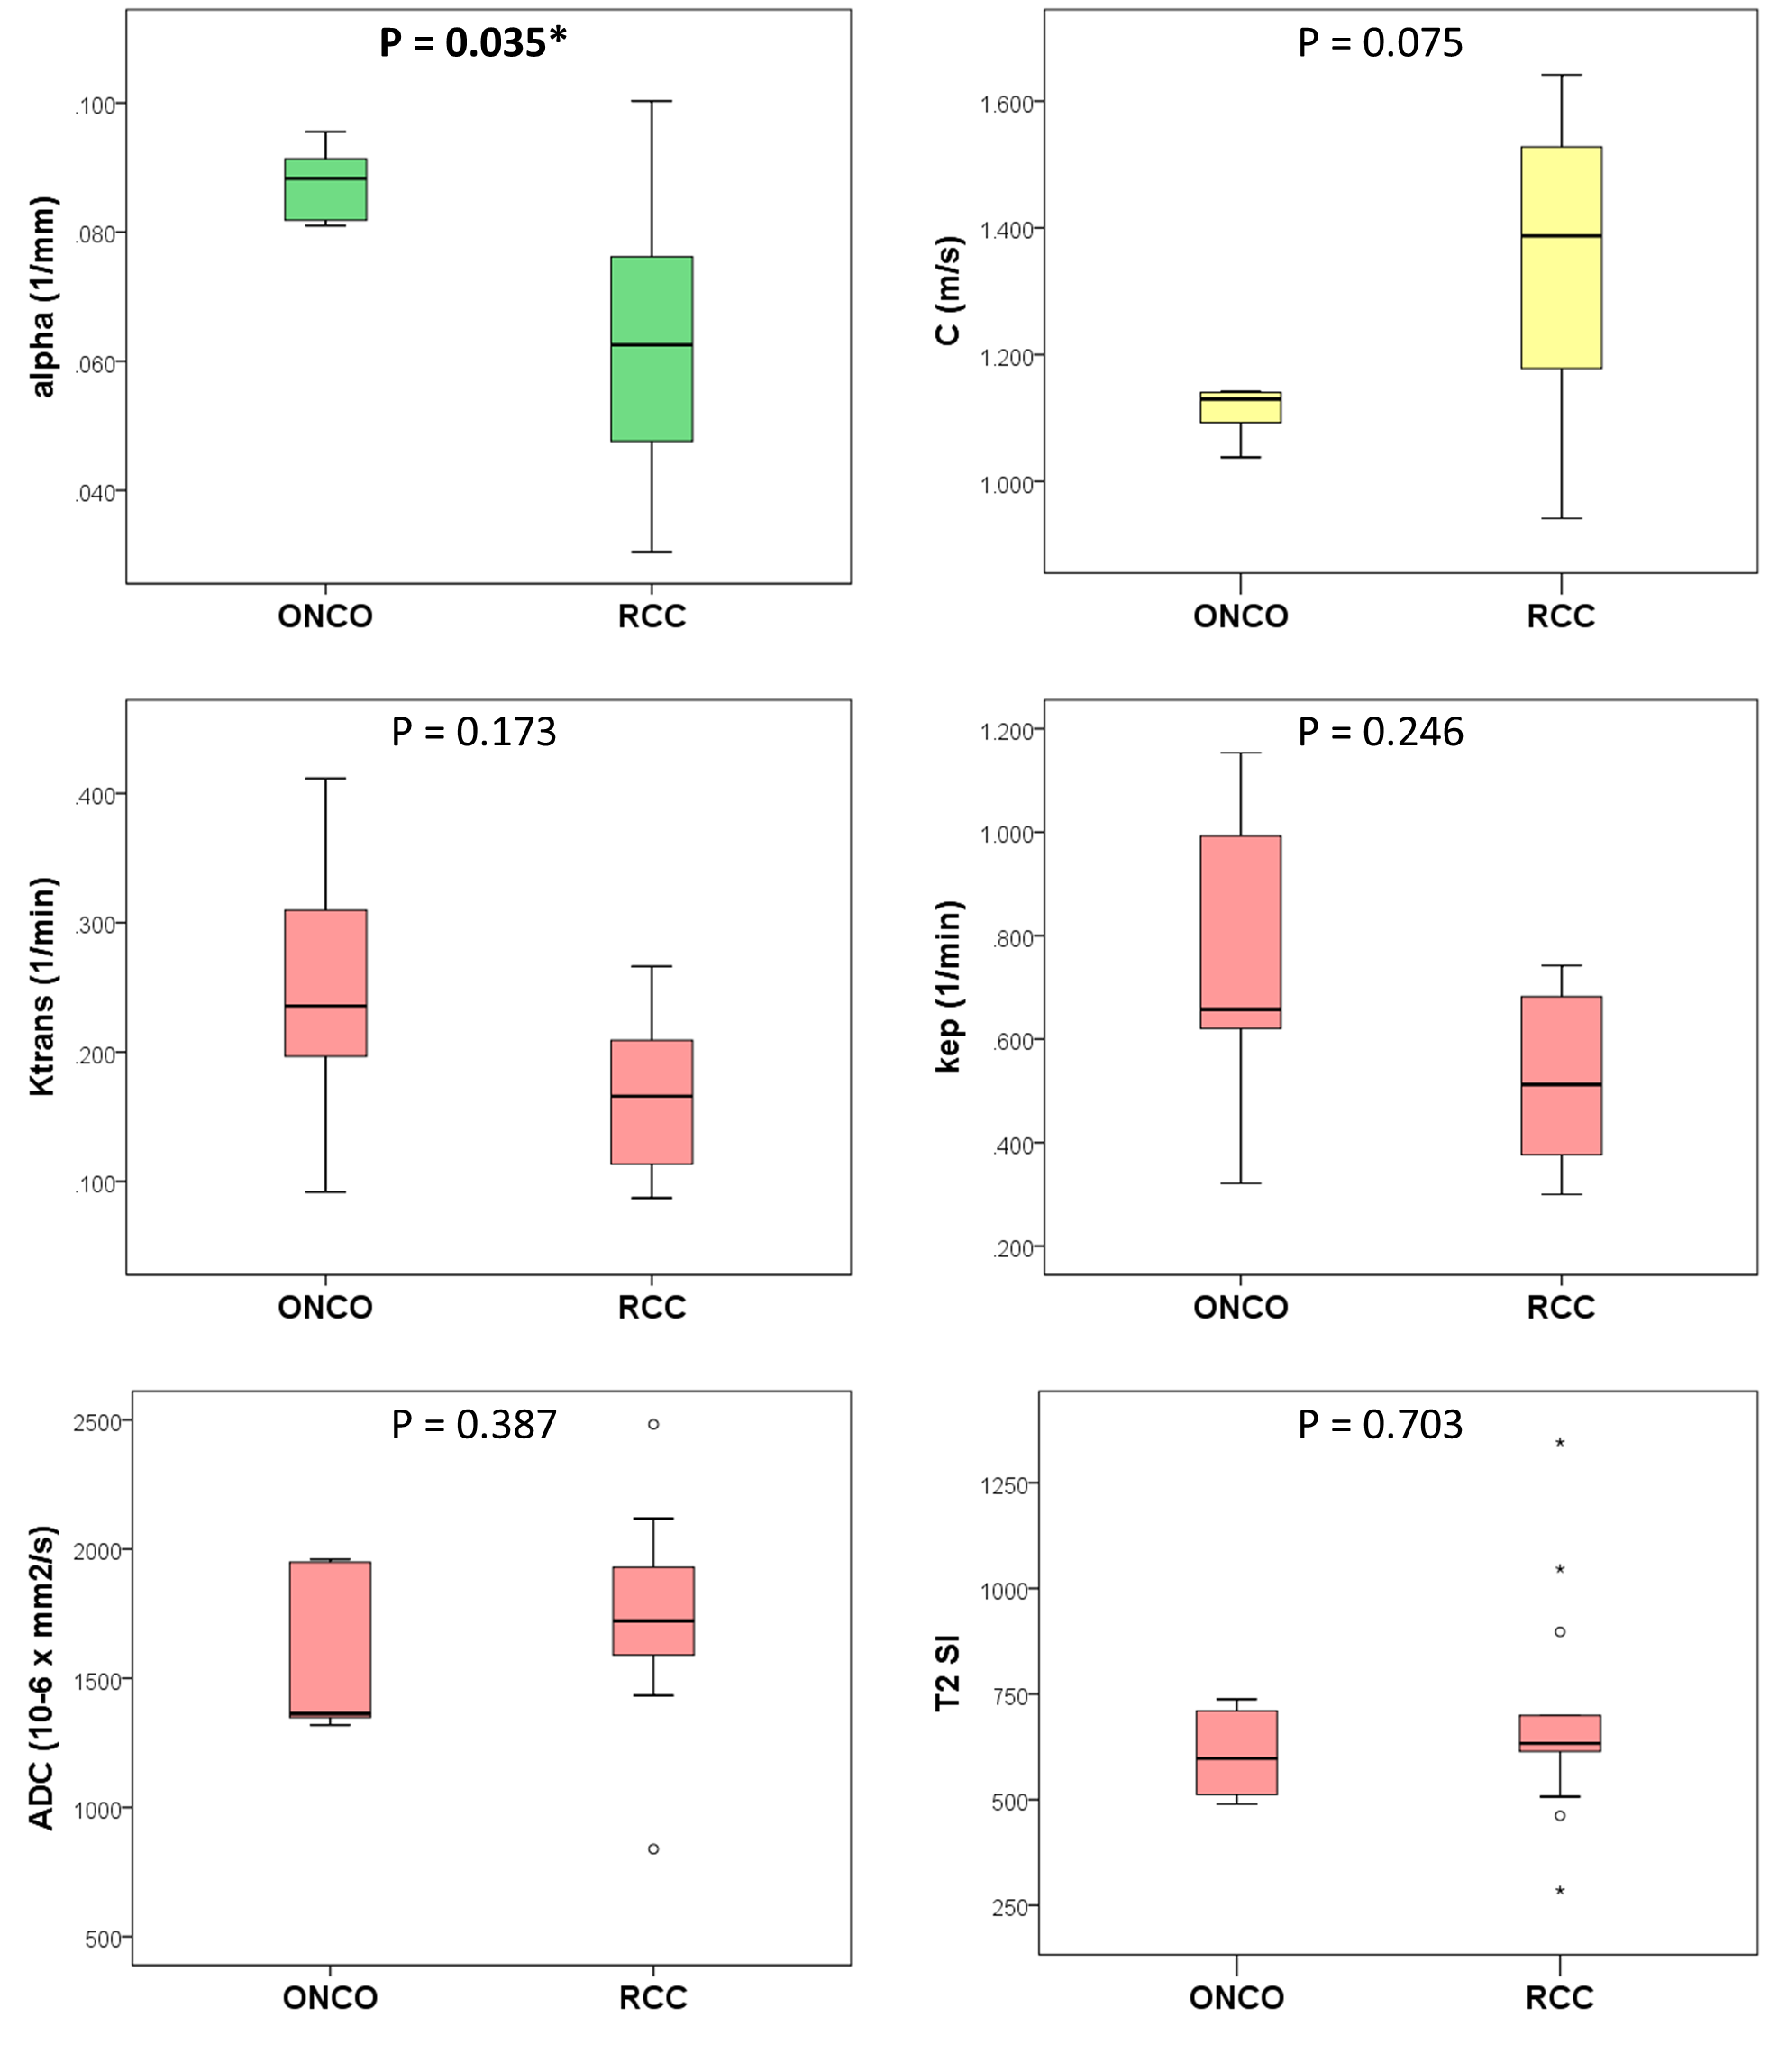
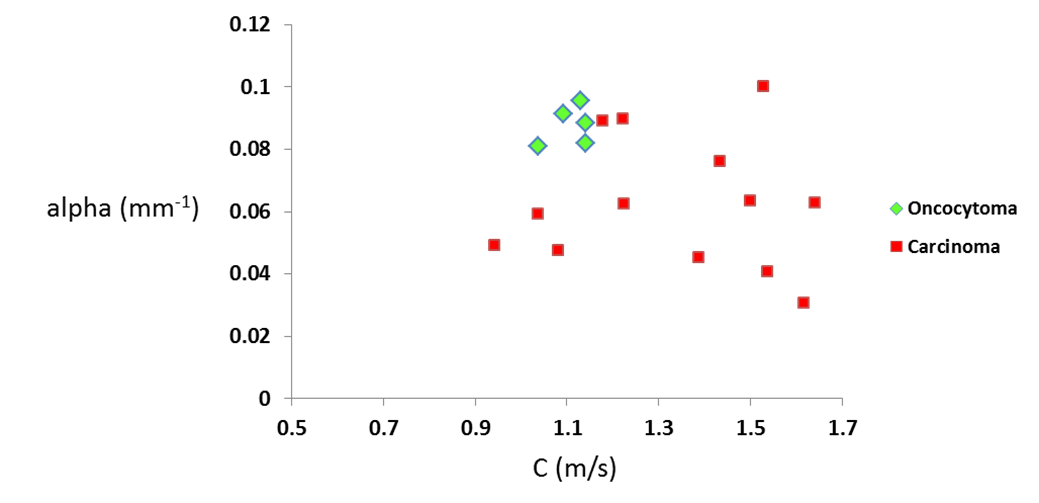
Shear wave attenuation α was the only parameter showing significant differences between the two histologies (P = 0.035), being higher in oncocytomas than in RCC: median (IQR) = 0.088 mm-1 (0.012) vs 0.062 mm-1 (0.036).
Shear wave velocity C was closest to statistical significance (P = 0.075), being lower in oncocytomas: 1.130 m/s (0.075) vs 1.387 m/s (0.403).
Oncocytomas appeared overall more vascular than RCC, with higher transfer and rate constants [Ktrans = 0.236 min-1 (0.216) vs 0.166 min-1 (0.105); kep = 0.657 min-1 (0.603) vs 0.512 min-1 (0.329); P = 0.173 and 0.246 respectively]. ADC and T2 signal intensity (SI) values were not discriminatory (Figure 4), ADC ranging between 838.92 x 10⁻⁶ and 2482.76 x 10-6 mm2/s across tumors (P = 0.387).
MRE α and C proved to be the strongest predictors of correct histology (Chi-squared P values = 0.015; Figure 5), followed by DCE MRI Ktrans (P = 0.049).
Conclusion
Our exploratory data suggests that biomechanical properties differ between renal oncocytoma and RCC, with higher median attenuation (α) and lower median velocity (C) in oncocytoma; α and C appear to be stronger discriminators than biomarkers provided by DCE MRI, DWI or T2-weighted imaging. This shows potential for clinical validation in a larger patient cohort.Acknowledgements
The authors acknowledge financial support from the Royal College of Radiologists through the Clinical Radiology Pump Priming Grant scheme; from the Department of Health via the National Institute for Health Research Comprehensive Biomedical Research Centre award to Guy’s and St Thomas’ NHS Foundation Trust, in partnership with King’s College London and King’s College Hospital NHS Foundation Trust; and from the King’s College London/University College London Comprehensive Cancer Imaging Centre funded by Cancer Research UK and Engineering and Physical Sciences Research Council, in association with the Medical Research Council and Department of Health.References
1. Hollingsworth JM, Miller DC, Daignault S, et al. Rising incidence of small renal masses: a need to reassess treatment effect. J Natl Cancer Inst. 2006; 98: 1331–1334.
2. Gill IS, Aron M, Gervais DA, et al. Clinical practice. Small renal mass. N Engl J Med. 2010; 362: 624–634.
3. Frank I, Blue ML, Cheville JC, et al. Solid renal tumors: an analysis of pathological features related to tumor size. J Urol. 2003; 170: 2217–2220.
4. Johnson DC, Vukina J, Smith AB, et al. Preoperatively misclassified, surgically removed benign renal masses: a systematic review of surgical series and United States population-level burden estimate. J Urol. 2015; 193: 30–35.
5. Pierorazio PM, Hyams ES, Tsai S, et al. Multiphasic enhancement patterns of small renal masses (<=4 cm) on preoperative computed tomography: utility for distinguishing subtypes of renal cell carcinoma, angiomyolipoma, and oncoctyoma. Urology. 2013; 81: 1265–1271.
6. Pedrosa I, Sun MR, Spencer M, et al. MR imaging of renal masses: correlation with findings at surgery and pathologic analysis. Radiographics. 2008; 28: 985–1003.
7. Garteiser P, Sahebjavaher RS, Ter Beek LC et al. Rapid acquisition of multifrequency, multislice and multidirectional MR elastography data with a fractionally encoded gradient echo sequence. NMR Biomed. 2013; 26(10): 1326-1335.
8. Sinkus R, Siegmann K, Xydeas T et al. MR elastography of breast lesions: understanding the solid/liquid duality can improve the specificity of contrast-enhanced MR mammography. Magn Reson Med. 2007; 58(6): 1135-1144.
Figures