0965
Tracking head movement inside an MR scanner using voltages induced in coils by time-varying gradients1Sir Peter Mansfield Imaging Centre, School of Physics and Astronomy, University of Nottingham, Nottingham, United Kingdom
Synopsis
We evaluate a new approach for monitoring head movement inside an MR scanner, which exploits the linear variation of the voltages induced in a set of coils by time-varying magnetic field gradients with respect to small changes in position/orientation. This approach was tested by attaching five coils to a structured agar phantom and a healthy volunteer’s head. The results suggest that it is possible to estimate the position and orientation with 0.22mm and 0.24° root-mean-square error using this set-up. The new approach could be used for prospective or retrospective motion correction.
Purpose:
To determine head pose within an MR scanner using measurements of gradient-induced voltage from a multiple coils.Background:
Subject movement can significantly degrade the quality of images acquired using MRI, leading to a strong interest in techniques for monitoring motion and using the resulting information for motion correction. Previous work has suggested that head movement can be monitored by using measurements of the change with respect to position of the voltages induced in a set of coils by time-varying magnetic field gradients [1-3]. This approach has potential advantages over other motion monitoring techniques [4-7] as it does not require line-of-sight access or significant modification of the imaging sequence. In the work described here, a set of coils were fixed to a phantom and a subject and the change in gradient induced voltage with respect to position was characterised. This information was then used to predict the position of the phantom/subject during an MR experiment.Methods:
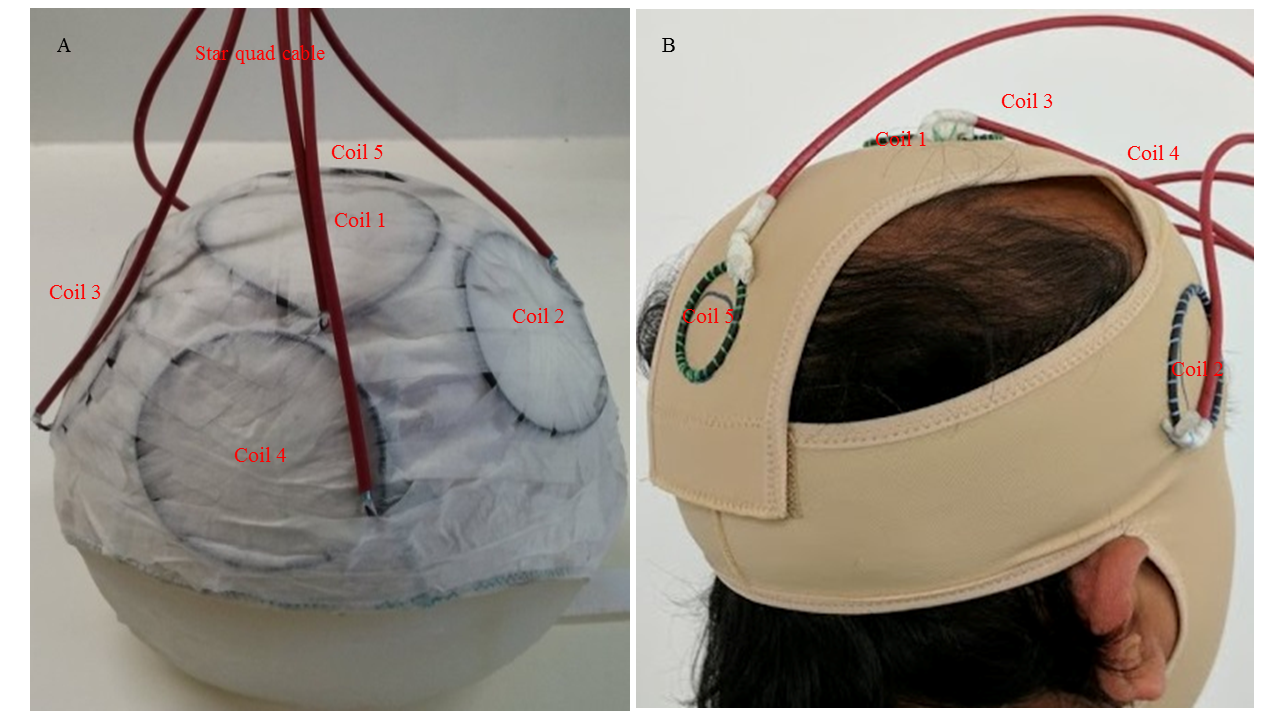
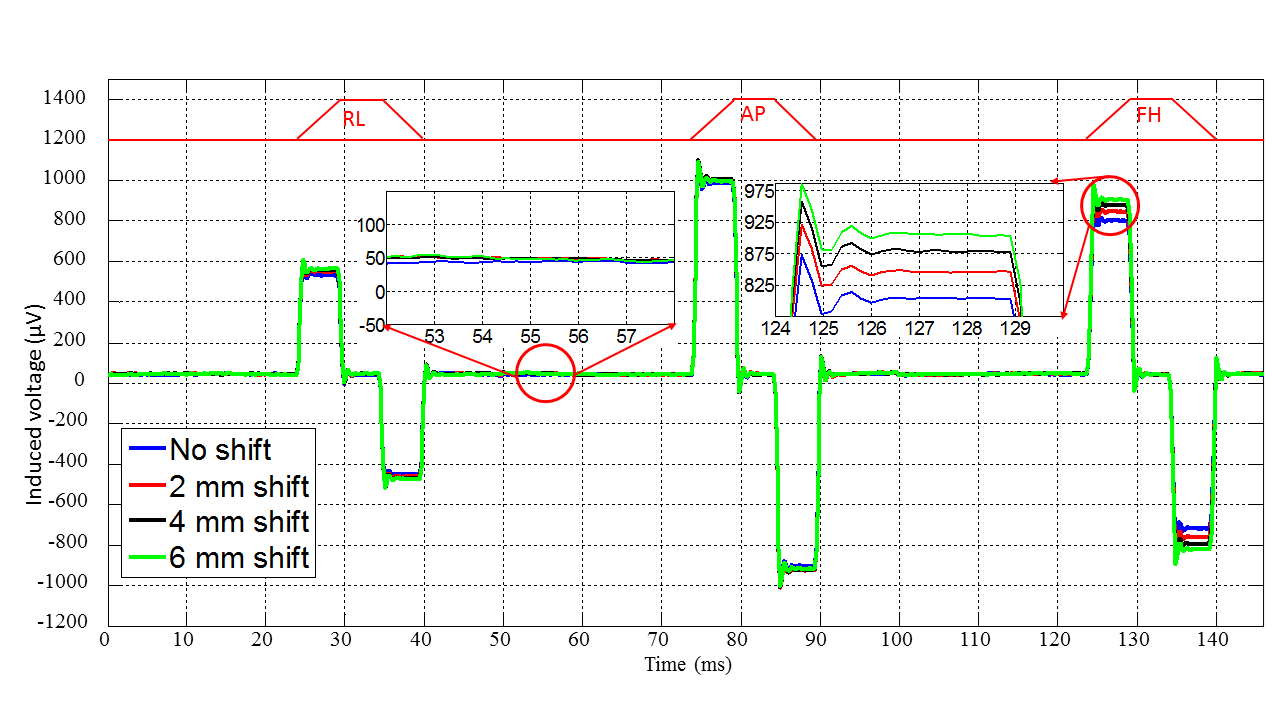
Experiments were carried out in a 3T Philips Achieva system. An MR-compatible ExG amplifier system (Brain Products GmbH, Munich) was used to measure the gradient-induced voltages in a set of five coils attached to a spherical agar phantom or to a human subject (Fig. 1). For these experiments, we used an EPI sequence which included three additional gradient pulses successively applied along the right-left (RL), anterior-posterior (AP) and foot-head (FH) directions in the quiet periods between slice acquisitions. Each pulse ramped-up/down over 5 ms at 4 Tm-1s-1 inducing voltages of several 100 μV in the coils (Fig. 2).
The positions (x, y and z) and orientations (θ, φ and ψ) of the head/phantom were also measured by co-registering images acquired during the experiments using the Statistical Parametric Mapping toolbox (SPM8). 3D gradient echo images (1.5 mm resolution; FOV = 200×200×179 mm3) were used for the phantom, whereas the EPI images (3.0 mm resolution; FOV = 240×240×96 mm3) were used for the subject. A training set of measurements was first made while the phantom/head was translated along the z-axis and then rotated about the x- and z-axes. Principal Component Analysis was applied to the position data estimated using SPM8 to identify the combination of parameter changes that best characterised the movements, and three principal components were then collected together into a design matrix along with a baseline term. The design matrix was fitted to the measured voltages using a pseudoinverse to determine the coefficients relating the co-ordinate changes and induced voltages. Experimental data were then collected while the subject/phantom underwent random changes in position. The coefficients derived from the training set were used to estimate the position changes and the results compared to movement parameters found using image co-registration.
Results:
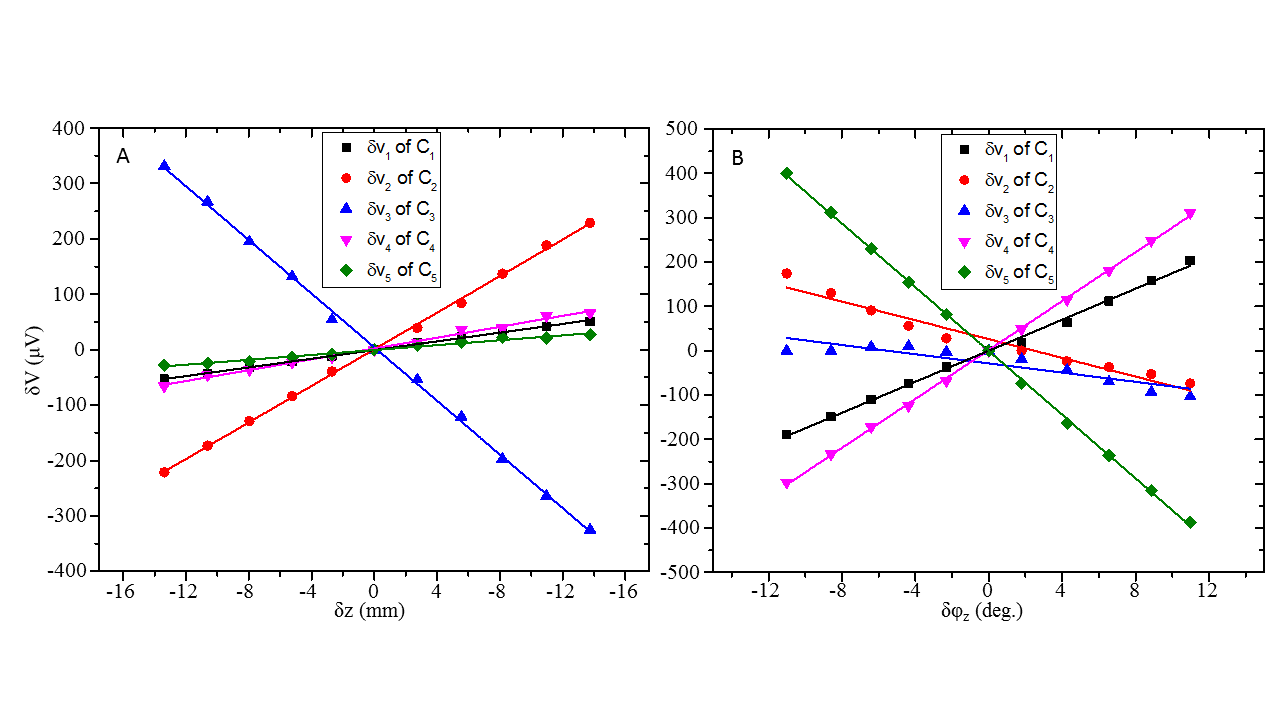
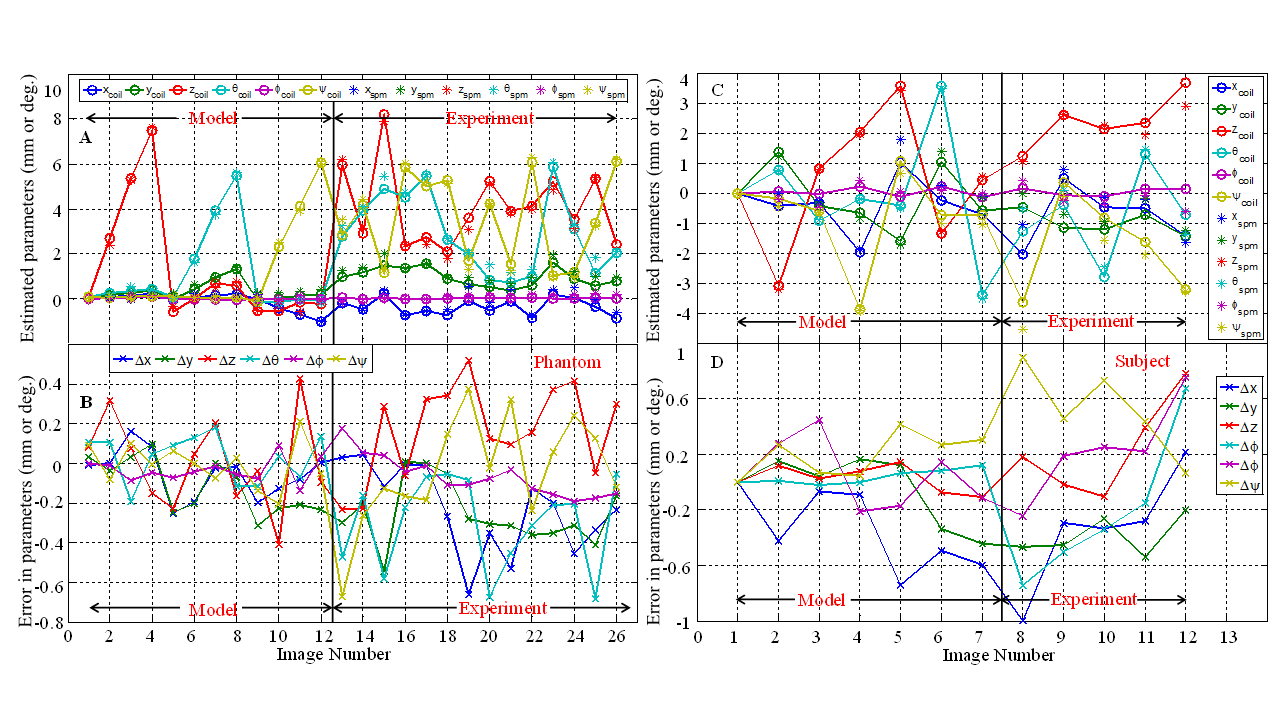
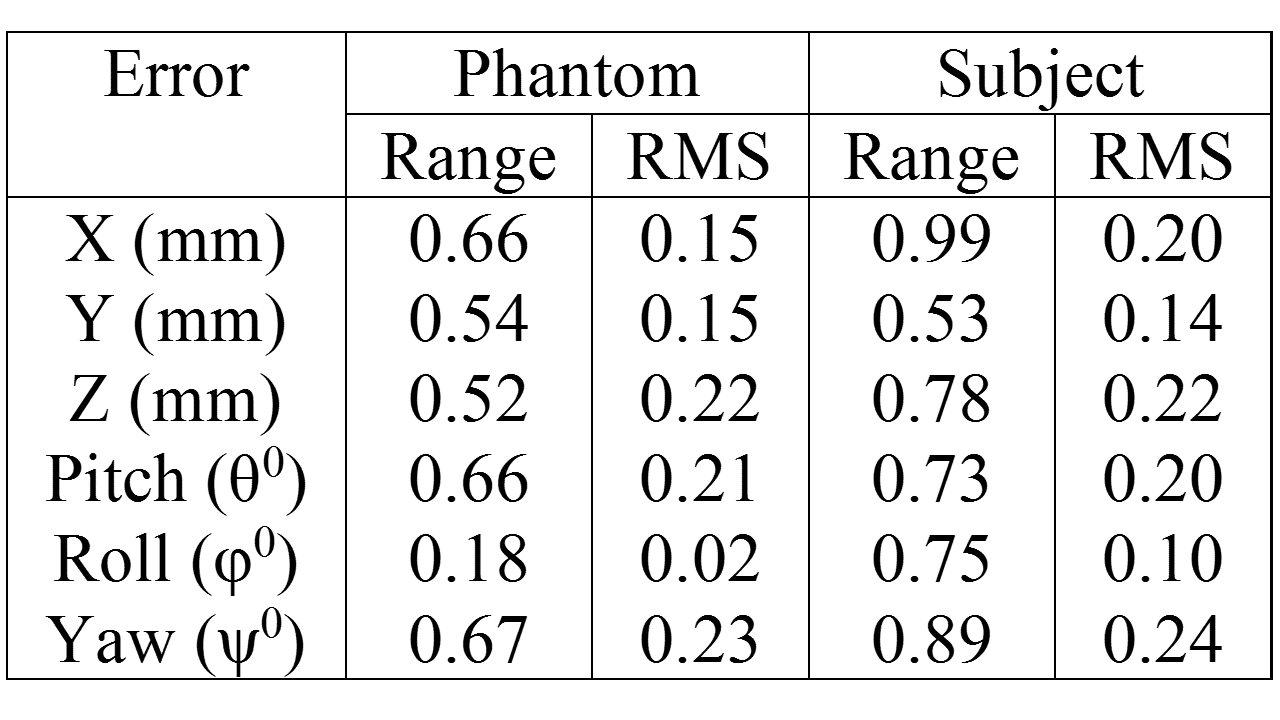
Figure 3 shows the variation of the voltages induced in the five coils by a time-varying x-gradient as a result of small changes in position and orientation of the phantom. Figure 4 (A&C) shows the changes in position and orientation estimated from SPM8 co-registration (*) and from the measured voltages (o) for the phantom and the subject. Figure 4 (C&D) show the differences in the positions estimated by using SPM8 and the model relating the change in induced voltages to position. Figure 5 lists the range and root-mean-square (RMS) amplitude of these differences for the phantom/subject data.
Discussion:
The results confirm that the amplitudes of the gradient-induced voltages vary linearly with changes in the coils’ translational positions and with small changes in their orientations (Fig. 3) and that the pattern of variation across coils is different for different types of movement (Figs. 3 and 4). This allows movement information to be derived from coil measurements (Fig. 4) by using a linear model incorporating coefficients calculated from a training data set for which complementary information about movement is available (e.g. from image co-registration, as used here, or from optical or navigator-based position measurements). The results from the human subject show that this approach can provide estimates of position and orientation with less than 0.22mm and 0.24° RMS error for head movements in the range of ±4 mm/degrees (Figs 4 and 5). The relatively larger errors for the subject data compared to the phantom may be due to the use of a smaller training data set and/or the greater variety of movements in this data set. A practical implementation of this approach would involve measuring the position-sensitive voltages induced by the imaging gradients rather than additional gradient pulses. This would speed up the model formation phase and increase the temporal resolution of position monitoring.Acknowledgements
University of Nottingham International Scholarship.References
[1] M. B. Vestergaard, J. Schulz, R. Turner and L. G. Hanson. Motion tracking from gradient induced signals in electrode recordings, Proc. of the ESMRMB 28th Annual Meeting, 368, (2011).
[2] E. H. Bhuiyan1, M. E. H. Chowdhury, P. M. Glover, and R. Bowtell. Proc. Intl. Soc. Mag. Reson. Med. 23, 1017 (2015).
[3] M. Andersen, K. H. Madsen, and L. G. Hanson; Prospective motion correction for MRI using EEG-equipment, Proc. Intl. Soc. Mag. Reson. Med. 24, 4254 (2016).
[4] Maclaren J, Herbst M, Speck O, Zaitsev M. Prospective motion correction in brain imaging: a review, Magn. Res. Med. 69, 621-636, (2013).
[5] Welch EB, Manduca A, Grimm RC, Ward HA, Jack CR Jr.; Spherical navigator echoes for full 3D rigid body motion measurement in MRI, Magn. Reson. Med. 47, 32–41, (2002).
[6] Ooi MB, Krueger S, Thomas WJ, Swaminathan SV, Brown TR., Prospective real-time correction for arbitrary head motion using active markers Magn. Reson. Med. 62, 943-954 (2009).
[7] R. R. Jensen, C. Benjaminsen, A.E. Hansen, R. Larsen, and O.V. Olesen; Markerless motion correction in MRI, Proc. Intl. Soc. Mag. Reson. Med. 23, 0587 (2015).
Figures