0961
Dynamic resting state fMRI in mice: detection of Quasi-Periodic Patterns1Bio-Imaging Lab, Antwerpen, Belgium, 2MIND lab, Atlanta, GA
Synopsis
We report, to our knowledge, the first application of a dynamic rsfMRI approach in mice and show the reliable detection of Quasi-Periodic Patterns (QPP) at both the group-level as well as in single-subject data. These patterns are consistent with QPPs detected previously in humans and rats, displaying a high intensity wave spreading across the cortex from lateral towards upward medial, followed by a low intensity wave in the same direction. These findings are promising for the application of QPPs towards investigating mouse resting state functional connectivity and its development as a potential new pre-clinical tool.
Introduction
Recently, a vast body of emerging literature has indicated that dynamic over ‘static’ analysis of temporal features in BOLD resting state (rs) functional connectivity, as measured with fMRI, provides many additional insights into the macroscale organization and dynamics of neural activity1,2. This drives both fundamental research into studying features of large-scale brain functioning, while also enabling new (pre-)clinical applications for the investigation and detection of neurological disorders. These studies however remained mostly limited to humans, and in lesser extent to monkeys and rats3,4. No work in mice has been reported, yet the high throughput and wide range of available mouse disease models compels for exploration. Here, we present, to our knowledge, the first application of a dynamic rsfMRI approach to mouse resting state data and show the reliable detection of Quasi-Periodic Patterns (QPP) in the BOLD fluctuations, both on a group and single subject level.Methods
RsfMRI was acquired in 11 five-month old C57BL/6 mice, on a 9.4T Biospec scanner, using a high temporal resolution EPI sequence (repetitions:1200; TR:500ms; TE:16ms; FA:55°; FOV:(20x20)mm2; matrix:128x64; 3 axial slices; thickness/separation:0.4mm/0.1mm). Slices were positioned centered around the somatosensory cortex. Animals were anesthetized with isoflurane (0.4%) and medetomidine bolus (0.1mg/kg) + continuous infusion (0.05mg/kg), starting at 15min post-bolus. Scans were acquired 40min post-bolus.
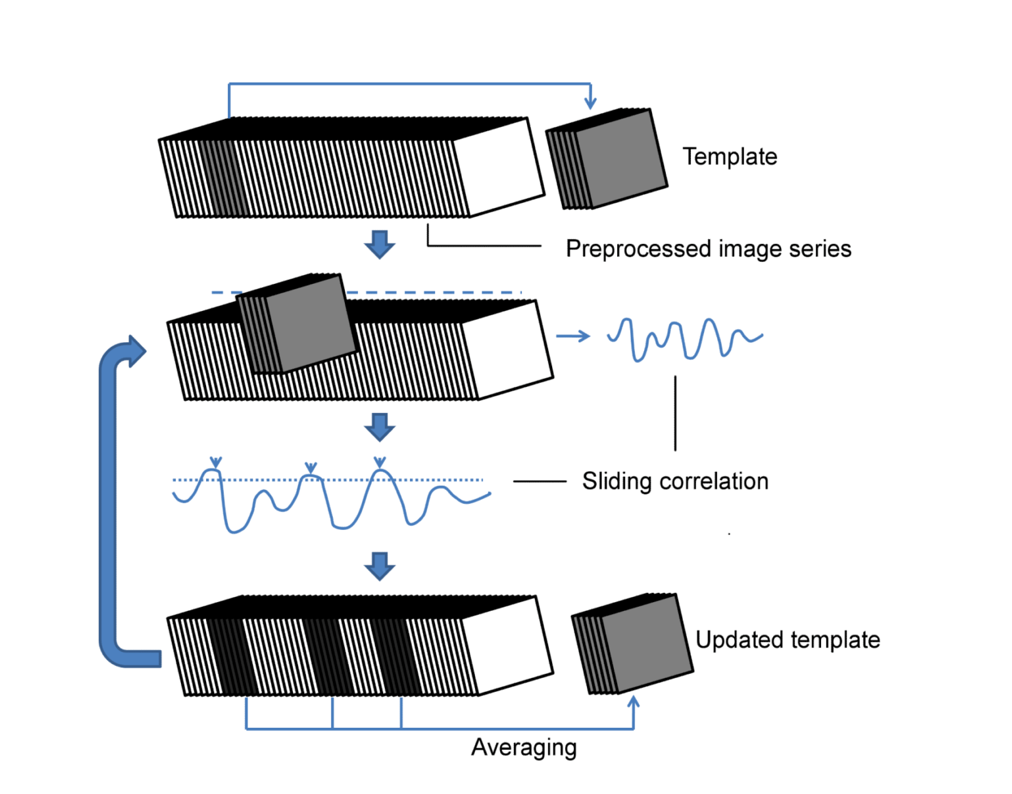
For group-level analysis, data was smoothed, realigned and normalized to a user-specified template animal, using Statistical Paramagnetic Mapping 12 (SPM12), followed by band pass filtering (0.01-0.2Hz), quadratic detrending, demeaning, and application of a ventricular mask. The preprocessed middle slice image series of all animals were then concatenated, before passing them to the QPP detection algorithm5 (see Fig.1). For single subject analysis, no normalization was performed and the image series were individually passed to the algorithm. All analysis was performed in MATLAB2015a (Mathworks).
Results
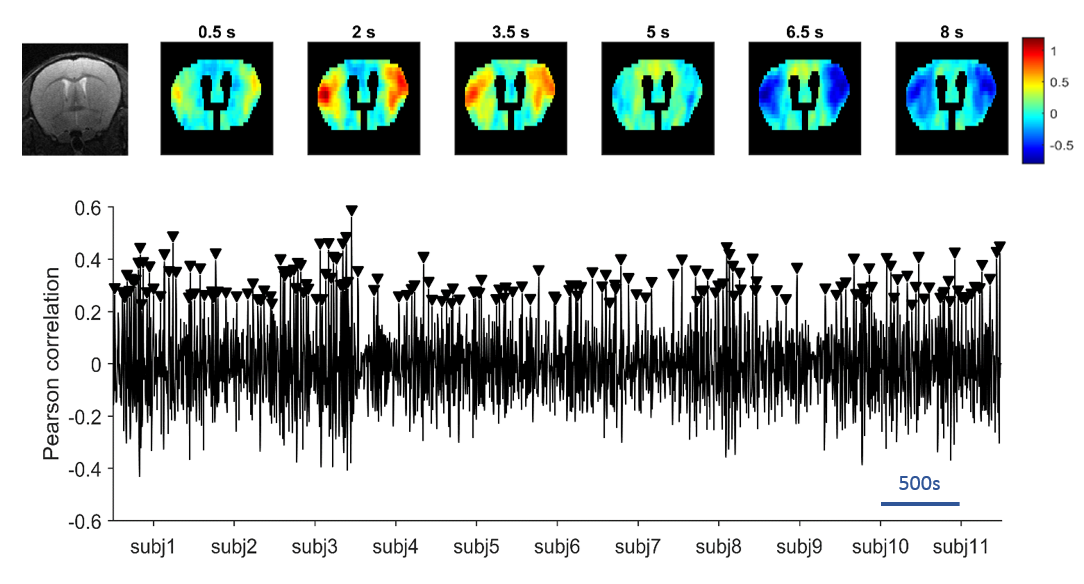
The QPP detection algorithm at the group-level was run at different window sizes and was repeated 500 times for each, followed by kmeans clustering and silhouette detection to determine the respective ideal QPPs. All QPPs showed a high spread of occurrences throughout the different subjects (see Fig.2 for illustration), while an increase in window size correlated with a decrease in QPP frequency.
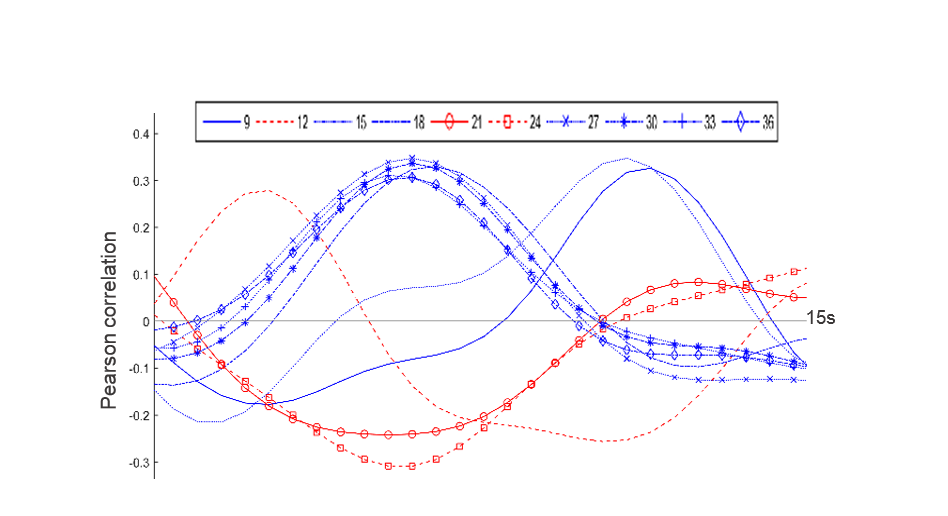
Inspection of all obtained QPPs indicated the presence of a common pattern, which was however displayed at different subsections and offsets, depending on the window size. The different representations of QPPs can be better understood from the offsets in their correlation time series (see Fig.3), illustrating how the different QPPs are detected at other starting time points.
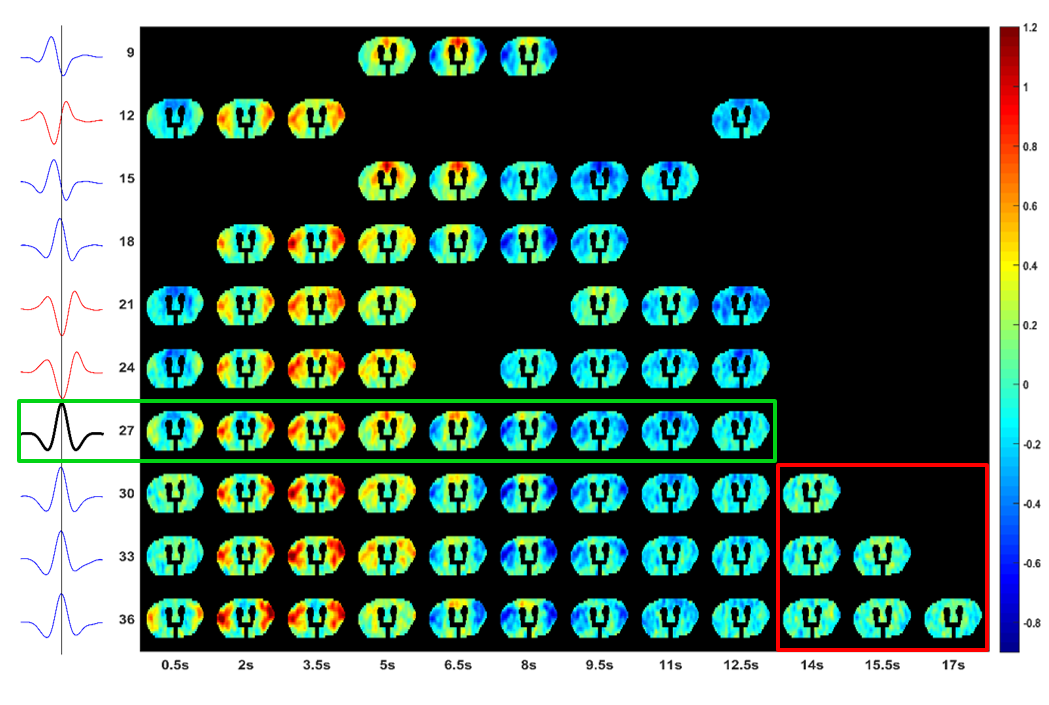
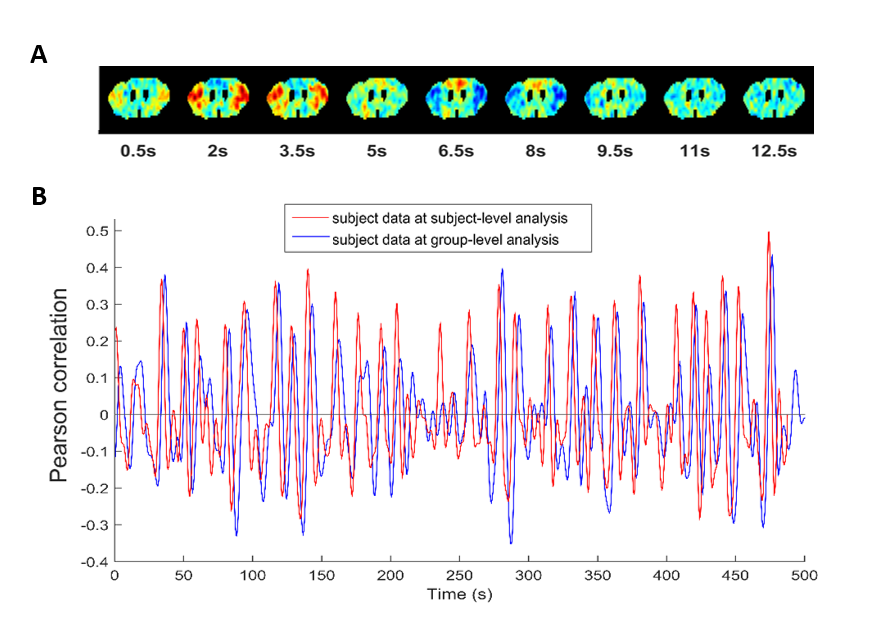
At a window size of 27 images, we inferred a full non-redundant coverage with a representative starting time point (see Fig.4). The pattern shows a high intensity wave from lateral towards upward medial, followed by a low intensity wave in the same direction. The other QPP, due to their quasi-periodic nature, can be circularly shifted to match the start of QPP27 (see Fig.4).
Further, single subject analysis with the same window sizes showed QPP patterns and detection time points consistent with those observed in the same subject, analyzed at the group level (see Fig.5).
Discussion & Conclusion
We present an initial framework to interpret the detection of Quasi-Periodic Patterns (QPP) in mouse rsfMRI data. With this, we show the reliable detection of QPPs at both the group-level as well as in single-subject data. The latter is extremely interesting towards the development of more reliable rsfMRI techniques and analysis strategies in (pre-clinical) mice studies. Furthermore, the observed patterns are consistent with QPPs previously detected in humans and rats, where they were linked with infraslow local field potentials, indicating preservation between species and a relationship with an underlying neural basis5,6. These findings are promising for the application of QPPs towards investigating mouse resting state functional connectivity and its development as a potential pre-clinical biomarker.
Work is currently ongoing to fully understand these QPPs and how they relate to the functional connectivity observed in rsfMRI, both in control animals and in mouse disease models. Additionally, we are investigating the potential confounds induced by physiological parameters.
Acknowledgements
No acknowledgement found.References
1. Deco G, Jirsa VK, Mcintosh AR. Emerging concepts for the dynamical organization of resting-state activity in the brain. 2011;12(january). doi:10.1038/nrn2961.
2. Hutchison RM, Womelsdorf T, Allen E a., et al. Dynamic functional connectivity: Promise, issues, and interpretations. Neuroimage. 2013;80:360-378. doi:10.1016/j.neuroimage.2013.05.079.
3. Keilholz SD. The neural basis of time-varying resting-state functional connectivity. Brain Connect. 2014;4(10):769-779. doi:10.1089/brain.2014.0250.
4. Keilholz SD, Magnuson ME, Pan W-J, Willis M, Thompson GJ. Dynamic properties of functional connectivity in the rodent. Brain Connect. 2013;3(1):31-40. doi:10.1089/brain.2012.0115.
5. Majeed W, Magnuson M, Hasenkamp W, et al. Spatiotemporal dynamics of low frequency BOLD fluctuations in rats and humans. Neuroimage. 2011;54(2):1140-1150. doi:10.1016/j.neuroimage.2010.08.030.Spatiotemporal.
6. Pan WJ, Thompson GJ, Magnuson ME, Jaeger D, Keilholz S. Infraslow LFP correlates to resting-state fMRI BOLD signals. Neuroimage. 2013;74:288-297. doi:10.1016/j.neuroimage.2013.02.035.
Figures