0958
Hyper Network Analysis on Paired Images1Department of Biostatistics and Medical Informatics, University of Wisconsin, Madison, WI, United States, 2Department of Psychology, Vanderbilt University, Nashville, TN, United States, 3Department of health Studies and Psychiatry and Behavioral Neuroscience, University of Chicago, Chicago, IL, United States
Synopsis
We present a new integrative framework for analyzing paired images using hyper-networks. The method is applied to twin fMRI study in characterizing the amount of heritability in the functional network.
Introduction
There are many studies related to paired brain images: longitudinal studies with two repeat scans1, multimodal imaging studies2, twin studies3. Paired images are usually analyzed by relating voxel measurements that anatomically match across two images. We present a new framework that can integrate paired images in a holistic fashion by pairing every possible combination of voxels. This is achieved using a hyper-network that can connect multiple networks into one larger hyper-network. Although hyper-networks are often used in machine learning4, the concept has not been widely used in brain imaging. Jie constructed hyper-networks from the resting-state fMRI in classifying MCI from AD5. Bezerianos constructed hyper-networks from the coupling of EEG activity of pilots and copilots operating an aircraft6. In this study, the method is applied in relating twin images and determining the heritability of a fMRI network.Methods
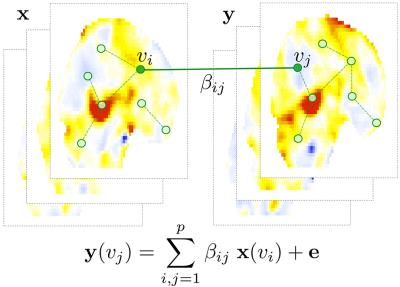
Sparse hyper-connectivity: Consider a collection of paired images $$$(x_1,y_1),(x_2, y_2),\cdots,(x_n, y_n).$$$ Let $$${\bf x}=(x_1,\cdots,x_n)'$$$ and $$${\bf y}=(y_1,\cdots,y_n)'$$$ be the vectors of images. We set up a hyper-network by relating the paired image vectors at different voxels $$$v_i$$$ and $$$v_j$$$: $${\bf y}(v_j)=\sum_{i{\neq}j}\beta_{ij}\;{\bf x}(v_i)+{\bf{e}}$$ for zero-mean noise vector e (Figure-1). The parameters $$$\beta=(\beta_{ij})$$$ are the weights of the hyper-edges. It is likely that we have significantly more number of voxels ($$$p$$$) than the number of images ($$$n$$$), so we estimate the parameters using sparse regression7: $$\widehat{\beta}(\lambda)=\arg\min_{\beta}\frac{1}{2}\sum_{i,j=1}^p\parallel{\bf y}(v_j)-\sum_{i,j=1}^n\beta_{ij}\;{\bf x}({v_i})\parallel^{2}+\lambda\sum_{i,j =1}^p| \beta_{ij} |.$$
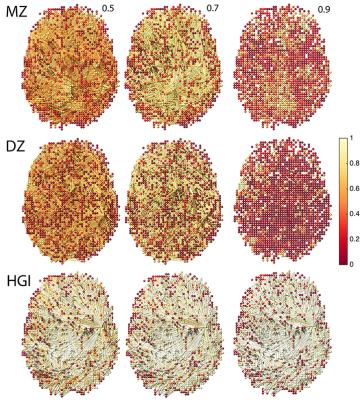
Sparse cross-correlations: For this study, we consider a simpler model $$\widehat{\beta}(\lambda)=\arg\min_{\beta}\frac{1}{2}\sum_{i,j=1}^p\parallel{\bf y}(v_j)-\beta_{ij}\;{\bf x}({v_i})\parallel^{2}+\lambda\sum_{i,j =1}^p|\beta_{ij}|.$$ Without loss of generality, we can enter and scale $$${\bf x}$$$ and $$${\bf y}$$$ such that $$\sum_{k=1}^n x_k(v_i) = \sum_{k=1}^ny_k(v_i)=0,\| {\bf x}(v_i)\|^2=\|{\bf y}(v_i)\|^2=1.$$ Then we have $$\widehat{\beta}_{ij}(\lambda)=\begin{cases}{\bf x}'(v_i) {\bf y}(v_j)-\lambda & \mbox{if }\;{\bf x}'(v_i) {\bf y}(v_j)>\lambda \\0& \mbox{if }\;|{\bf x}'(v_i) {\bf y}(v_j)|\leq \lambda \\{\bf x}'(v_i) {\bf y}(v_j)+\lambda & \mbox{if }\;{\bf x}'(v_i){\bf y}(v_j)<-\lambda \end{cases},$$ which is the sparse cross-correlation7 (Figure-2).
Topological inference: The hyper-network is binarized by assigning value 1 to any nonzero hyper-edge weight and 0 otherwise. The resulting binary graph denoted as $$$G_{\lambda}$$$ induces a graph filtration2,7, a collection of nested graphs:$$G_{\lambda_{(1)}}\supset G_{\lambda_{(2)}}\supset G_{\lambda_{(3)}}\supset\cdots\supset G_{\lambda_{(q)}},$$ where $$0 \leq \lambda_{(1)} \leq \lambda_{(2)} \leq \lambda_{(3)} \cdots \leq \lambda_{(q)}$$ are the sorted hyper-edge weights.
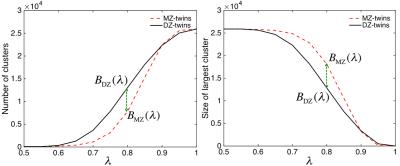
Let $$$B$$$ be a monotonic graph function such as the number of connected components and the size of the largest component (Figure-3). Given two hyper-networks $$$G_1,G_2$$$ and corresponding graph filtrations $$$G_{1\lambda},G_{2\lambda}$$$, we test the null hypothesis of the equivalence of the two monotonic functions: $$H_0: B({G_1}_{\lambda}) = B({G_2}_{\lambda}) \; \mbox{ for all } \lambda\geq0.$$ The test statistic7 $$D_p=\sup_{\lambda}|B({G_1}_{\lambda})-B({G_2}_{\lambda})|$$ is used to compute the p-value using $$P\left( D_{p}/\sqrt{2(p-1)}\leq d\right)=1-2\sum_{i=1}^{\infty}(-1)^{i-1}e^{-2i^2d^2}.$$
Application
Data: We applied the method to the problem of determining the heritability of a fMRI network at the network level. The study consists of 11 monozygotic (MZ) and 9 same-sex dizygotic (DZ) twin pairs of 3T fMRI acquired in Intera-Achiava Phillips MRI scanners with a state-of-the-art 32 channel SENSE head coil. BOLD functional images were acquired with a gradient echoplanar sequence, with 38 axial-oblique slices (3 mm thick), TR 2000ms, TE 25ms, flip angle=90. Subjects completed monetary incentive delay task8 involving $0, 1 and 5 rewards. The interest is in knowing the extent of the genetic influence on the functional network of these participants while anticipating the high reward as measured by delays in hitting the response button. After fitting a GLM at each voxel, we obtained the contrast maps testing the significance of activity in the delay period for $5 trials relative to $0 reward . The paired contrast maps are $$${\bf x}$$$ and $$${\bf y}$$$ in the model (Figure-1).
Heritability index (HI) determines the amount of variations due to genetic influence in a population and estimated using Falconer's formula. Extending Falcorner’s formula, HI matrix on the hyper-edges is given by $$\mbox{HI}=2\left(\widehat{\beta}_{MZ}-\widehat{\beta}_{DZ}\right),$$ the twice difference in the sparse cross-correlations in MZ- and DZ-twins. The diagonal entries are the node-level HI at each vertex (Figure-2). The statistical significance of HI is determined using statistic $$$D_p$$$.
Results
Figure-2 shows the estimated HI at the network level. For the number of clusters and for the size of largest cluster, $$$p$$$-values are less than 0.00002 and 0.00001 respectively indicating very strong significance of HI in the functional network. This is the first study of determining HI of a large-scale fMRI network where every voxel is a network node.Conclusion
In this study, we presented the hyper-network analysis framework for analyzing paired images. Although the method is applied in twin fMRI data, the method can be also applied to other paired image studies such as longitudinal and multimodal studies.Acknowledgements
This work was supported by NIH Research Grants 5 R01 MH098098 04 and EB022856.References
[1] P.A. Freeborough and N.C. Fox. Modeling brain deformations in Alzheimer dis- ease by fluid registration of serial 3D MR images. Journal of Computer Assisted Tomography, 22:838–843, 1998.
[2] H. Lee, H. Kang, M.K. Chung, S. Lim, B.-N. Kim, and D.S. Lee. Integrated mul- timodal network approach to PET and MRI based on multidimensional persistent homology. Human Brain Mapping, in press, preprint: arXiv:1410.4620, 2016.
[3] P.M. Thompson, T.D. Cannon, K.L. Narr, T. van Erp, V.P. Poutanen, M. Hut- tunen, J. Lonnqvist, C.G. Standertskjold-Nordenstam, J. Kaprio, M. Khaledy. Genetic influences on brain structure. Nature Neuroscience, 4:1253–1258, 2001.
[4] B.-T. Zhang. Hypernetworks: A molecular evolutionary architecture for cognitive learning and memory. IEEE Computational Intelligence Magazine, 3:49–63, 2008.
[5] B. Jie, D. Shen, and D. Zhang. Brain connectivity hyper-network for MCI classifi- cation. In International Conference on Medical Image Computing and Computer- Assisted Intervention, pages 724–732, 2014.
[6] A. Bezerianos, Y. Sun, Y. Chen, K. F. Woong, F. Taya, P. Arico, G. Borghini, F. Babiloni, and N. Thakor. Cooperation driven coherence: Brains working hard together. In 37th Annual International Conference of the IEEE Engineering in Medicine and Biology Society (EMBC), pages 4696–4699, 2015.
[7] M.K. Chung, V.G. Vilalta, P.J. Rathouz, B.B. Lahey, and D.H. Zald. Mapping heritability of large-scale brain networks with billion connections via persistent homology. arXiv preprint arXiv:1509.04771, 2016.
[8] B. Knutson, C.M. Adams, G.W. Fong, and D. Hommer. Anticipation of increasing monetary reward selectively recruits nucleus accumbens. Journal of Neuroscience, 21:RC159, 2001.
Figures


