0957
Spontaneous Activity Patterns Reveal Non-Retinotopic Functional Parcellation and Organization of Human Visual Cortex1Electrical and Computer Engineering, Purdue University, West Lafayette, IN, United States, 2Biomedical Engineering, Purdue University, West Lafayette, IN, United States
Synopsis
We applied Independent Component Analysis (ICA) for mapping cortical visual areas and networks based on resting-state fMRI signals within the visual cortex. We found that spontaneous brain activity at rest exhibits reliable network patterns not only in the whole-brain scale but also in much finer scales. These networks show notable differences compared to the classical visual regions defined with retinotopic mapping or cytoarchitecture. In addition, these networks are anatomically segregated and functionally specialized into three modules: the dorsal pathway, the ventral pathway, and the early visual areas shared by these two pathways.
Purpose
While resting-state functional magnetic resonance
imaging (rs-fMRI) has been widely explored to map the brain’s intrinsic
functional networks in the whole-brain scale, intrinsic networks in
finer spatial scales remain under-investigated. In this study, we explored a
new application of Independent Component Analysis (ICA) for mapping cortical
visual areas and networks based on resting-state fMRI signals within the visual
cortex. In such a sub-system scale, the fine-grained activity patterns derived
from ICA were characterized, interpreted, and further compared against cortical
folding1, retinotopy2, cytoarchitecture3,
myeloarchitecture2, and the latest multi-modal cortical parcellation4.
Method
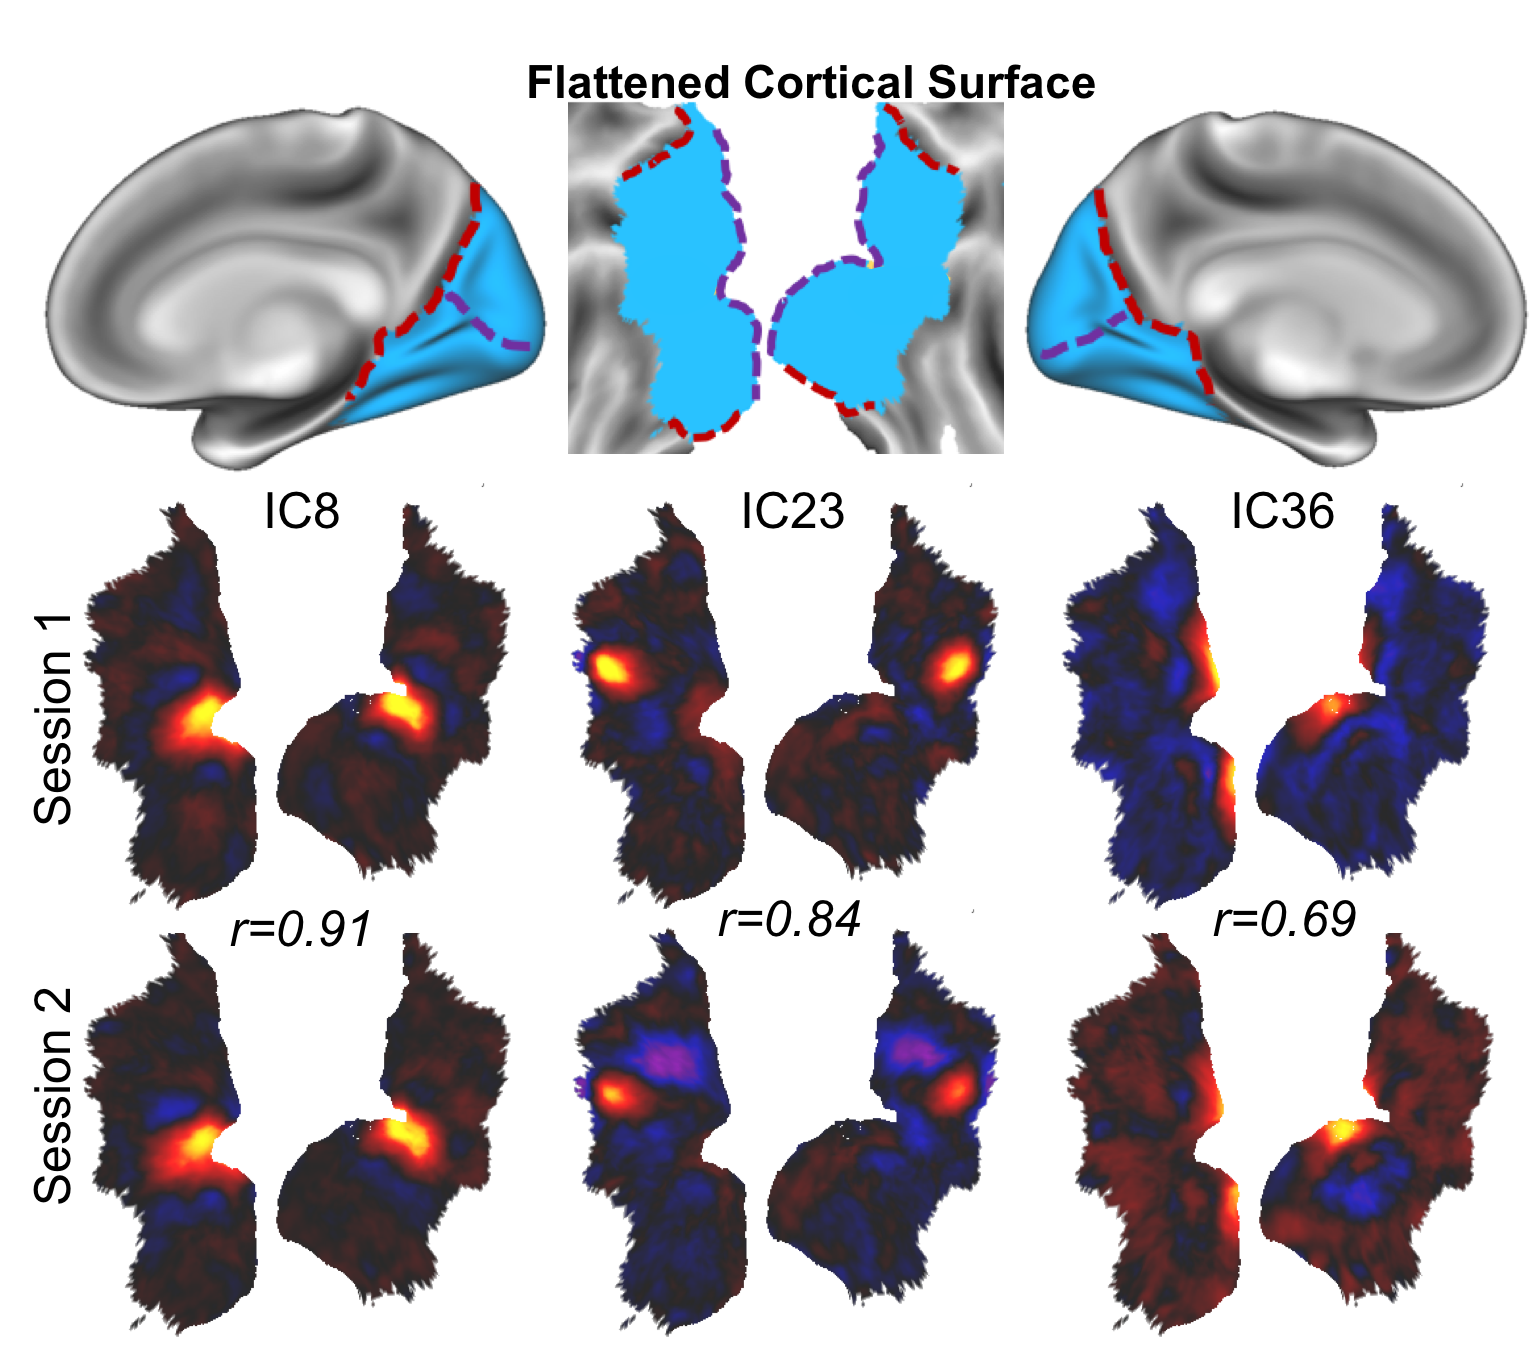
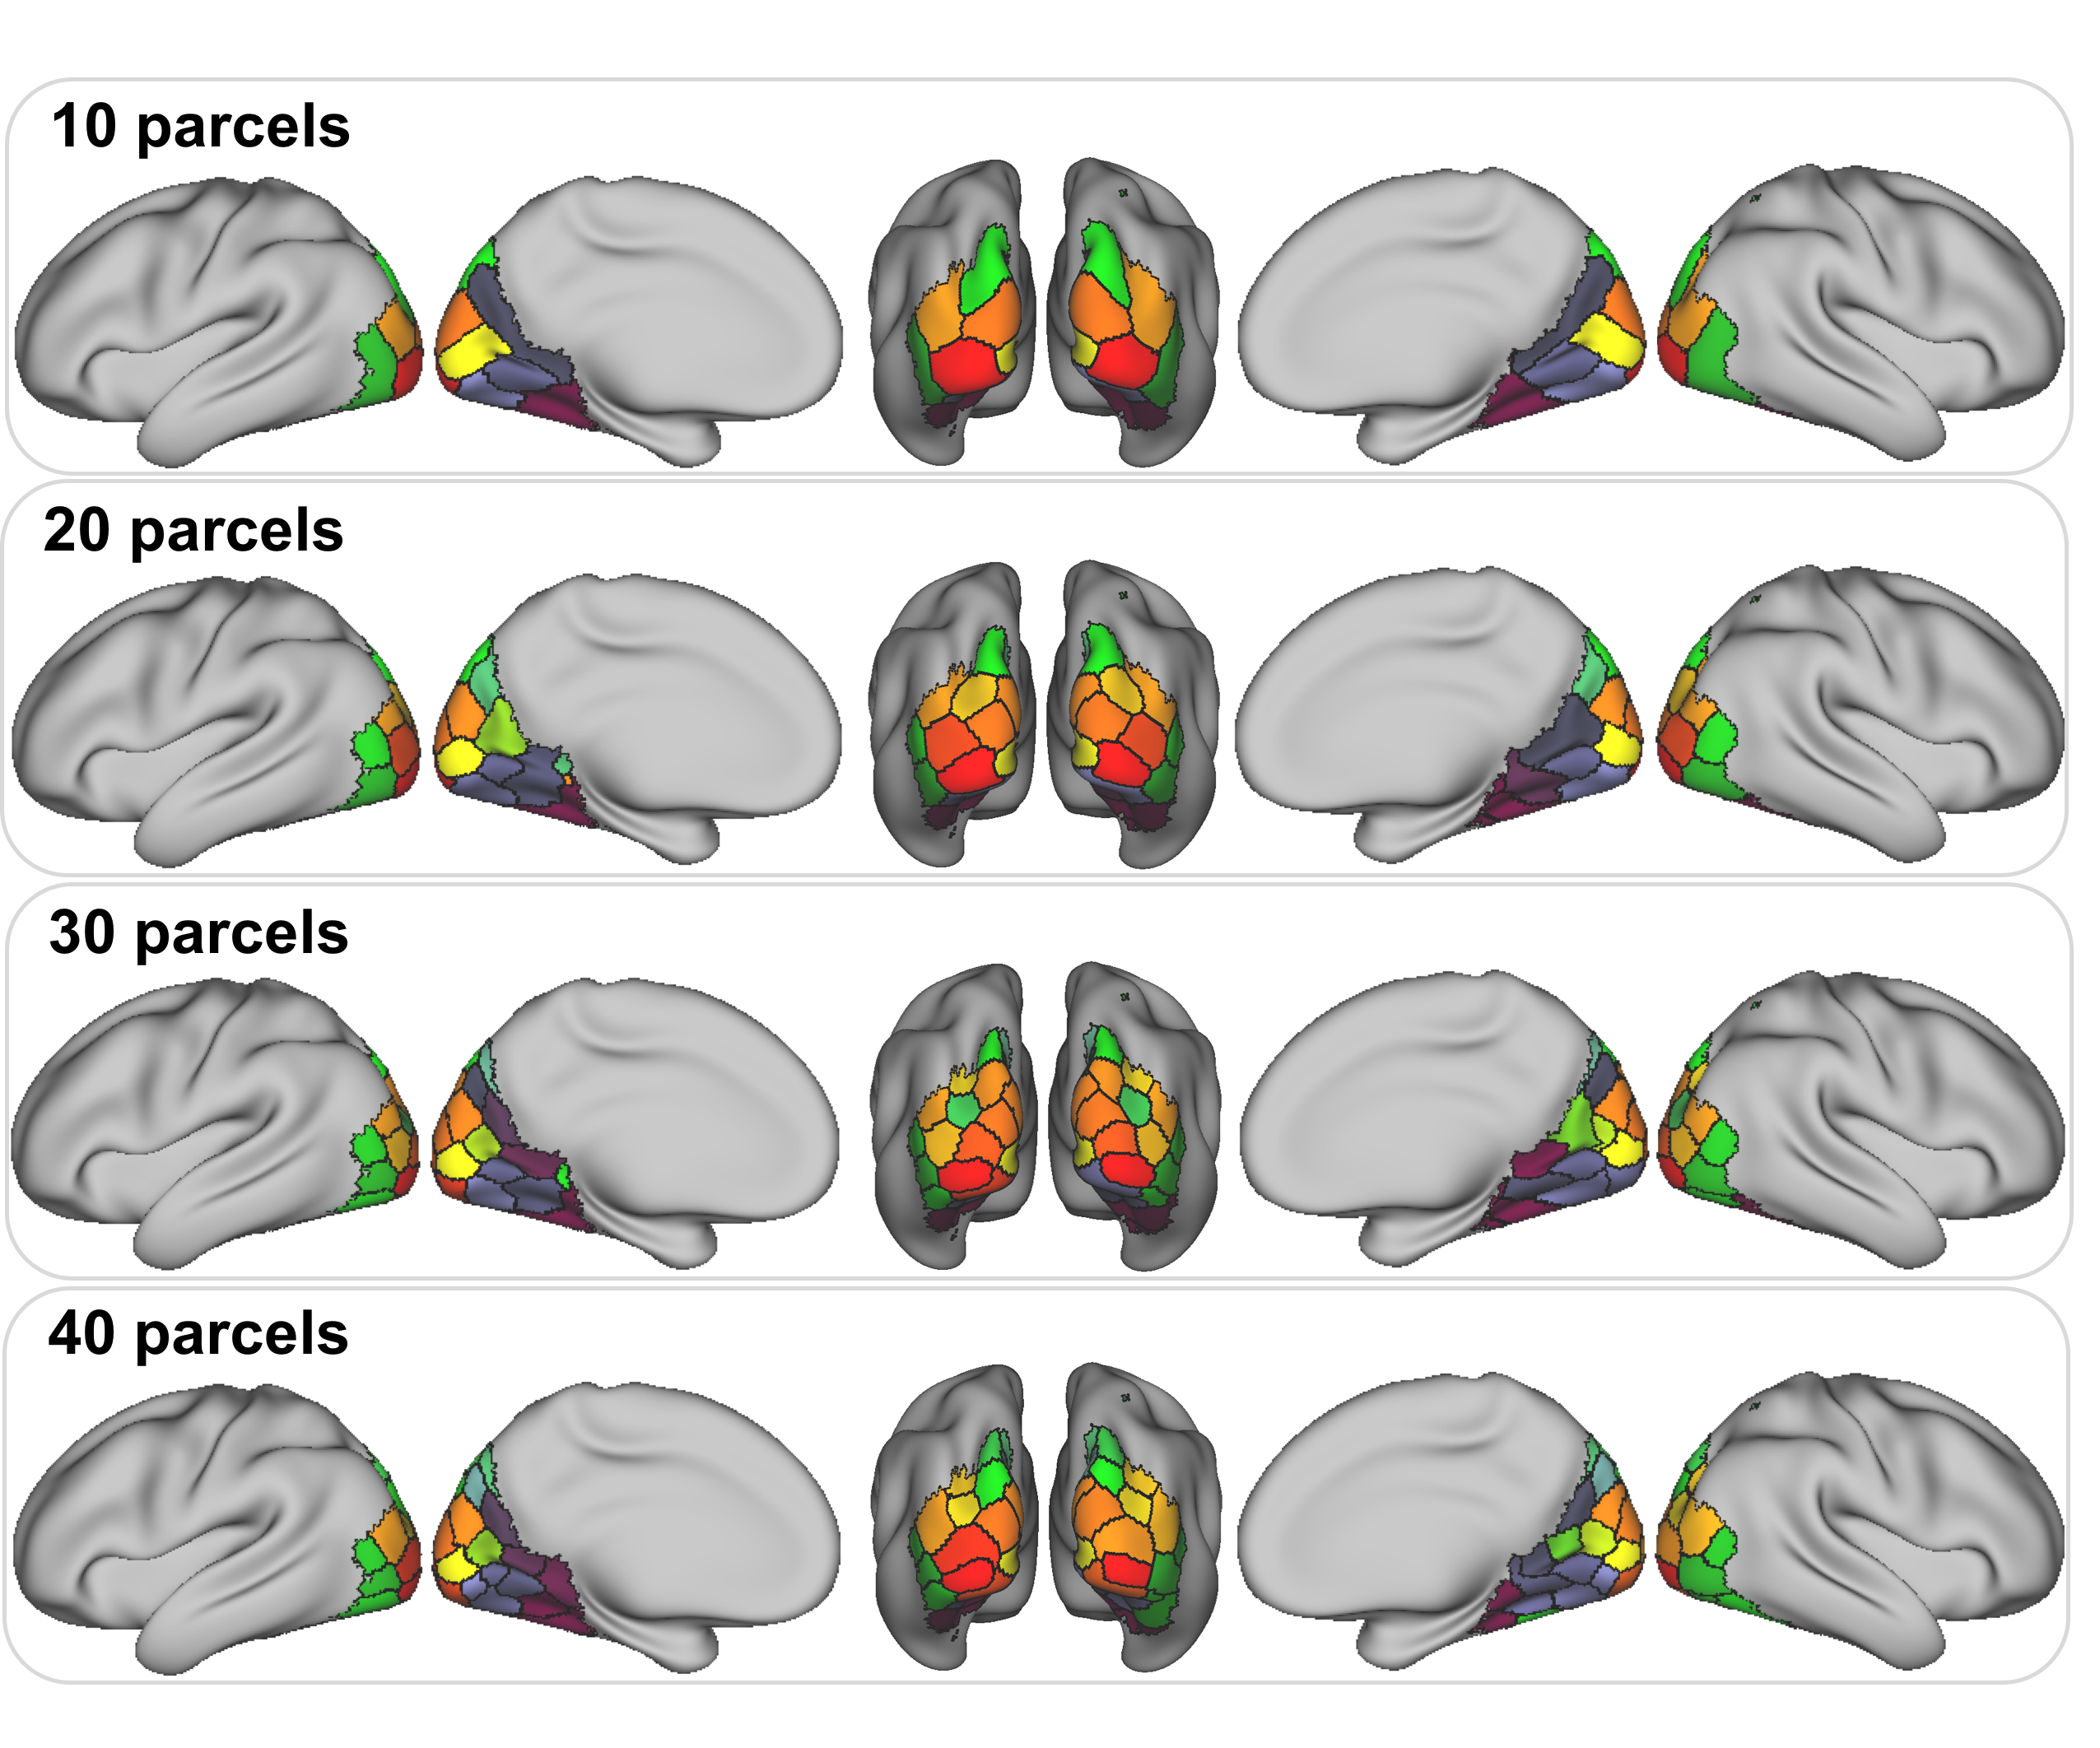
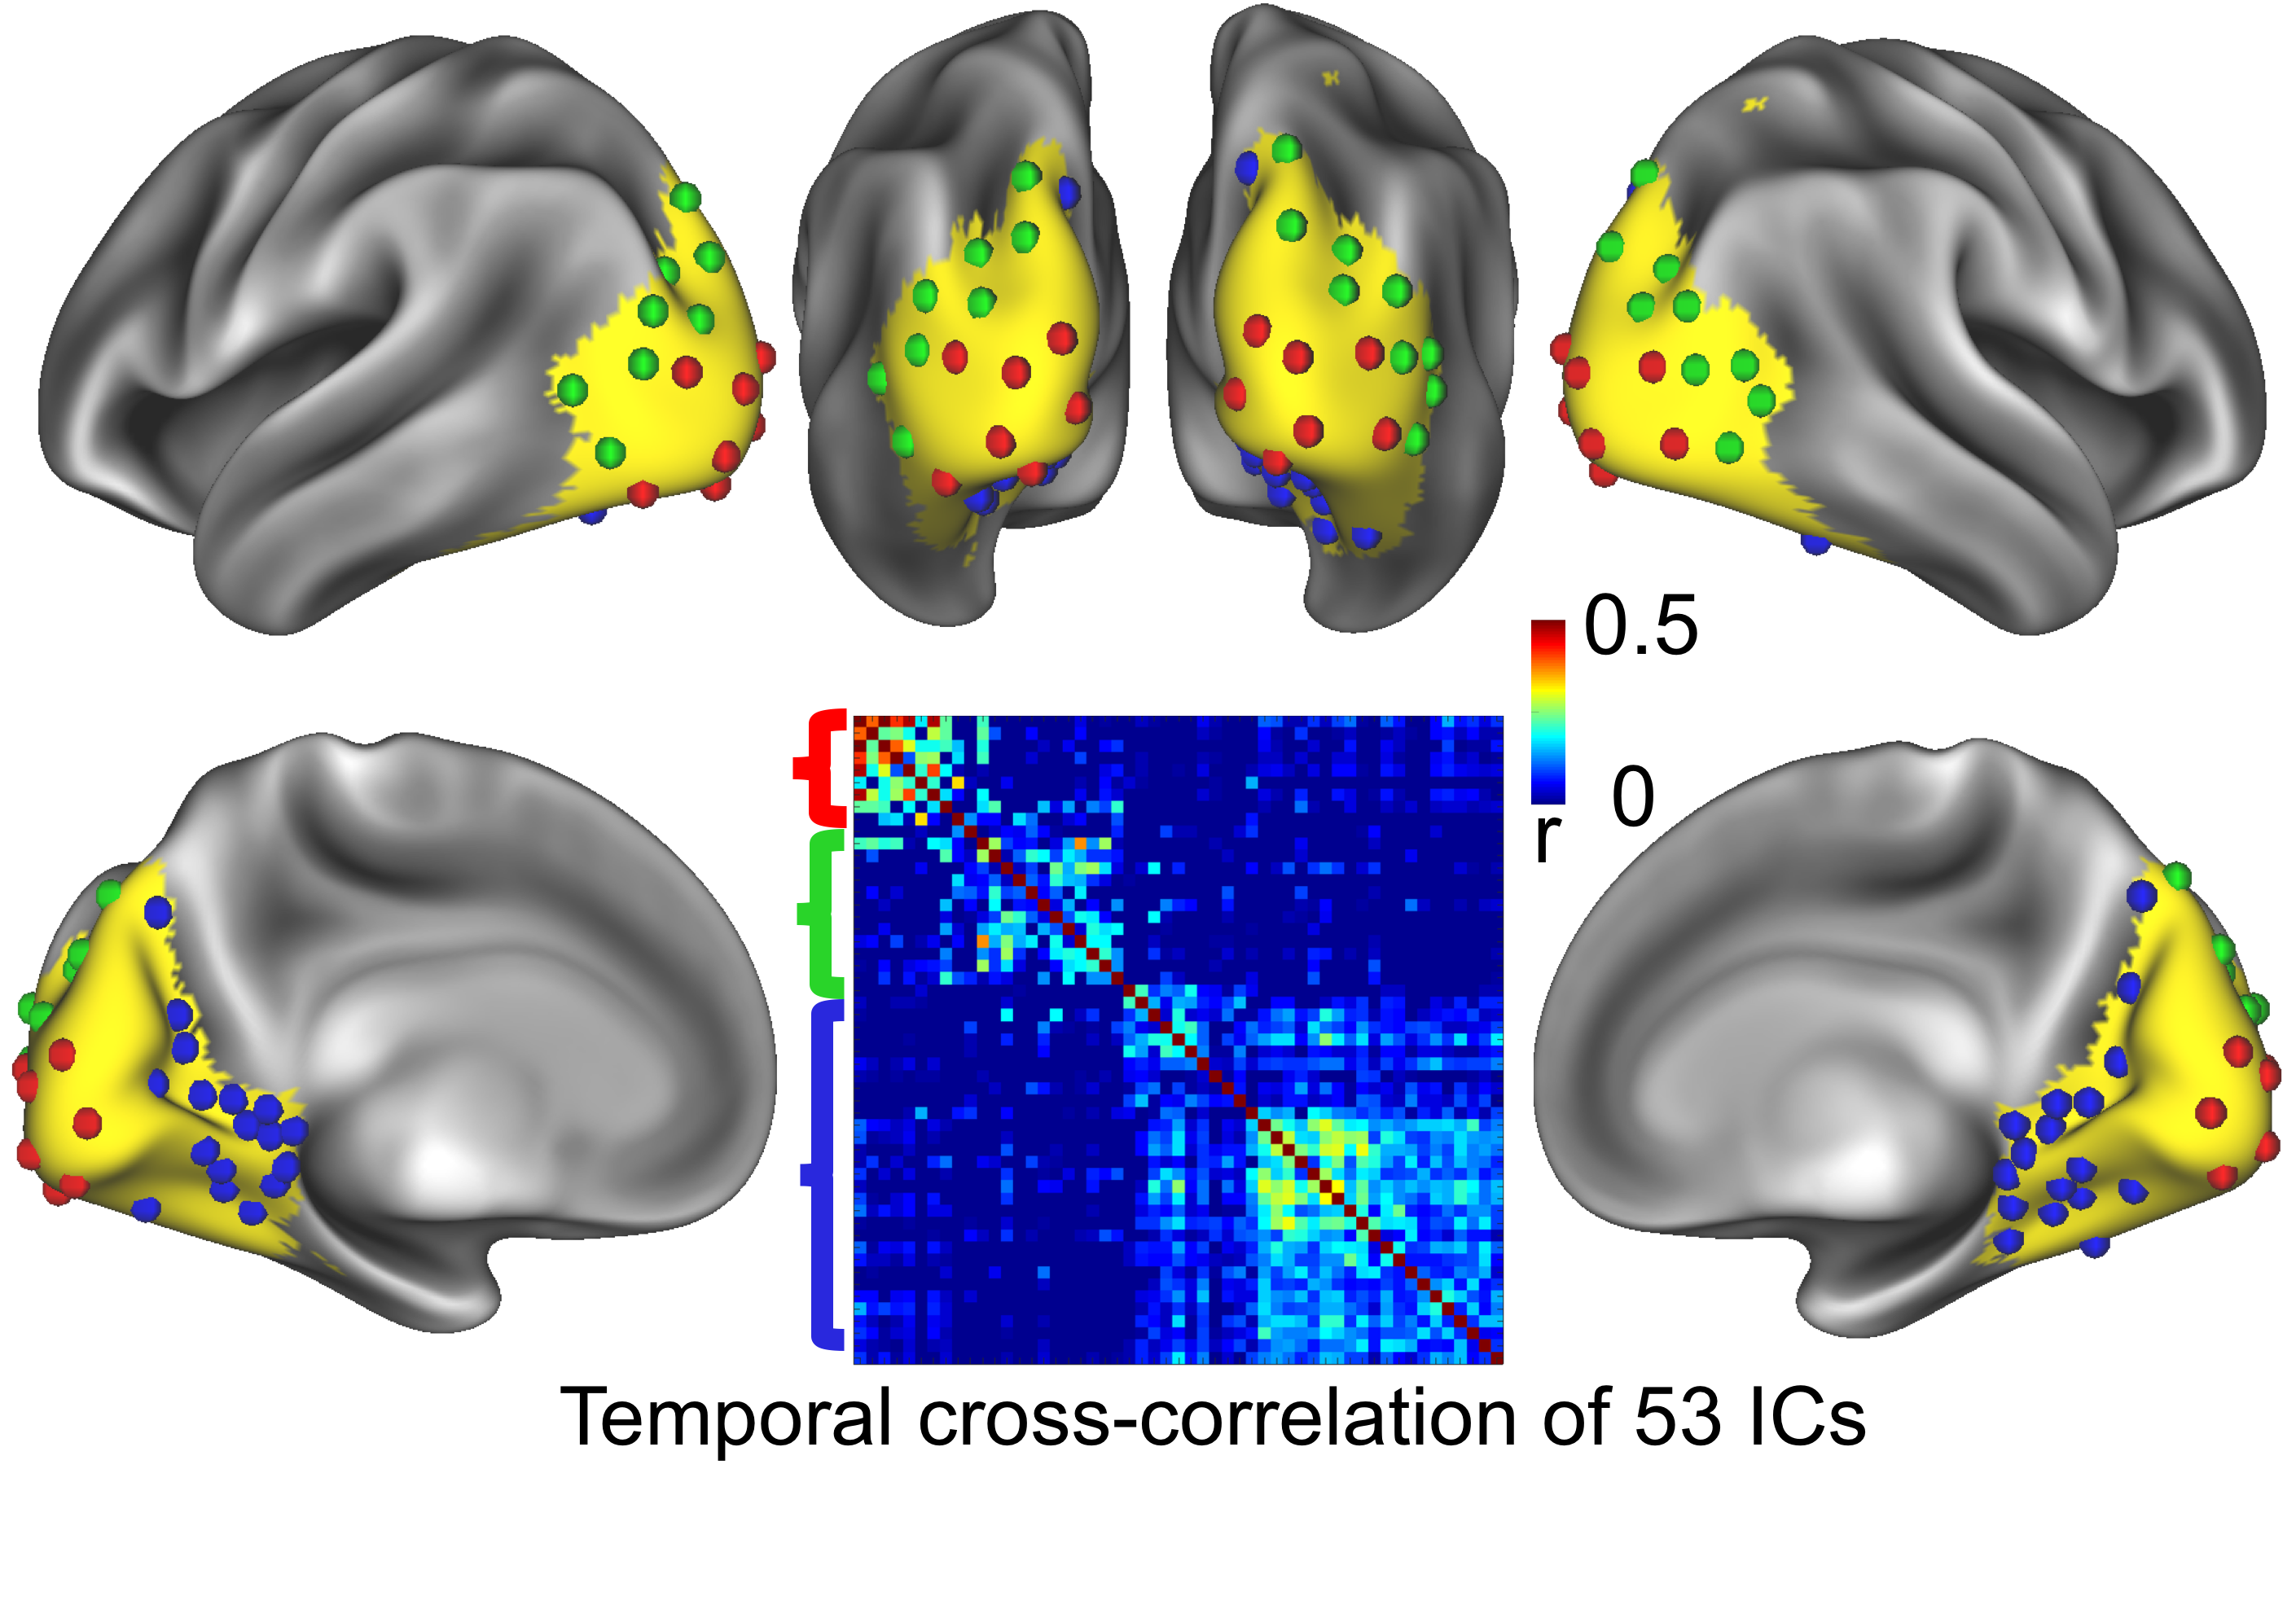
Rs-fMRI data of 201 independent healthy subjects were randomly selected from the Human Connectome Project (HCP). Each session was 14 minutes and 33 seconds with subjects’ eyes open and fixated. We used the data from two resting state sessions (session 1 for test and session 2 for retest). The rs-fMRI data we used were acquired with nominally 2mm isotropic spatial resolution and 0.72s temporal resolution. We applied the ICA to the rs-fMRI signals within a mask of the visual cortex (Fig.1), defined by a coarse functional parcellation of the human cortex5. The fMRI time series within the mask was temporally standardized and concatenated across subjects. Infomax ICA was used to decompose the concatenated rs-fMRI data into 59 spatially independent components (ICs) within the visual cortex. Next, we applied the k-means clustering to the ICA weighting vectors at individual locations within the visual cortex, yielding an automated intrinsic parcellation of the visual cortex with a varying level of granularity with the number of clusters (k) being 10, 20, 30, or 40. In addition, we assessed the functional modularity of individual components based on their pairwise temporal correlations, such that the temporal correlations were higher within modules but lower between modules. Then, we represented each component by a sphere located at the peak location of the component map, and color-coded the sphere according to which module it belonged to.Results
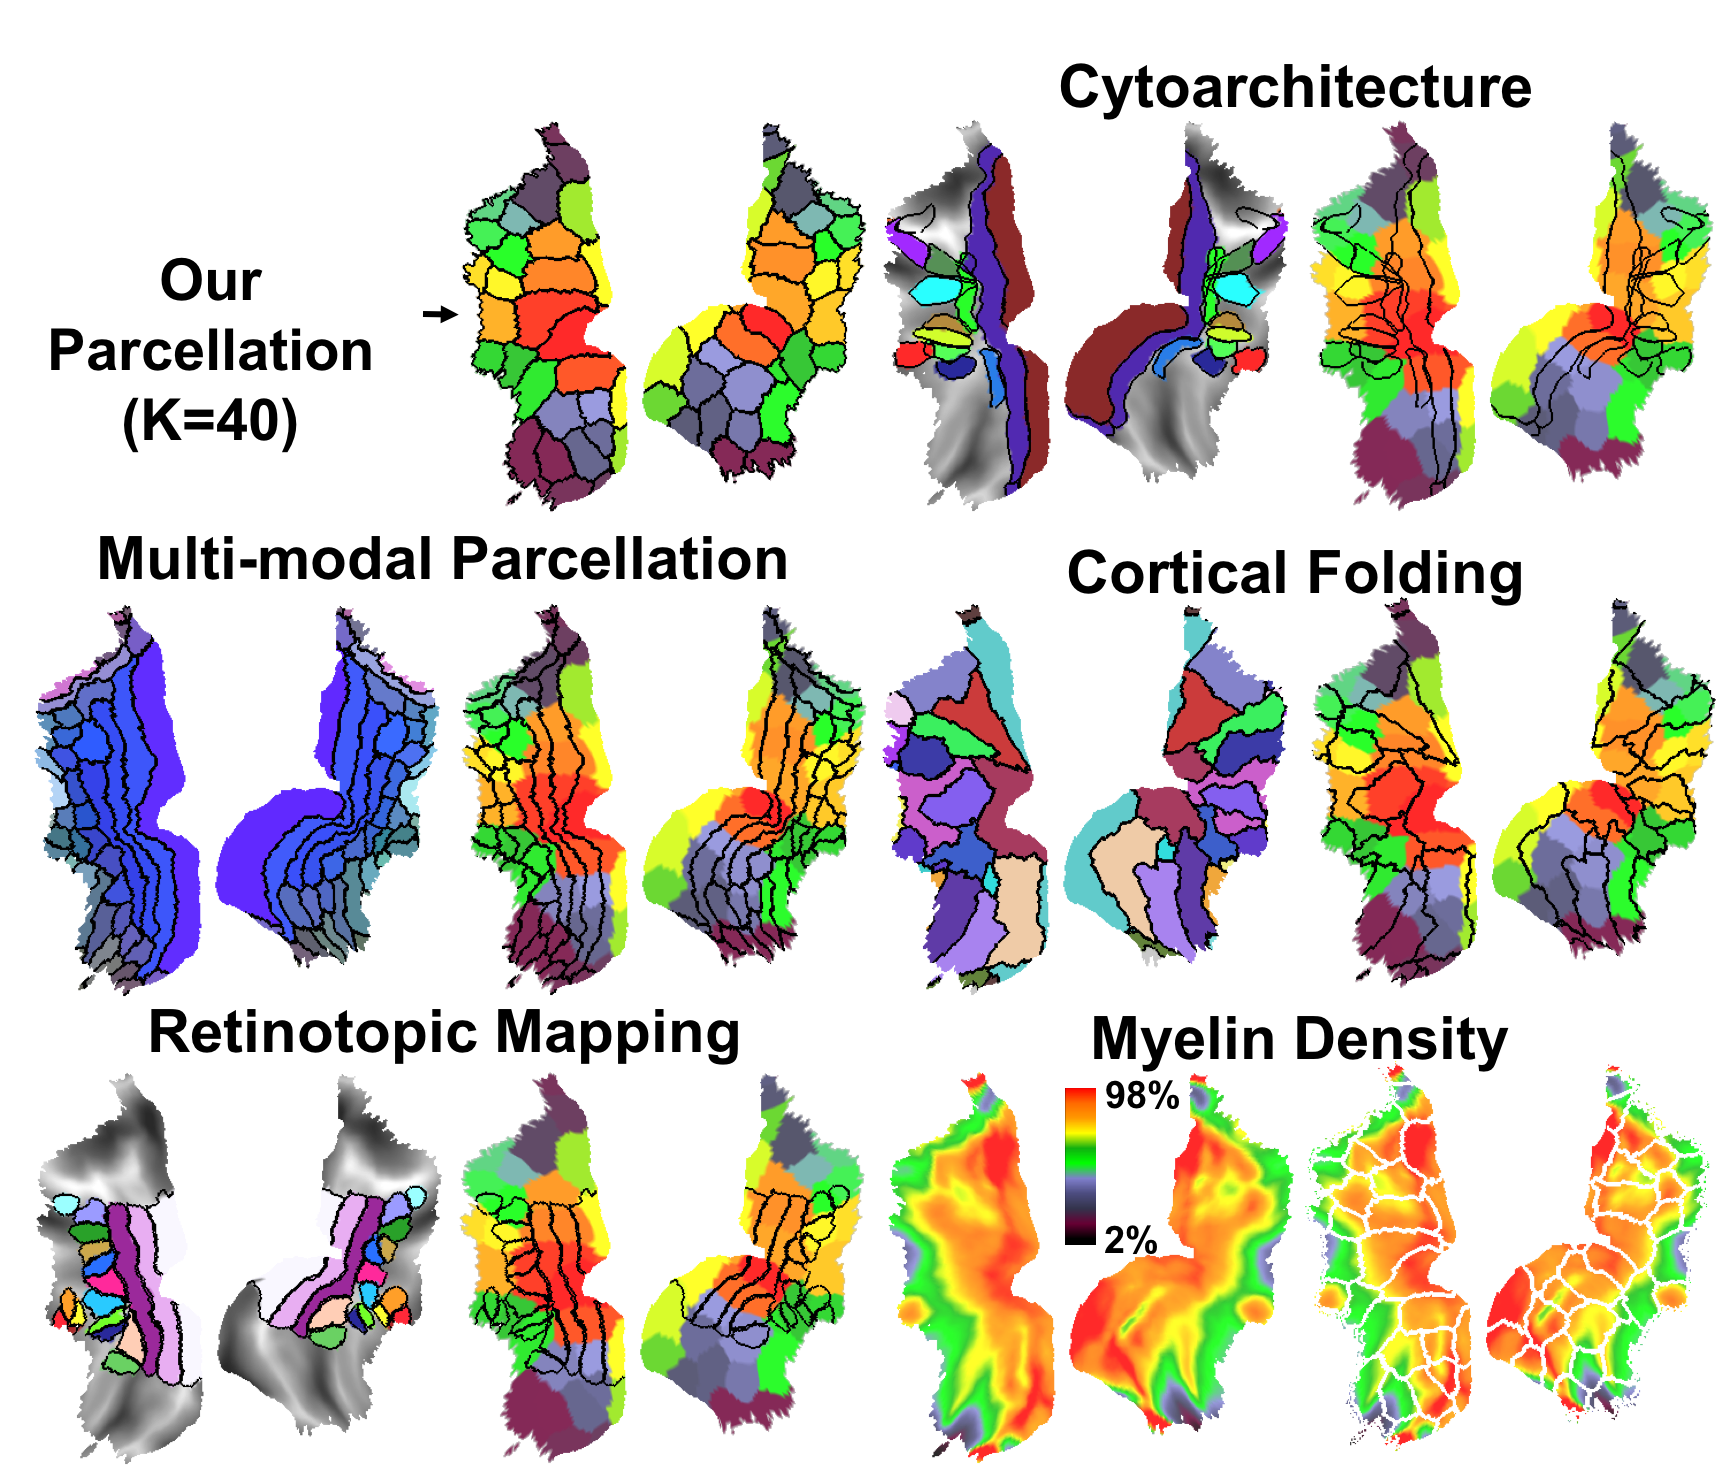
We found spatial patterns of a total number of 50 reproducible components (Fig.1) according to test-retest reproducibility. Among these ICs, 92% showed focal patterns, whereas 8% were distributed; 36% showed bilateral distributions, whereas 64% were unilateral. By clustering these ICs, we found that as the number of clusters increased, coarser parcels were progressively subdivided into finer parcels. At k=40, which roughly matched the expected number of visual areas4, a set of well-defined and bilaterally symmetric parcels were generated (Fig.2). This parcellation based on spontaneous activity was further compared against existing parcellations of the visual cortex (Fig.3). Among all 59 ICs, 53 discrete components were grouped into three functional modules based on their temporal correlations between every pair of components. These modules appeared to be anatomically segregated: the first module included components in the early visual areas (V1/V2/V3), the second module included components along the dorsal pathway, and the third module covered the ventral pathway (Fig.4).Discussions
Spontaneous brain activity at rest exhibits reliable network patterns not only in the whole-brain scale, but also in much finer scales. In addition, these networks provide an information basis to divide the visual cortex into small parcels, showing notable differences compared to the classical visual regions defined with retinotopic mapping or cytoarchitecture. Importantly, the results lend support to the notion that intrinsic networks within the visual cortex are organized into three segregated functional modules: the dorsal pathway, the ventral pathway, and the early visual areas shared by these two pathways. Therefore, we conclude that spontaneous activity in an intermediate scale confined to the visual system is not organized by cortical retinotopy, but by anatomically segregated and functionally specialized pathways for visual feature extractions, object recognition, and action guidance.Acknowledgements
This project was supported by National Institutes of Health (NIH) grant 1R01MH104402.References
1. Destrieux, C., Fischl, B., et al. Automatic parcellation of human cortical gyri and sulci using standard anatomical nomenclature. NeuroImage. 2010;53(1), 1–15.
2. Abdollahi, R. O., Kolster, H., et al. Correspondences between retinotopic areas and myelin maps in human visual cortex. NeuroImage. 2014;99, 509–524.
3. Van Essen, D. C., Glasser, M. F., et al. Parcellations and hemispheric asymmetries of human cerebral cortex analyzed on surface-based atlases. Cerebral Cortex. 2012;22(10), 2241–2262.
4. Glasser, M. F., Coalson, T. S., et al. A multi-modal parcellation of human cerebral cortex. Nature. 2016;536(7615), 171–8.
5. Yeo, B. T. T., Krienen, F. M., et al. The organization of the human cerebral cortex estimated by intrinsic functional connectivity. Journal of Neurophysiology. 2011;106, 1125–1165.
Figures