0956
Dynamic parcellation of cortical functional networks in developing preterm brains1Department of Radiology, Children's Hospital of Philadelphia, Philadelphia, PA, United States, 2Department of Radiology, Perelman School of Medicine, University of Pennsylvania, Philadelphia, PA, United States, 3School of Software, Dalian University of Technology, People's Republic of China, 4Biomedical Engineering, Tsinghua University, People's Republic of China
Synopsis
Connectivity is a major organizing principle of the central nervous system. However, little is known on how the cortical functional connectivity emerges in the network organization in the preterm brain. Here, we aimed to demonstrate
Purpose:
Connectivity is a major organizing principle of the central nervous system. It plays a key role in brain functions [1]. However, little is known on how the cortical functional connectivity emerges in the network organization in the developing preterm brain. In this study, we aimed to demonstrate emergence of primary functional regions using a parcellation method based on measurements from resting-state fMRI (rs-fMRI). Specifically, we utilized the continuous max-flow algorithm [2-3] to cluster the functional connectivity measures of the preterm human brain from 32 to 40 postmenstrual weeks (PMW). The results revealed the dynamic emergence pattern of primary sensorimotor and visual regions during preterm development. To validate the preterm brain clustering results, the cortical parcellation based on functional connectivity of 1000 adult brains [4] was transferred to the custom-made preterm brain template as a reference.Methods:
Subjects and data acquisition: 52 normal preterm and term neonates were recruited (aged from 31.3 to 41.7 PMW). The data were acquired on a Philips 3T Achieva MR scanner. The preterm neonates were scanned during their natural sleep without sedation. For rs-fMRI, a total of 210 whole brain EPI volumes were acquired using the following parameters: TR = 1500 ms, TE = 27 ms, in-plane imaging resolution = 2.4 ×2.4 mm2, in-plane field of view (FOV) =168 × 168 mm2, slice thickness = 3 mm with no gap, slice number = 30. Rs-fMRI preprocessing and measurement of functional connectivity strength: The rs-fMRI data of 40 normal preterm and term infants was used after discarding the subjects with head motions exceeding the set threshold. The individual T2-weighted images were then nonlinearly registered to a 37-PMW brain template [5]. A custom-made template was generated through averaging the resultant normalized T2-weighted images of all subjects. Individual T2-weighted images were nonlinearly registered to the custom-made template. Subsequently, we did the spatial smoothing, detrending, temporal filtering, and regression of several nuisance variables. After these preprocessing, the functional connectivity strength (FCS) was calculated as the average of the correlations between one voxel and all other voxels in the brain within gray matter mask. FCS was calculated for each subject at 32, 36 and 40 PMW groups. The average FCS within each group was then computed with the following clustering applied to these average FCS maps. Clustering of FCS on the brain and validation: We used the continuous max-flow algorithm (CMF) [2-3] to cluster the FCS on the brain. With CMF, the brain voxels within gray matter mask were grouped according to its FCS values into different clusters. To validate clustering results of sensorimotor and visual network regions of preterm brains, we transferred the sensorimotor and visual network regions from the parcellation of 7 networks in MNI 152 space (http://www.freesurfer.net/fswiki/CorticalParcellation_Yeo2011) based on rs-fMRI data of 1000 subjects [4] to the preterm brain custom-made template. Dice ratios were calculated to validate the sensorimotor and visual network regions segmented with clustering analysis in preterm brains. Dice ratios were also used for quantifying emergence of these two network regions with the adult brain parcellated regions as the reference.Results:
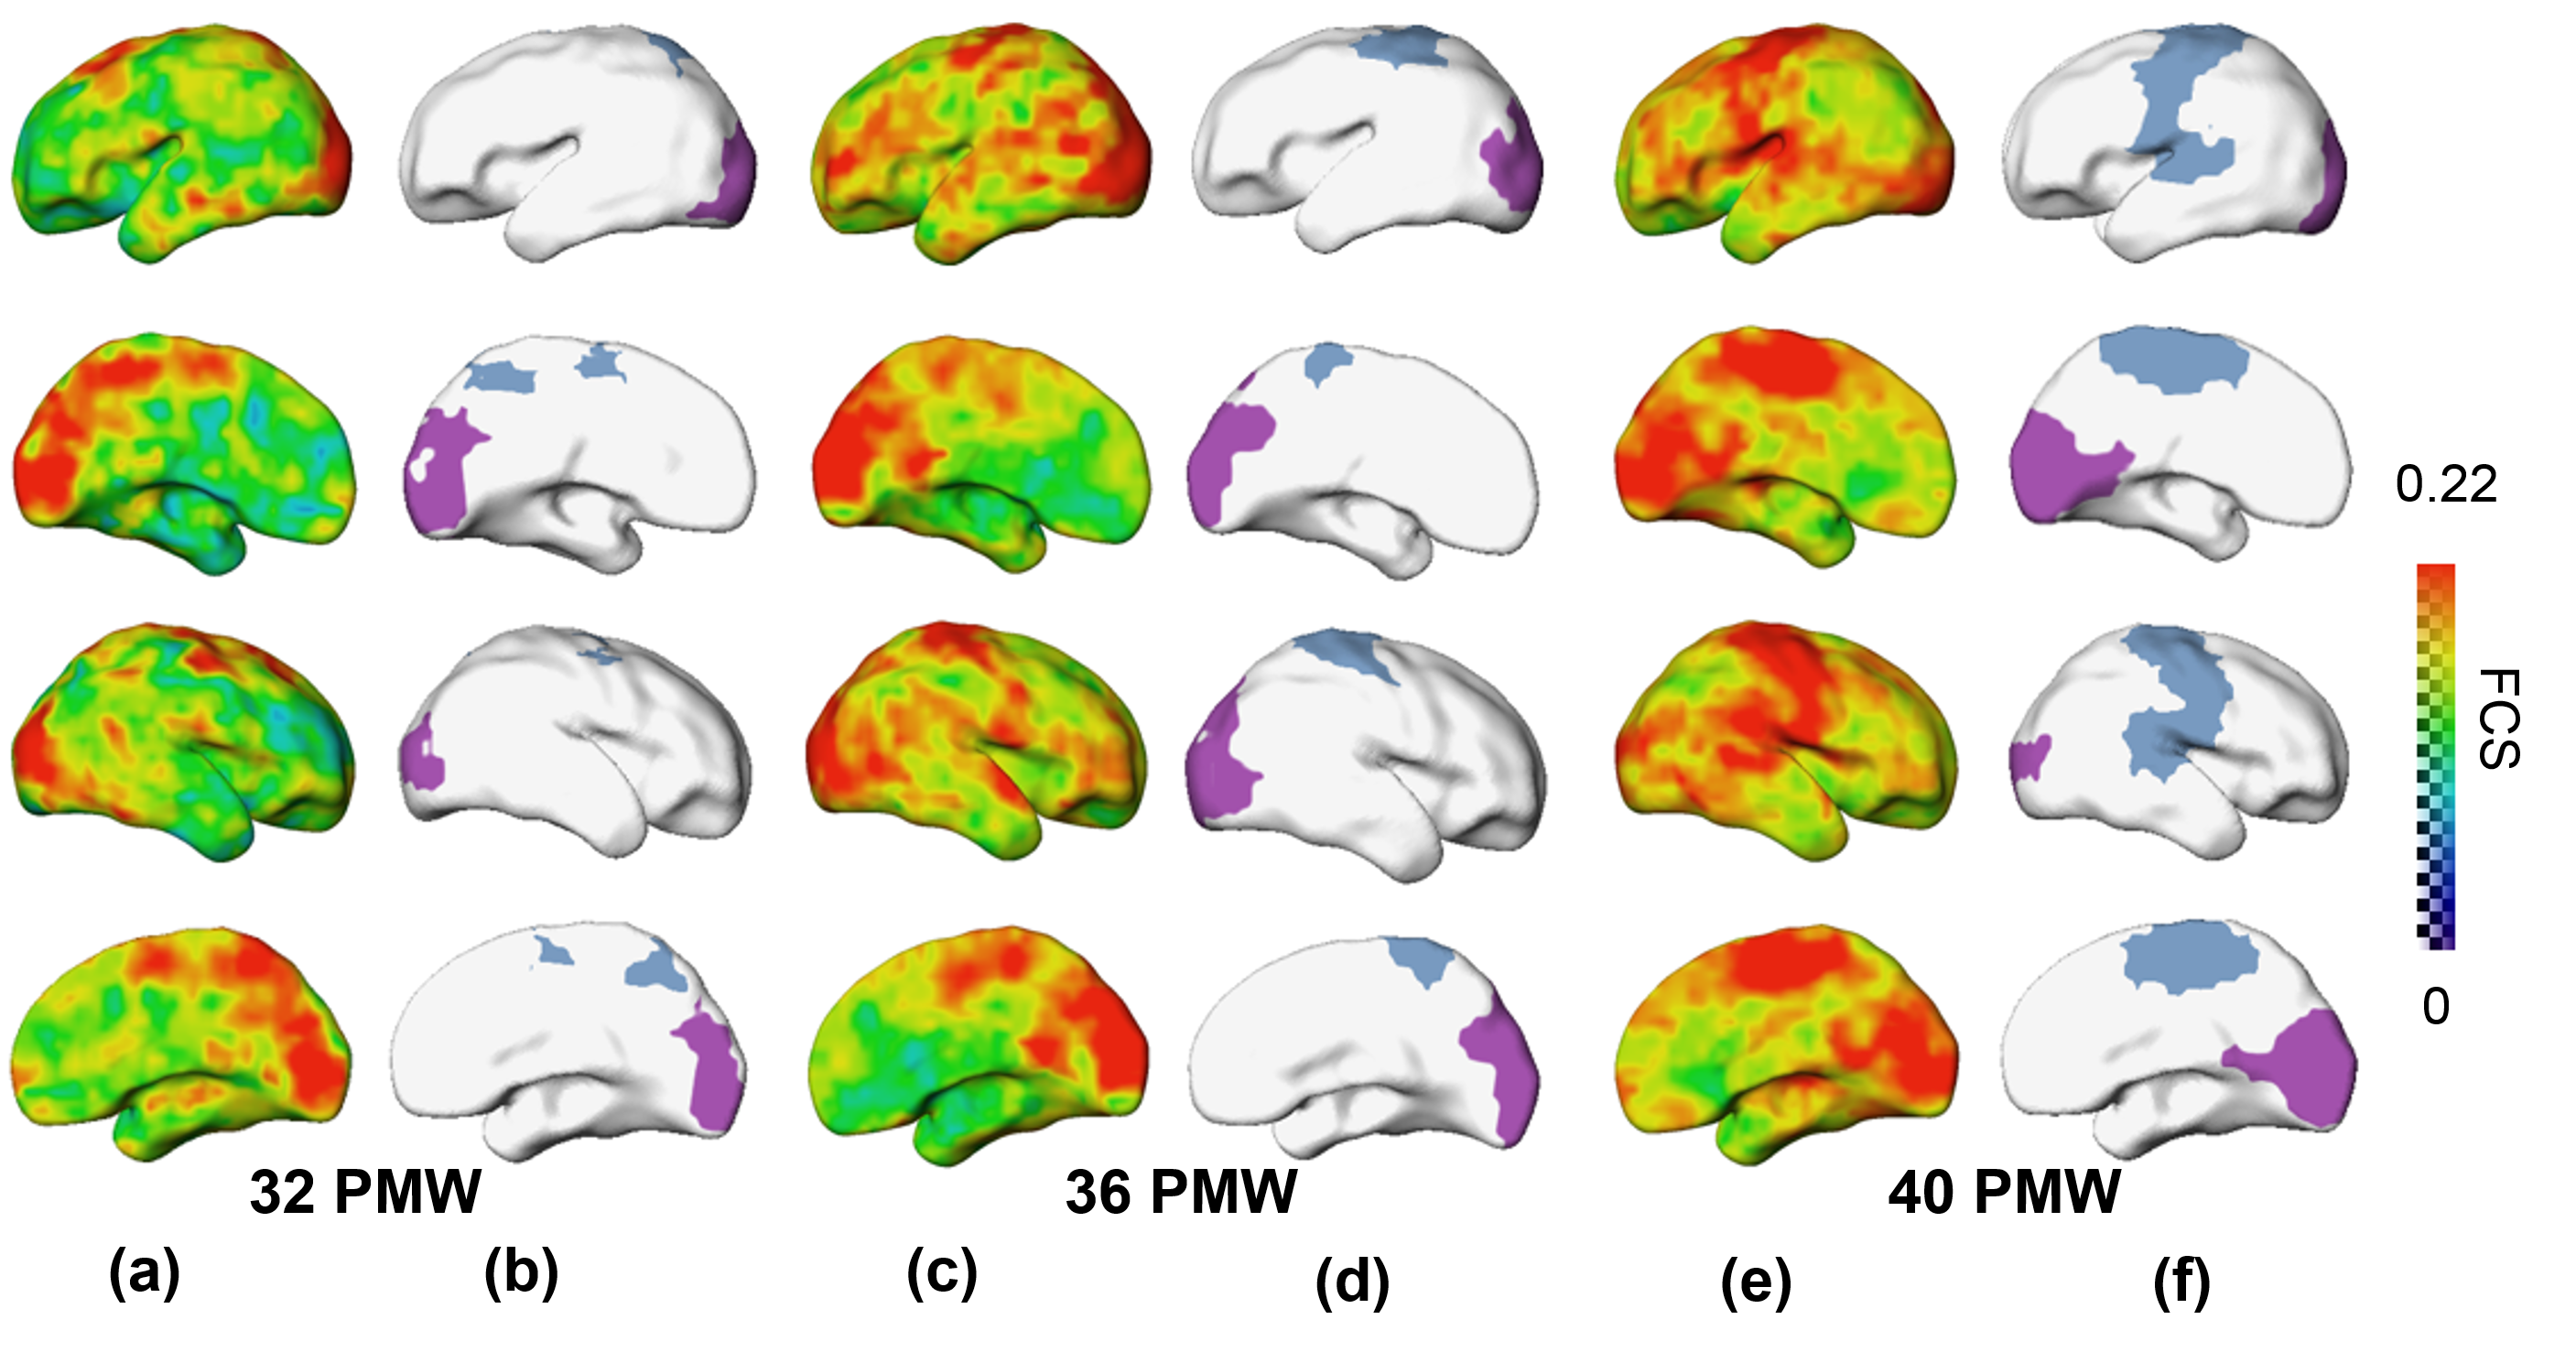
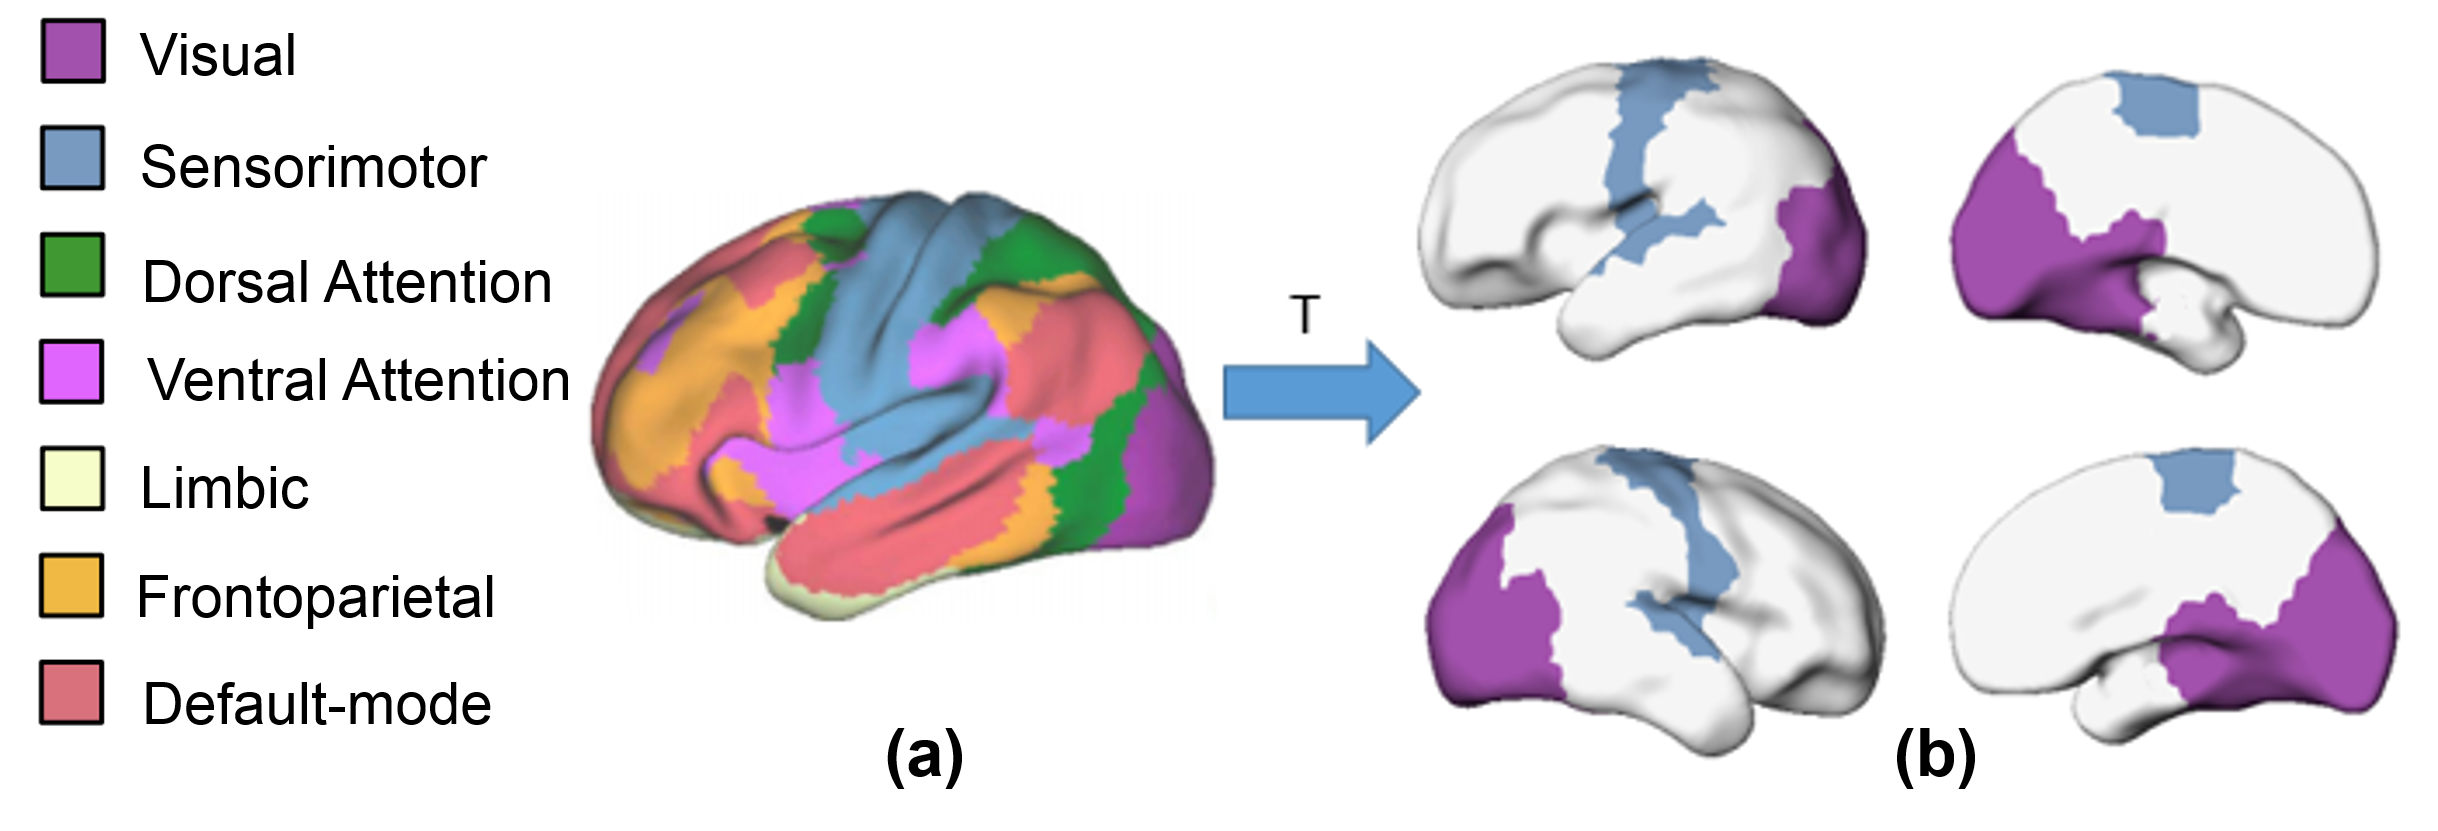
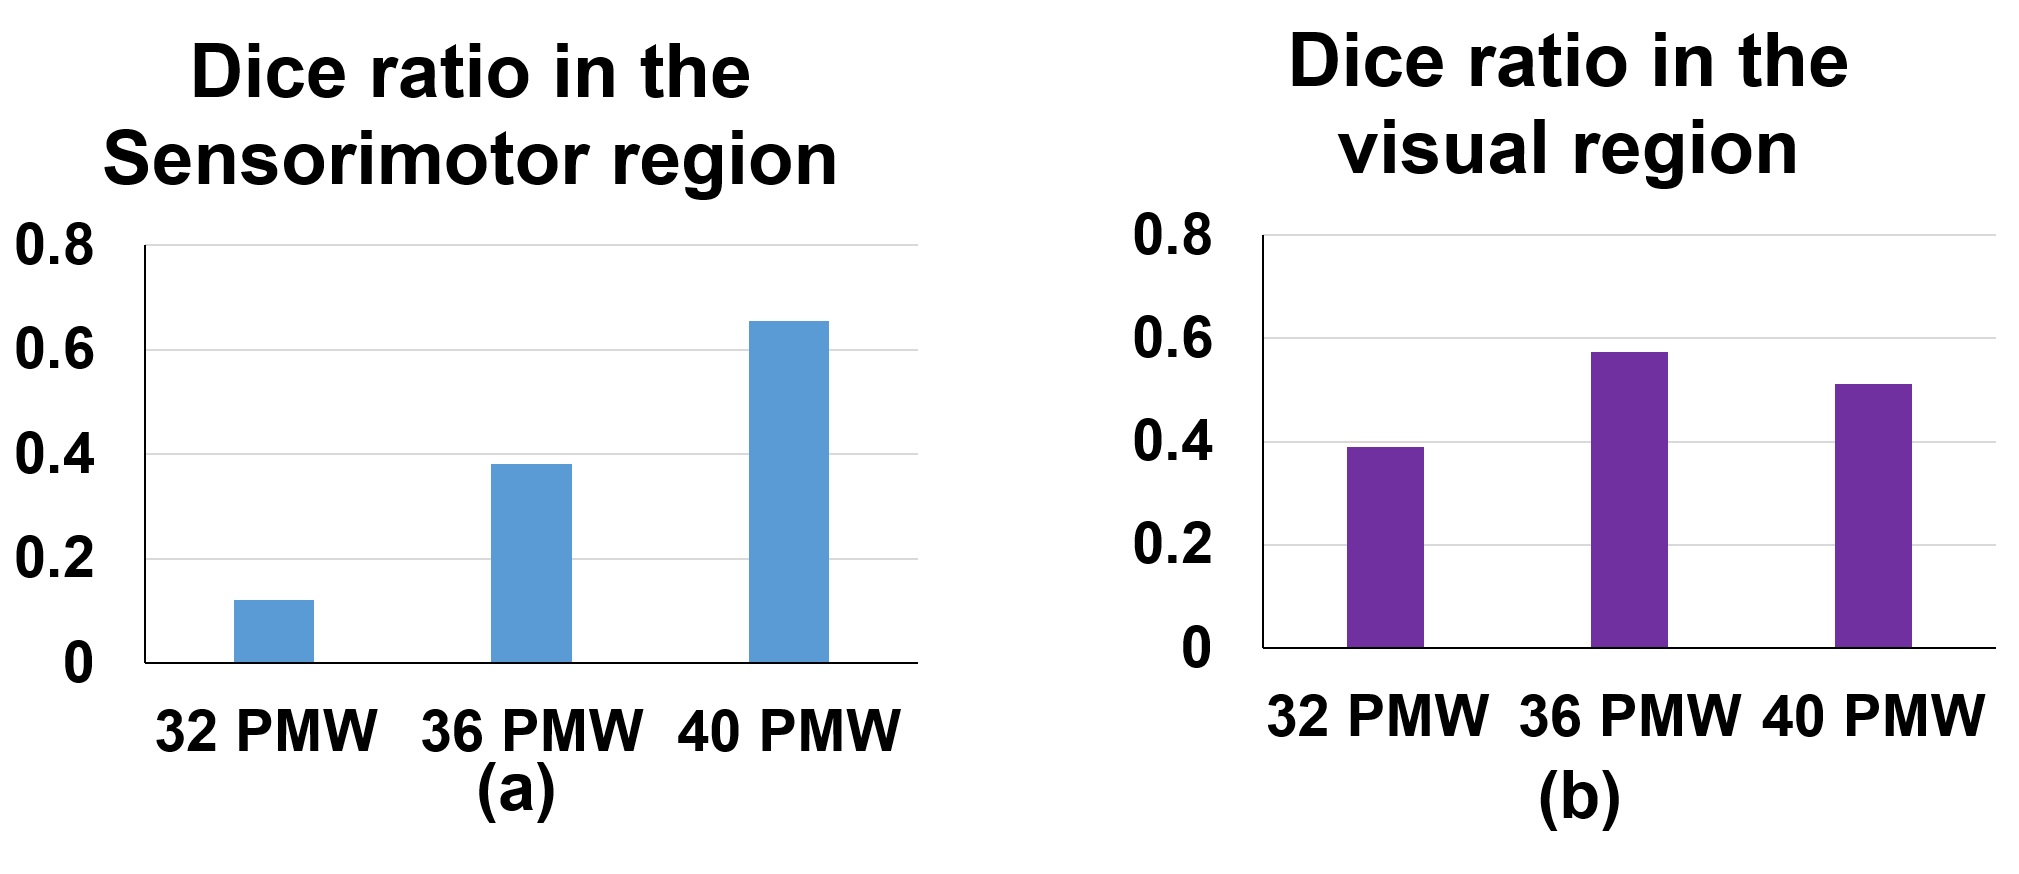
The primary sensorimotor and visual areas can be clearly delineated with the clustering of FCS in the preterm human brain at 32, 36 and 40PMW (Fig. 1). These parcellated regions showed similar pattern to that of corresponding network regions of adult brains (Fig. 2 and Fig. 3). The dynamic parcellation of these two primary network regions in preterm development can be appreciated from Fig. 3. These two emerging network regions gradually match the corresponding network regions in the adult brain, as demonstrated by the increased Dice ratios in Fig 4.Conclusions:
The emergence of the sensorimotor and visual network regions was detected automatically and effectively using a data-driven method based on measurements of FCS. The dynamic cortical parcellation in preterm brains has been revealed by applying clustering algorithm to the functional connectivity measures from rs-fMRI. The delineated network regions were also validated by the corresponding network regions transferred from adult brains. With preterm development, both primary sensorimotor and visual regions gradually match the corresponding regions in the adult brain. Application of clustering algorithm to functional connectivity measures can be potentially used for quantitatively delineating developmental pattern of all major functional network regions, including higher-order functional network regions, from birth to adulthood.Acknowledgements
This study is funded by NIH MH092535, MH092535-S1 and HD086984.References
[1] Biswal BB, et al. Toward discovery science of human brain function. Proceedings of the National Academy of Sciences, 2010; 107(10): 4734-4739.
[2] Greig, DM, et al. Exact maximum a posteriori estimation for binary images. Journal of the Royal Statistical Society. Series B (Methodological), 1989, 271-279.
[3] Yuan J, et al. A continuous max-flow approach to potts model. European Conference on Computer Vision, 2010, 379-392.
[4] Yeo BT, et al. The organization of the human cerebral cortex estimated by intrinsic functional connectivity. Journal of neurophysiology, 2011; 106(3): 1125-1165.
[5] Serag A, et al. Construction of a consistent high-definition spatio-temporal atlas of the developing brain using adaptive kernel regression. Neuroimage, 2012; 59(3): 2255-2265.
Figures