0955
Selection of node-based graph metrics to predict symptom severity in mild traumatic brain injury (mTBI) using recursive feature elimination1GE Global Research, Bangalore, Karnataka, India, Bangalore, India, 2GE Global Research, Niskayuna, NY, 3Hospital for Special Surgery, New York City, NY, 4University of California, San Francisco, CA, 5Houston Methodist, Houston, TX
Synopsis
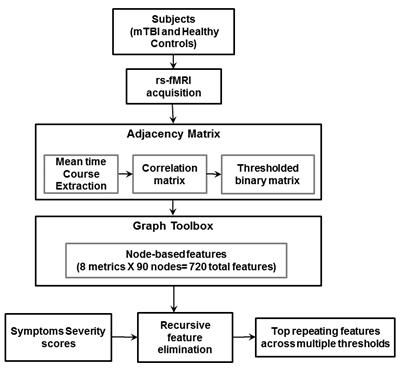
Recursive feature elimination (RFE), a machine learning technique, is used to sub-select node-based graph theoretical features that correlate with symptom severity in mTBI. Resting state functional connectivity was represented as a binary graph by thresholding correlation values computed between time courses of functional ROIs. Node-based graph theoretical metrics were computed and fed to the feature elimination model to regress on mTBI symptom scores. Using RFE we identified top features correlated to symptom severity in mTBI, which include eigen centrality and closeness of nodes within the salience and default-mode networks. Top features were analyzed for repeatability over multiple runs and multiple thresholds.
Introduction
Graphs have proved to be a meaningful tool to represent brain connectivity1. Many graph metrics2 have been shown to be associated with changes in brain connectivity in disease3, as there is a general understanding that many neurological diseases result in the breakdown of brain networks. However, few studies have compared the performance of multiple metrics in a single disease. In this study, eight widely-used node-based graph metrics derived from resting state functional MRI (rs-fMRI) were evaluated using a RFE model to predict the symptom severity scores (SSS) in mTBI. Here, the goal was to evaluate node-based graph metrics to (i) discover critical functional nodes affected in mTBI and (ii) assess the sensitivity of node-based metrics associated with SSS.Methods
fMRI data preprocessing: After obtaining informed consent, rs-fMRI was recorded from 115 patients at four time points (3 days, 7 days, 3 weeks and 3 months) post-mTBI and 31 healthy controls (2 sessions, 1 week apart). After eliminating missing and noisy data, we analyzed 228 time points in total. Using GE 3T MRI scanner, multi-band (acceleration factor 3) 2D-EPI, TR/TE = 900/30ms was acquired for 6 minutes (395 volumes), with 1.875mm2 isotropic in-plane resolution and 3mm slice thickness to cover the whole brain. T1-weighted scans (1mm resolution) were acquired at each time point. All participants completed a neuropsychological self-assessment questionnaire that was used to calculate SSS. rs-fMRI data were motion corrected, rigid registered to T1-weighted image, non-rigid registered to MNI atlas, nuisance removed using aCompCor4, spatial smoothed using Gaussian filter (FWHM 4mm) and temporally band-pass filtered (0.01-0.1 Hz) using custom-built software. Mean time courses of 90 functional ROIs5 were extracted. Correlation coefficients were computed between every pair of time courses, producing a 90x90 matrix. Functional connectivity matrices were binarized using a threshold corresponding to multiple percentile values of edge weights (10-25th percentile in steps of 5).
Graph metrics: Eight node-based metrics were computed from the binarized functional connectivity matrices6: (1) Degree: Number of connections (2) Betweenness: Number of shortest paths through the node (3) Closeness: Average distance to other nodes (4) Shapley value: Relative importance of node in its neighborhood given by $$$\sum^m\frac{1}{degree(m)}$$$, where in m ε neighborhood of the node (5) Eigen Centrality: Computed from eigen vectors of laplacian of the graph (6) Communicability: Number of closed walks starting and ending at the node (7) Core-number: Minimum degree of the maximal subgraph that contains the node (8) Clustering Coefficient: Number of closed triangles incident on the node/total number of possible triangles.
RFE for feature selection: A total of 720 node-based graph features, extracted from 90 nodes and eight graph metrics, were inputs to the RFE model (Fig. 1)7. Node purity, which relates to loss function of the RF, was used to rank feature importance. The experiment was run for multiple iterations in a cross-validation approach, and for multiple thresholds.
Results
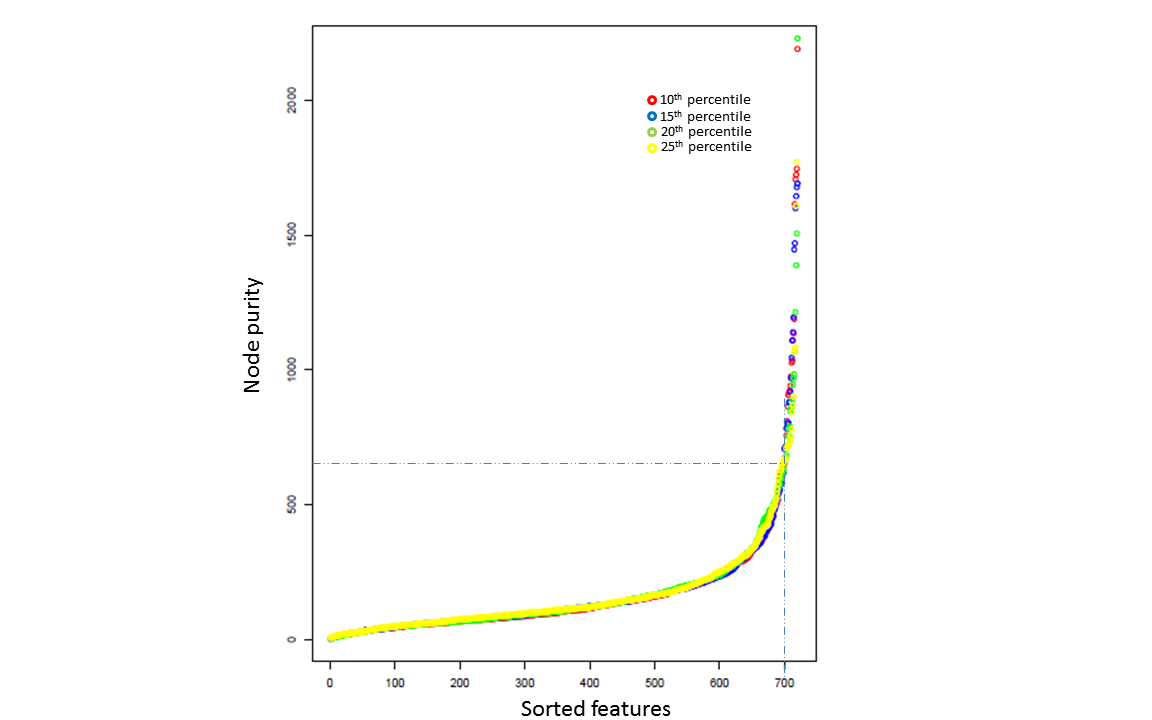
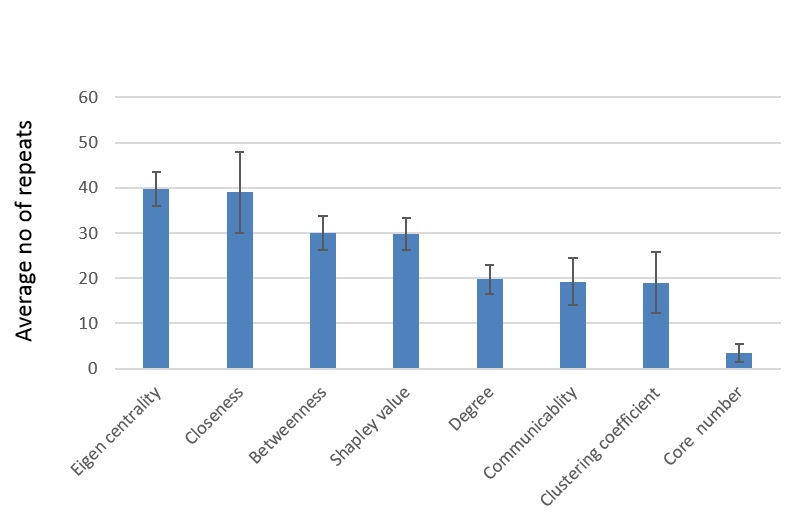
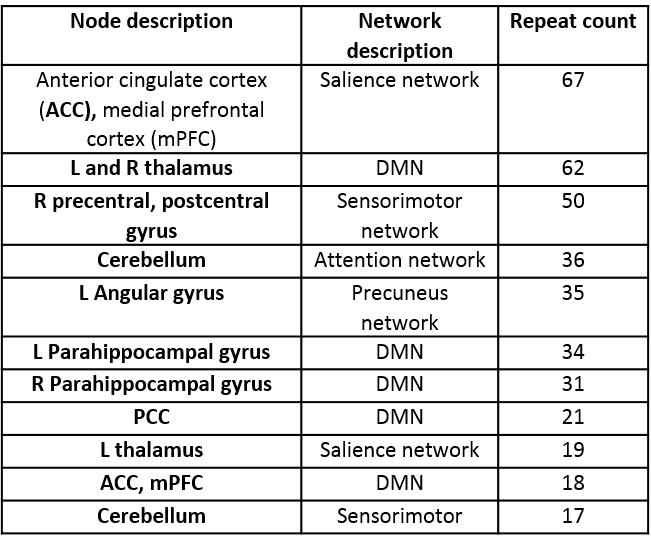
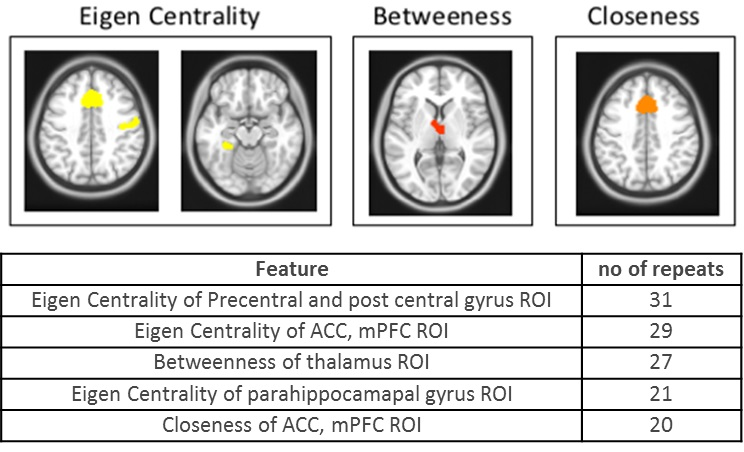
Using all 720 features to fit a model to predict SSS (range 0 – 132) yielded root mean squared error (RMSE) of ~23. Then, each of the 720 features were fit individually to SSS and the features were sorted by node purity (Fig. 2). RMSE for the single best feature was ~27. There was a sharp drop in increased node purity at ~20 features (Fig. 2). The model was run 10 times and the top 20 features were chosen at each iteration to test for reliability. Using the top 20 features, we achieved a best performance of ~23 CV RMSE for predicting SSS, which was equivalent to using all the 720 features. The procedure was repeated for multiple thresholds of edge weights to remove any bias resulting from the choice of threshold. The most repeated features included eigen centrality, closeness, betweeness, and shapley value (Fig. 3). The ROIs contributing to the top 20 features selected by the RFE were regions in the default-mode network (DMN) and Salience networks including the ACC, mPFC and thalamus (Fig. 4,5).Conclusion
In this study, we used RFE to narrow down graph-based functional features that correlate with symptom severity in mTBI. We find that features reflecting shortest-paths (betweeness and closeness) and importance of neighboring nodes (eigen centrality and shapley value) in the DMN, salience and sensorimotor networks were modulated in mTBI. We suggest these node-based graph features could be potential biomarkers, and can be used for predicting symptom scores in mTBI. Further, given the multitude of graph-based features in the literature, this method can be used to choose graph metrics based on their sensitivity to disease severity for diagnosis and prognosis.Acknowledgements
No acknowledgement found.References
[1] Bullmore, Ed, and Olaf Sporns. "Complex brain networks: graph theoretical analysis of structural and functional systems." Nature Reviews Neuroscience 10.3 (2009): 186-198.
[2] Hernández, Javier Martin, and Piet Van Mieghem. "Classification of graph metrics." Delft University of Technology, Tech. Rep (2011).
[3] Stam, Cornelis J. "Modern network science of neurological disorders." Nature Reviews Neuroscience 15.10 (2014): 683-695.
[4]. Y. Behzadi, K. Restom, J. Liau, and T. T. Liu, "A component based noise correction method (CompCor) for BOLD and perfusion based fMRI," Neuroimage, vol. 37, pp. 90-101, Aug 1 2007.
[5] W. R. Shirer, S. Ryali, E. Rykhlevskaia, V. Menon, and M. D. Greicius, "Decoding subject-driven cognitive states with whole-brain connectivity patterns," Cereb Cortex, vol. 22, pp. 158-65, Jan 2012.
[6] Aric A. Hagberg, Daniel A. Schult and Pieter J. Swart, “Exploring network structure, dynamics, and function using NetworkX”, in Proceedings of the 7th Python in Science Conference (SciPy2008), Gäel Varoquaux, Travis Vaught, and Jarrod Millman (Eds), (Pasadena, CA USA), pp. 11–15, Aug 2008.
[7] H. Ravishankar, R. Madhavan, R. Mullick, T. Shetty, L. Marinelli and S. E. Joel, "Recursive feature elimination for biomarker discovery in resting-state functional connectivity," 2016 38th Annual International Conference of the IEEE Engineering in Medicine and Biology Society (EMBC), Orlando, FL, USA, 2016, pp. 4071-4074.doi: 10.1109/EMBC.2016.7591621
Figures